
AJ Christensen

About AJ Christensen
Affiliations (Current and Past)
- ACM SIGGRAPH
Bio
SIGGRAPH Asia 2019
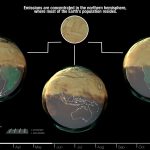
AJ Christensen is a visualization programmer for the Advanced Visualization Lab at the National Center for Supercomputing Applications at the University of Illinois at Urbana-Champaign. He focuses on scripting, scene design, derived data, and data flow, and I is a super-user of visual effects tools like Maya and Houdini. In addition to his film credits with the AVL, he contributed to the science-inspired renderings of gravitational lensing around a black hole in the Christopher Nolan film “Interstellar” at Double Negative.
SIGGRAPH Member Profile
- Click to view AJ Christensen's member profile
SIGGRAPH Conference Organizing Committee Positions
Positions
- SIGGRAPH 2019: Conference Committee - Posters Coordinator
SIGGRAPH Organization Committee Positions
Current (Steering) Committee Member
- ACM SIGGRAPH Chapters Committee
Leadership History Overview
- Chapters Committee Member: 2025-2026 - 2018-2019 - 2017-2018 - 2016-2017 - 2015-2016 - 2014-2015 - 2013-2014 - 2012-2013 - 2011-2012 - 2010-2011
- Chapters Chair: 2024-2025 - 2023-2024 - 2022-2023 - 2021-2022 - 2020-2021 - 2019-2020
Conference Contributions
Animations / Videos
-
 Directed by:
 Directed by:
 Experiences
-
ACM SIGGRAPH Village
 Contributor(s):Entry #: 15
Birds of a Feather
VR Experiences


Other Information
Roles
- ACM SIGGRAPH Village Presenter
- Appy Hour Organizing Committee Chair/Co-Chair
- Birds of Feather Presenter
- Computer Animation Organizing Committee Member
- Course Presenter
- Immersive Pavilion (VR Village) Developer
- Poster Presenter
- Posters Organizing Committee Chair
- Posters Organizing Committee Member
- Production Session Presenter
Submit a Story
- If you would like to submit a story about this person (please keep it funny, informative and true), please contact us: historyarchives@siggraph.org
If you find errors or omissions on your profile page, please contact us: historyarchives@siggraph.org
Did you know you can send us a photo of yourself and a bio and we will post it? Make sure the photo is at least 1000 x 1000 and send it to the email above along with the bio and we will add it to your page.