
Kalina Borkiewicz
Most Recent Affiliation(s):
- National Center for Supercomputing Applications (NCSA), Advanced Visualization Lab, Principal Research Programmer
Other / Past Affiliation(s):
- University of Illinois at Urbana-Champaign
Experience Category: Organizing Committee Co-Chair/Adminitrative Assistant:
Course Organizer:
- SIGGRAPH 2017, "Communicating Science Through Visualization in the Age of Alternative Facts"
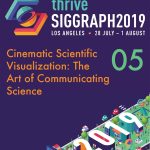
- SIGGRAPH 2019, "Cinematic Scientific Visualization: The Art of Communicating Science"
- SIGGRAPH 2020, "Introduction to Cinematic Scientific Visualization"
Experience Category: Jury Member:
Animation/Video(s):
Experience(s):
Type: [BOF]
Colorful Insights: Unleashing the Impact of Color in Visualization
[Zacks] [Borkiewicz] [Levy]
[SIGGRAPH 2023]
Type: [VR Experiences]
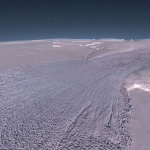
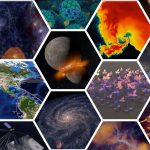
Dynamic Earth: Scientific Visualization Excerpts
Developer(s): [Cox] [Patterson] [Levy] [Christensen] [Borkiewicz] [Carpenter]
Entry No.: [19]
[SIGGRAPH 2015]
Type: [VR Experiences]
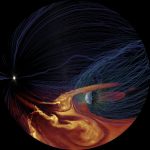
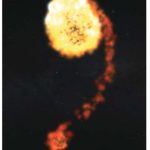
Solar Superstorms: Scientific Visualization Excerpts
Developer(s): [Cox] [Patterson] [Levy] [Christensen] [Borkiewicz] [Carpenter]
Entry No.: [48]
[SIGGRAPH 2015]
Learning Category: Presentation(s):
Type: [Courses]
Evidence-based science communication: through cinematic scientific visualization Presenter(s): [Jensen] [Borkiewicz] [Naiman] [Carptenter]
Entry No.: [08]
[SIGGRAPH 2022]
Type: [Production Sessions]
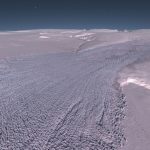
Using scientific data to show climate change in "Atlas of a Changing Earth" Presenter(s): [Borkiewicz] [Levy] [Carpenter] [Patterson] [Christensen]
[SIGGRAPH 2022]
Type: [Courses]
Cinematic Scientific Visualization: The Art of Communicating Science Organizer(s): [Borkiewicz]
Presenter(s): [Borkiewicz] [Christensen] [Wyatt] [Shirah] [Kostis]
Entry No.: [05]
[SIGGRAPH 2019]
Type: [Posters]
Interactive Cinematic Scientific Visualization in Unity Presenter(s): [Shih] [Borkiewicz] [Christensen] [Cox]
Entry No.: [69]
[SIGGRAPH 2019]
Role(s):
- Animation Director
- Birds of Feather Presenter
- Computer Animation Jury Member
- Course Organizer
- Course Presenter
- Immersive Pavilion (VR Village) Developer
- Poster Presenter
- Production Session Presenter
If you find errors or omissions on your profile page, please contact us: historyarchives@siggraph.org
Did you know you can send us a photo of yourself and a bio and we will post it? Make sure the photo is at least 1000 x 1000 and send it to the email above along with the bio and we will add it to your page.