“Interactive Exploration of Environmental Concerns on Planet Earth” by Rhyne
Conference:
- SIGGRAPH 1995
-
More from SIGGRAPH 1995:


Type(s):
Title:
- Interactive Exploration of Environmental Concerns on Planet Earth
Program Title:
- Interactive Communities
Presenter(s):
Collaborator(s):
- Polly Baker
- Gloria Brown-Simmons
- Peter Kochevar
- John Rasure
- Dudley Bromley
- Mark Bolstad
- Tom Boomgaard
- Al Bourgeois
- Todd Plessel
- Penny Rheingans
- Dan Santistevan
- Becky Bishop
- Horace Mitchell
- John Cavallo
- Paul Diggins
- Raul Garza-Robles
- William Krauss
- Kevin Mahoney
- Pamela O’Neil
- Shahram Shiri
- Cynthia Starr
- James Strong
- Raymond Twiddy
- Richard White
- Mitchell Weiss
- Fritz Hasler
- Jeff de La Beaujardiere
- Marit Jentoft-NiIsen
- Barbara Mones
Description:
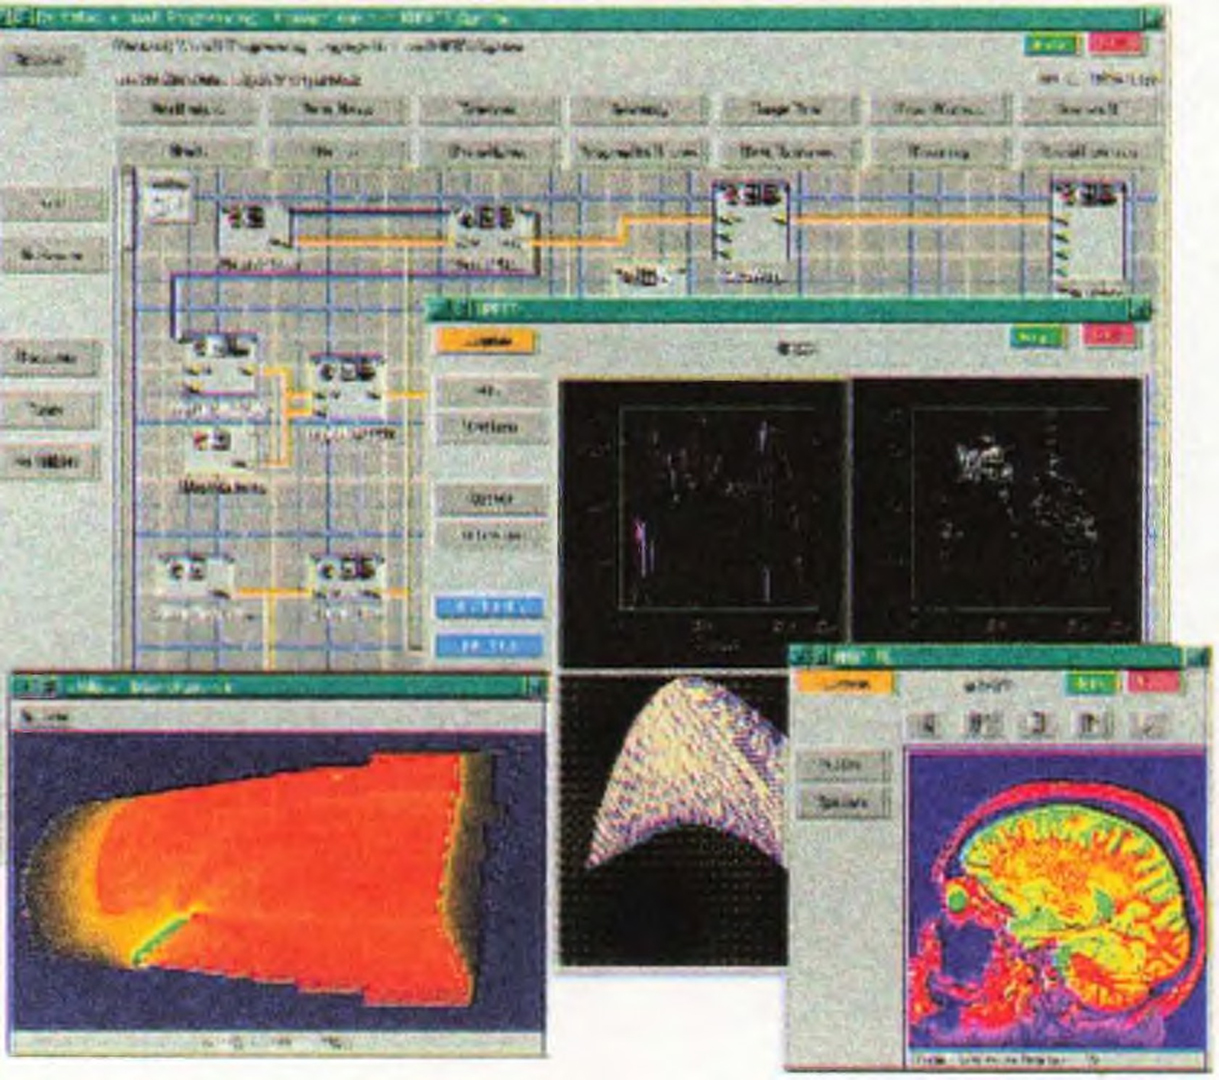
- Khoral Research Inc. demonstrates a complete application development system that redefines the software engineering process to include all members of the work group, from application end-users to infrastructure/visualization programmers.
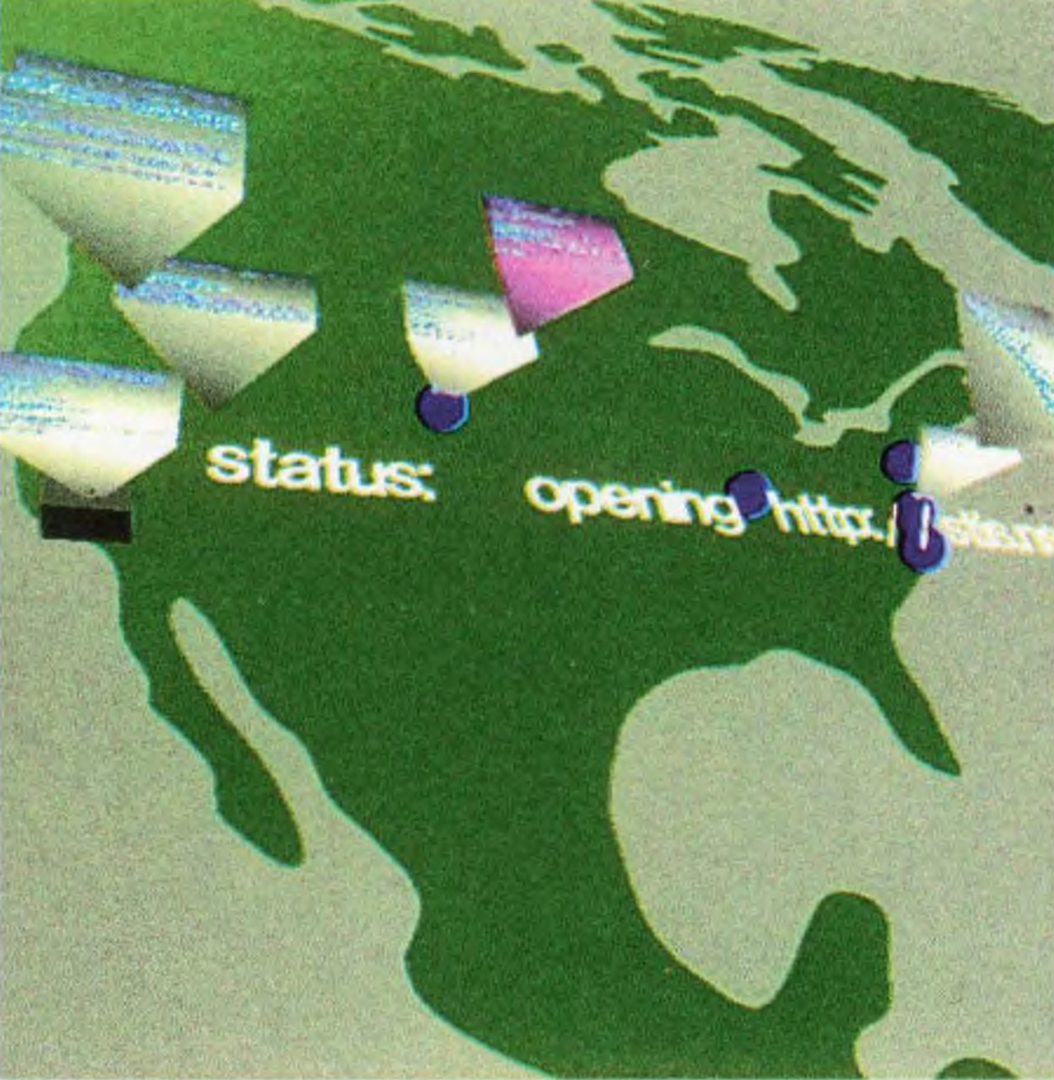
- The Sequoia 2000 Project, San Diego Supercomputer Center demonstrates the Tecate environment, which supports collaborative computing, desktop video conferencing, database management, and visualization of earth sciences data among researchers located at multiple remote sites.
- The National Center for Supercomputing Applications shares newly developed task-directed visualization tools that assist specific inquiry and analysis activities of scientists, policy makers, educators, students, and the general public as they deal with environmental concerns.
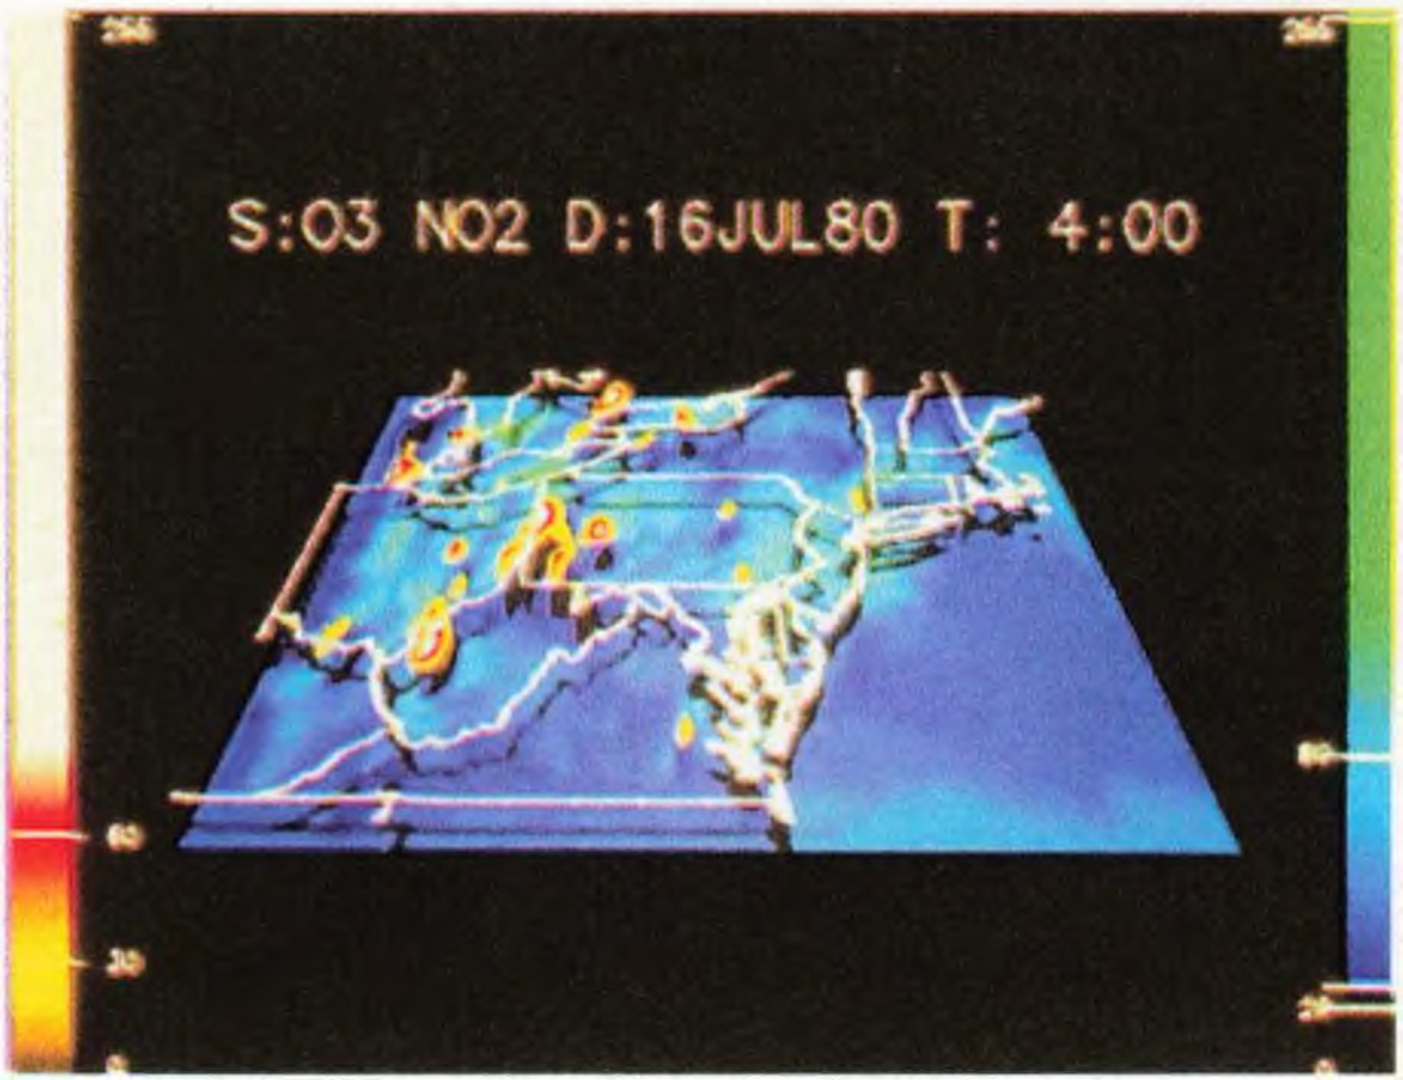
- The U.S. Environmental Protection Agency’s Scientific Visualization Centers and the National Environmental Supercomputing Center demonstrate a newly developed user interface, visualization, model-calibration, and collaborative-computing tool for air pollution and water quality modeling and decision support.
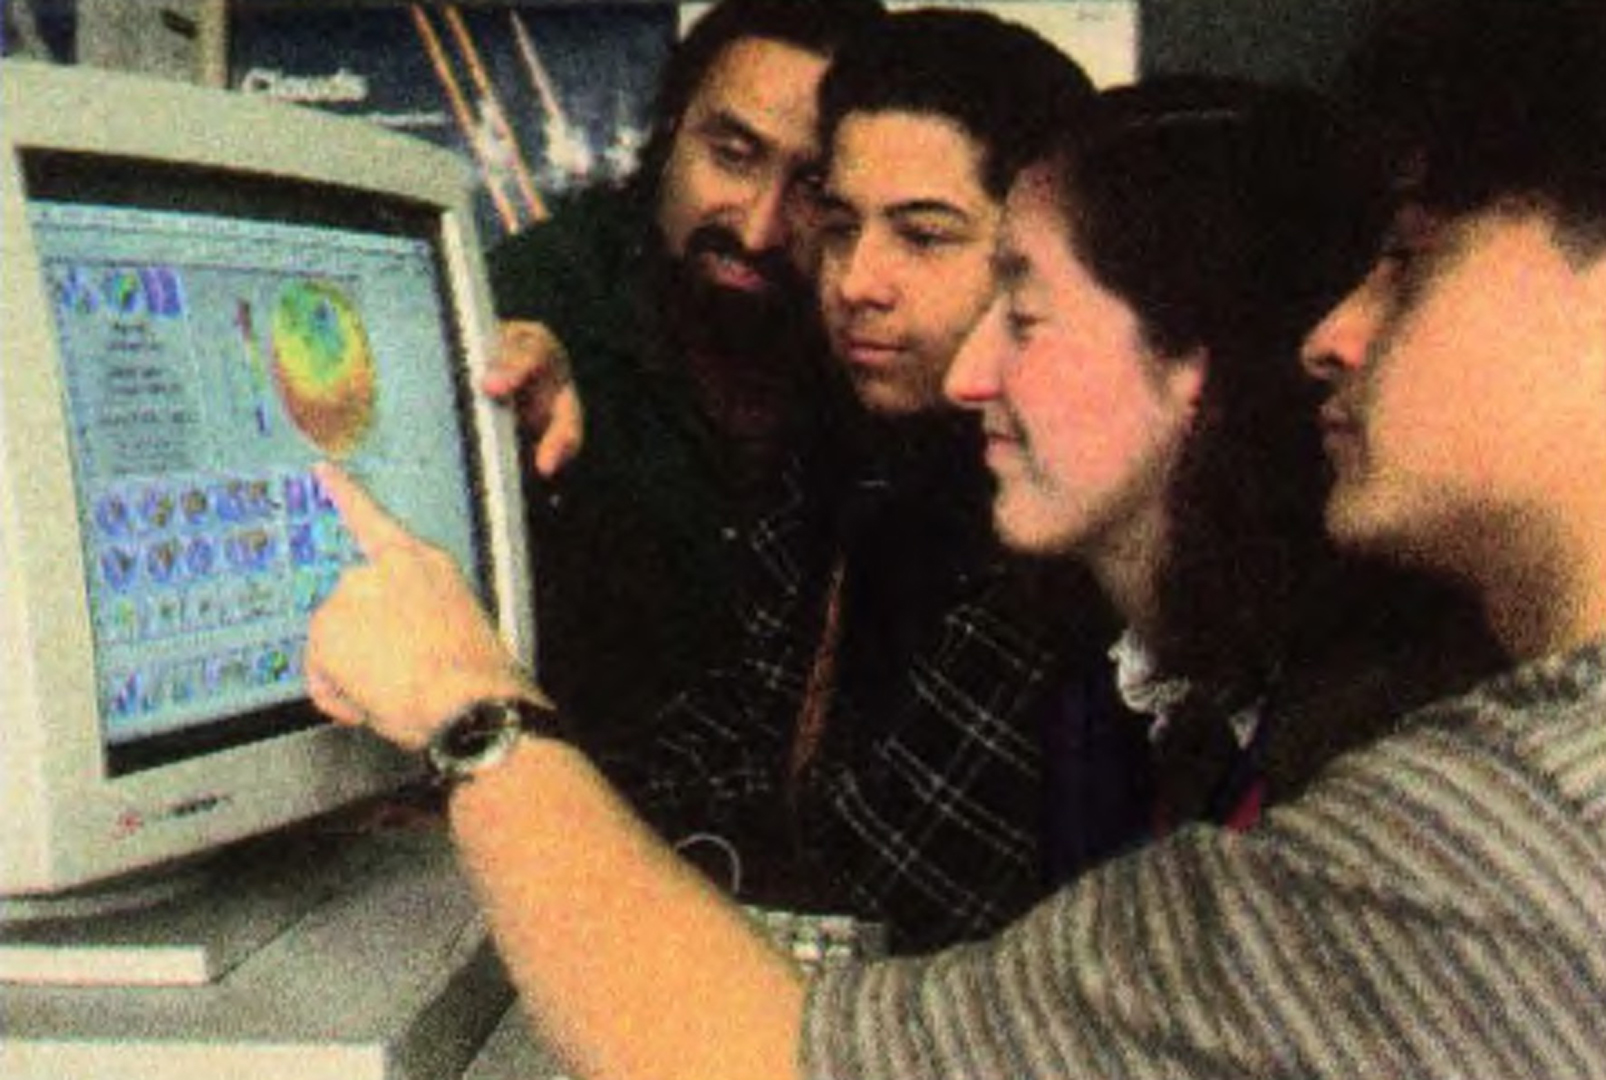
- The Global Learning and Observations to Benefit the Environment (GLOBE) educational program shows its newly created interactive visualization tool for networking K-l 2 students and institutions throughout the world. The GLOBE tool supports students’ efforts to conduct environmental observations about planet Earth.
This Interactive Communities exhibit gives participants an opportunity to learn how researchers, policy analysts, educators, decision-makers, and students use an umbrella of computer graphics and scientific computing techniques to examine environmental concerns. Four research groups and one educational program present real-time demonstrations of the latest visualization and decision support tools for environmental and earth sciences exploration:
http:/ / www.epa .gov/
http://www.khoros.unm.edu/
http://www.sdsc.edu/SDSC/Research/Visualization/Tecate/
http://globe.gsfc.nasa.gov/globe
Additional Images:


