“Weaving versus blending: a quantitative assessment of the information carrying capacities of two alternative methods for conveying multivariate data with color” by Hagh-Shenas, Interrante, Healey and Kim
Conference:
Type(s):
Title:
- Weaving versus blending: a quantitative assessment of the information carrying capacities of two alternative methods for conveying multivariate data with color
Presenter(s)/Author(s):
Abstract:
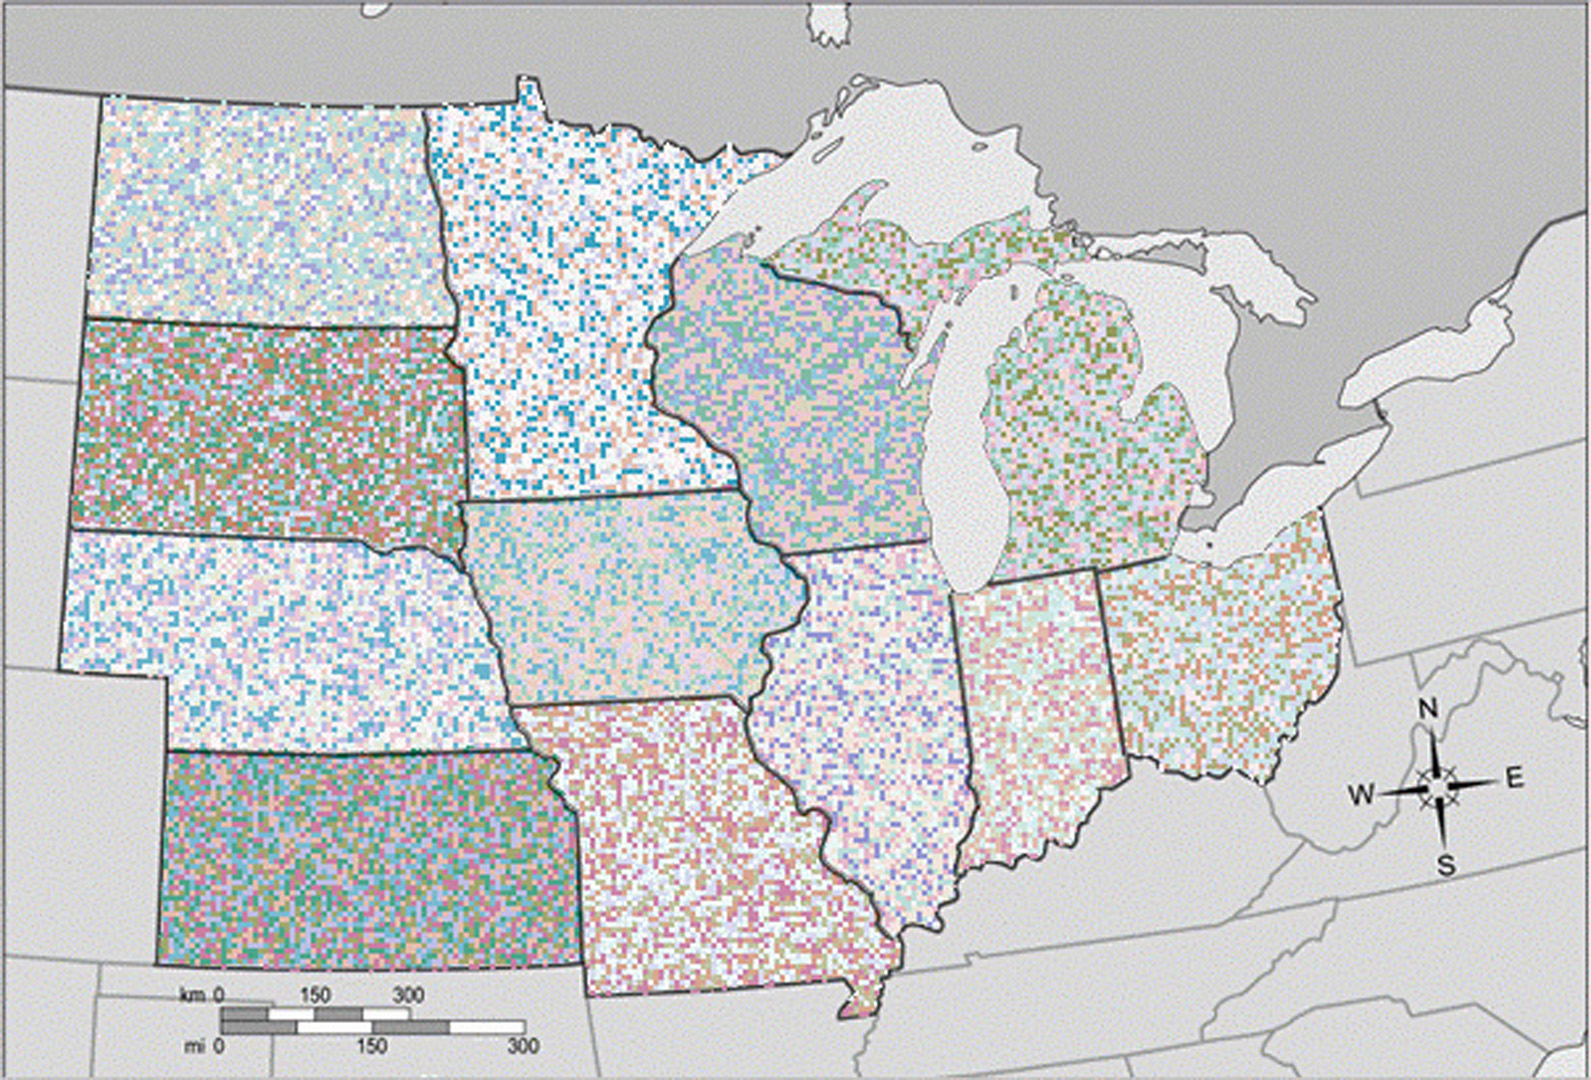
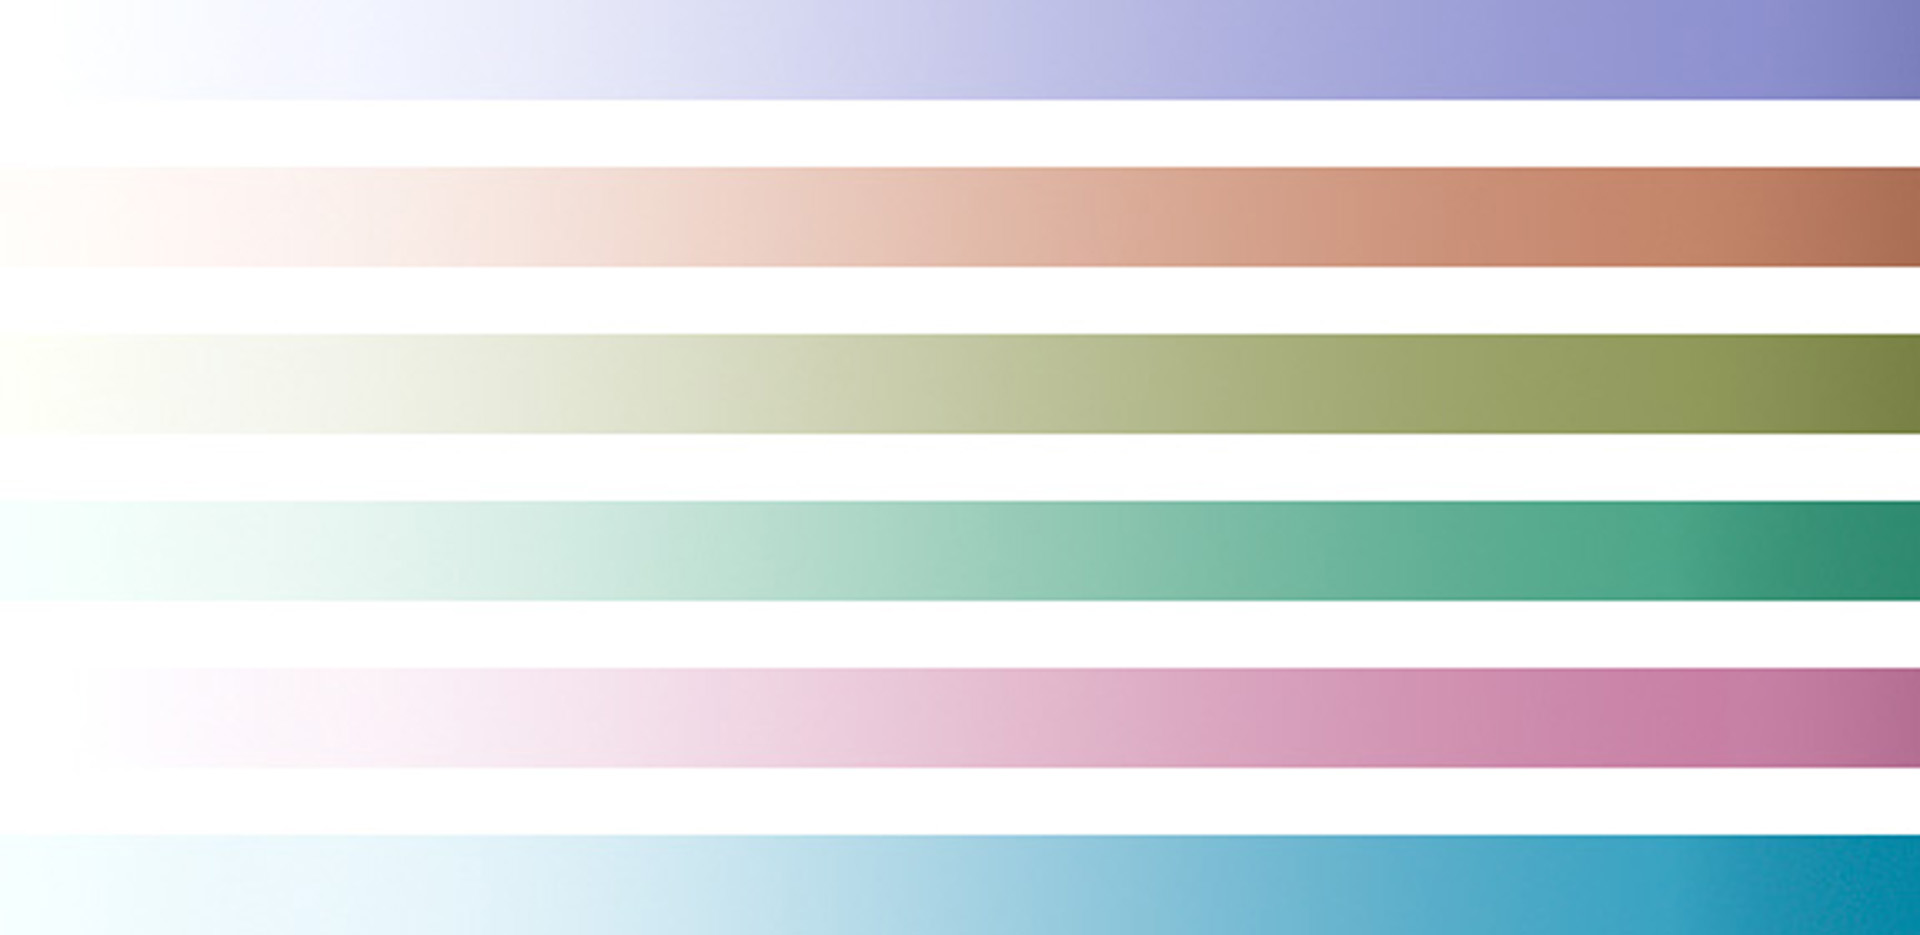
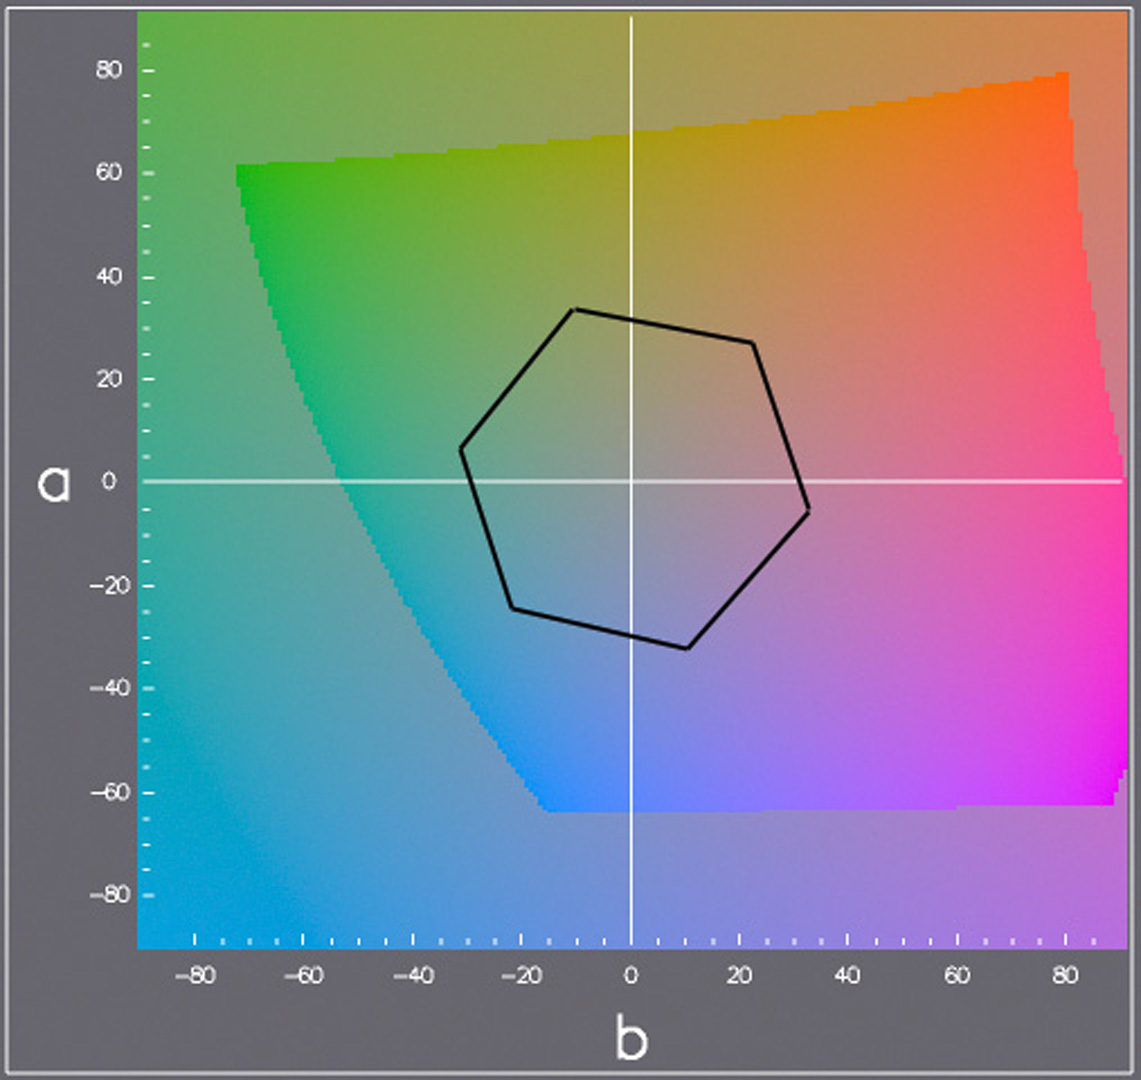
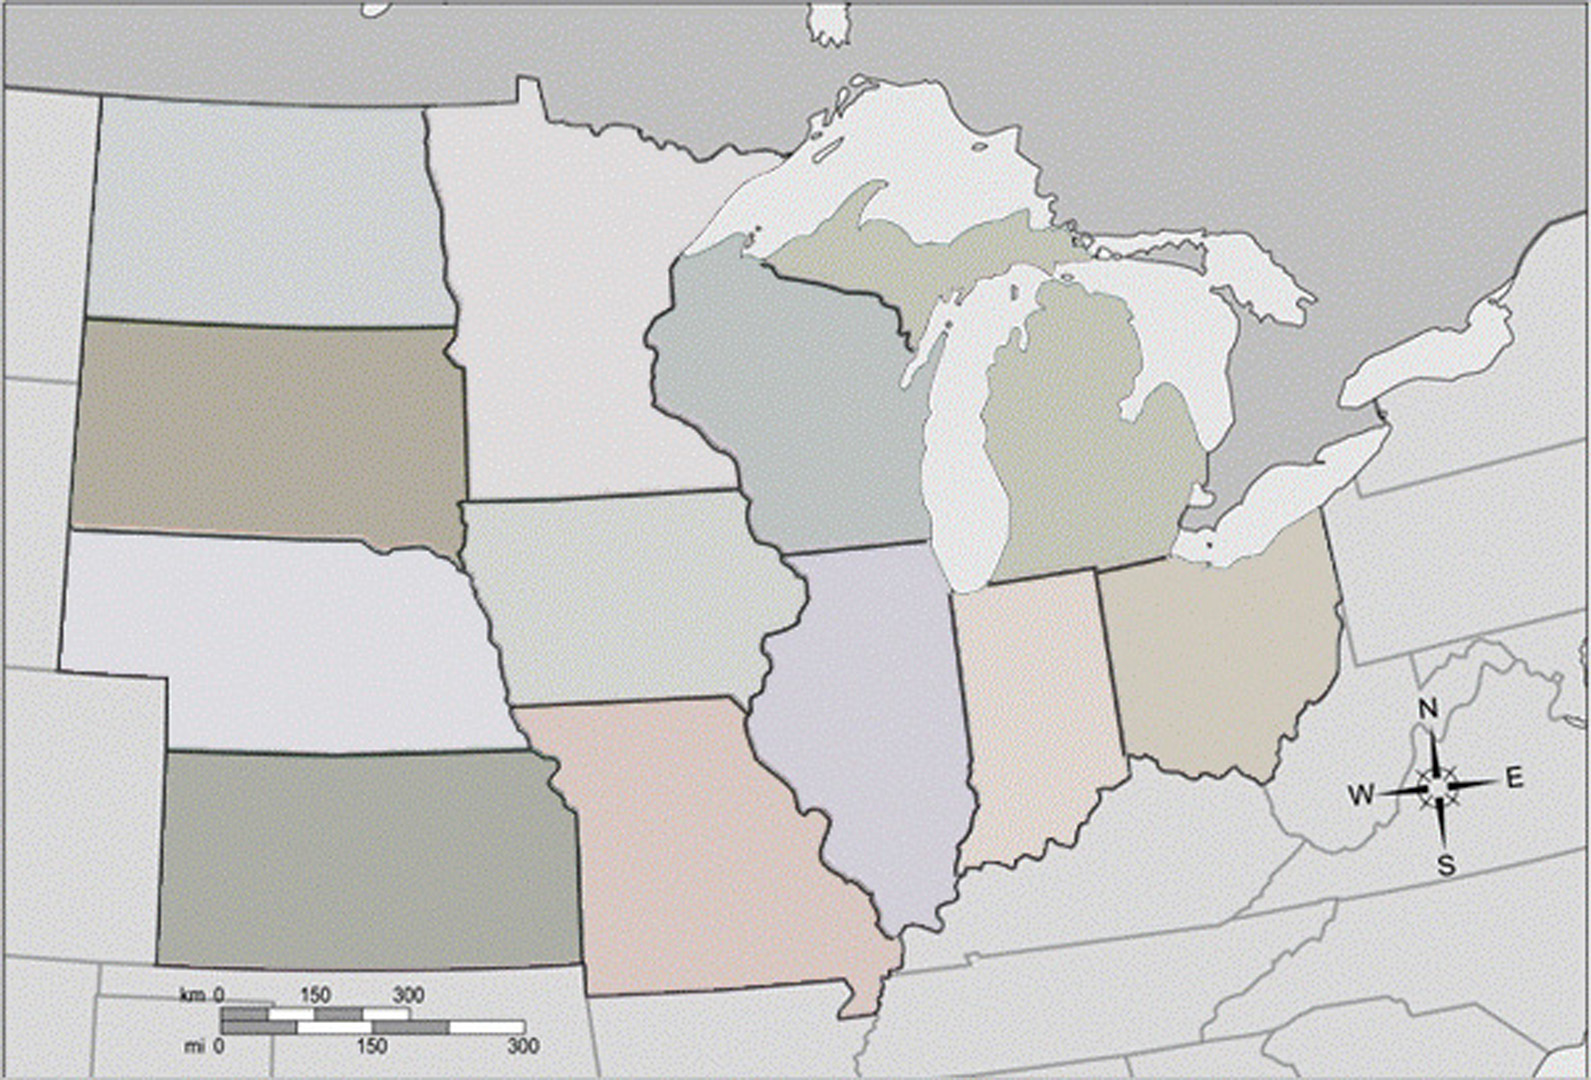
In this poster we present the results of two experiments in which we seek insight into the fundamental information-carrying capacities of two alternative methods for encoding multivariate information using color: color blending and color weaving [1].We begin with a baseline experiment, in which we assess participants’ abilities to accurately read numerical data encoded via one of six different single-hued color scales defined via joint variations in saturation and luminance from 6 base colors (fig 1).To obtain the base colors, we selected six points evenly spaced about a circle of large constant saturation in the monitor gamut on a plane of constant luminance in the Lab color space (figure 2).From our first experiment, we were able to determine the average baseline level of accuracy that participants were able to achieve on the color matching task when asked to match a single color.In our main experiment, we assessed participants’ abilities to read combinations of 2, 3, 4 and 6 different data values simultaneously represented across a common region of the domain, encoded using either color blending, in which a single mixed color is formed via linear combination of the individual component colors, defined in Lab space (figure 3), or color weaving, in which the individual component colors appear side-by-side in a high frequency texture that fills the region (figure 4). Participants’ viewing distance was restricted so that the blocks of constant color within this texture would subtend either 3 or 6 minutes of visual angle.Our results indicate that performance was significantly better when the original color information was available via the high frequency texture than when the colors were blended (fig 5), and that this difference increased with the number of components.
References:
1. Urness, T., Interrante, V., Longmire, E., Marusic, M. and Ganapathisubramani, B., 2003. Effectively Visualizing Multi-Valued Flow Data Using Color and Texture, In Proceedings of IEEE Visualization 2003, 115–121.
Additional Images:
-

- 2006 Poster: Hagh-Shenas_Weaving versus Blending: a quantitative assessment of the information carrying capacities of two alternative methods for conveying multivariate data with color
-

- 2006 Poster: Hagh-Shenas_Weaving versus Blending: a quantitative assessment of the information carrying capacities of two alternative methods for conveying multivariate data with color