
“An interactive computer graphics approach for dissecting a mixture of normal (or lognormal) distributions” by McCammon
Conference:
Type(s):
Title:
- An interactive computer graphics approach for dissecting a mixture of normal (or lognormal) distributions
Presenter(s)/Author(s):
Abstract:
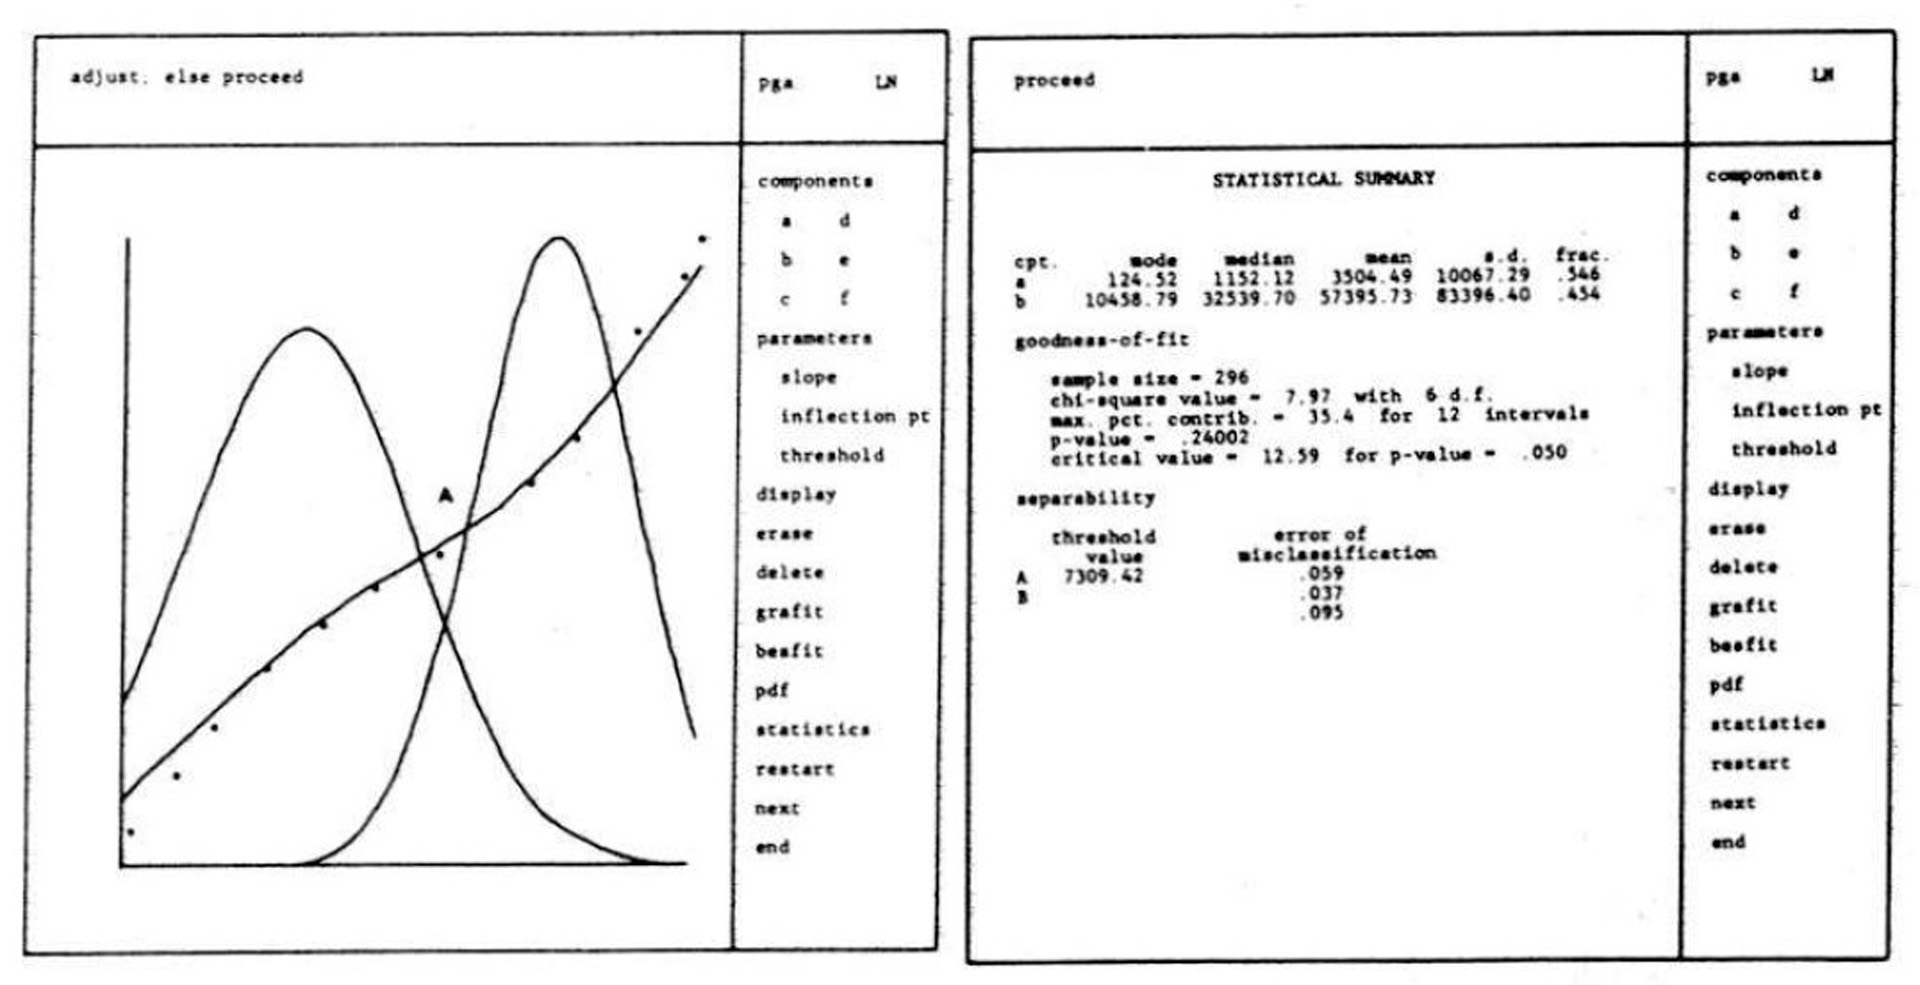
An interactive computer graphics program has been developed to dissect mixtures of normal (or lognormal) distributions. The program incorporates both graphical and analytical techniques to obtain a more satisfactory solution to the problem of dissection. Within a matter of minutes, a mixed frequency curve can be decomposed into its normal (or lognormal) components. A statistical summary following dissection makes it possible to evaluate the goodness-of-fit and the separability of the inferred subpopulations. Individual components can be added or subtracted and adjustments can be made to individual parameters of components. An example of dissection is given in geology and in sports.
References:
1. Karl Pearson, Contributions to the mathematical theory of evolution, Phil. Trans, Royal Soc. London, vol. 185A, 1894, 71-110.Google Scholar
2. C. G. Bhattacharya, A simple method of resolution of a distribution into Gaussian components, Biometrics, vol. 23, 1967, 115-135.Google ScholarCross Ref
3. A. Hald, Statistical theory with engineering applications, John Wiley, New York, 1952.Google Scholar
4. J. Gregor, An algorithm for the decomposition of a distribution into Gaussian components, Biometrics, vol. 25, 1969, 79-93.Google Scholar
5. Stephen V. Balint, Identifying parameters of hetergeneously mixed normal populations using curve fitting techniques, Intern Training Center Report No. USAMC-ITC-2-71-25, NTIS AD 761021, U.S. Dept. of Commerce, July, 1971.Google Scholar
6. J. P. Harding, The use of probability paper for the graphical analysis of polymodal frequency distributions, Jour. Mar. Biol. Assoc., vol. 28, 1949, 141-153.Google ScholarCross Ref
7. Derek W. Spencer, The interpretation of grain size distribution curves of clastic sediments, Jour. Sediment. Petrol., vol. 33, 1963, 180-190.Google Scholar
8. A. J. Sinclair, Selection of threshold values in geochemical data using probability graphs, Jour. Explor. Geochem., vol. 3, 1974, 129-149.Google ScholarCross Ref
9. George S. Koch, Jr. and Richard F. Link, Statistical analysis of geological data, John Wiley, New York, 1971.Google Scholar
10. G. J. Dickie and G. D. Williams, Geologic features of oil and gas pools, Twenty Fourth Internat. Geol. Congress, Sec. 16 1972, 103-111.Google Scholar
11. PGA Tour, 1975 Statistics, Tournament Players Division, PGA, Wash., D.C.Google Scholar