
“NCSA Scientific Visualization 1988” by Fangmeier
Title:
- NCSA Scientific Visualization 1988
Conference:
SIGGRAPH Video Review:
- Issue 38: SIGGRAPH '88 Film & Video Show (Track #07)
Director(s):
Company / Institution / Agency:
- University of Illinois
Description:
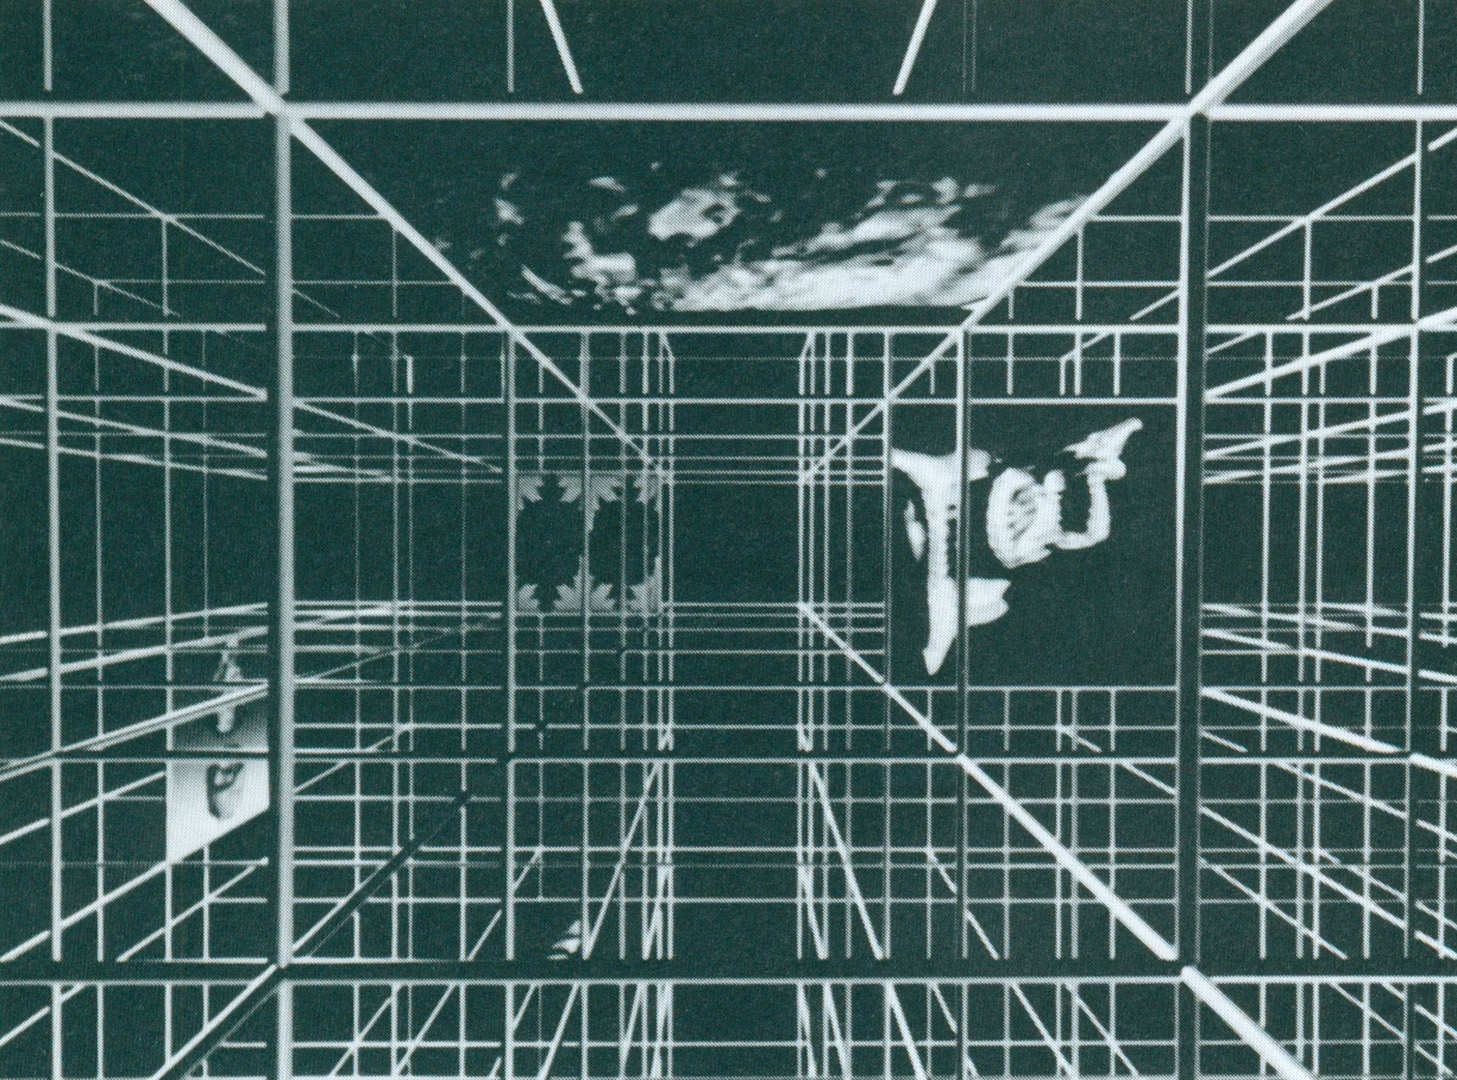
This tape presents the aesthetic highlights of scientific visualization projects by the National Center for Supercomputing Applications. NCSA, a nonprofit organization, provides access to advanced scientific computing resources and new approaches to interdisciplinary research to scientists. These visualizations (originally two to 12 minutes in length), envision large scientific databases from many research areas. Scientists use visualization both to understand their data and to communicate their findings to their peers . AIl GCI was created on Wavefront and in-house modeling and imaging software on the Sun 3/60, SGI IRIS 3130 and Raster Technologies hardware. Rendered performed on an AlliantF/X-80, images are recorded on ¾” videotape via an Abekas A62.
Additional Contributors:
Produced by: Stefen Fangmeier
Manager/animator: Ronnie Johnston
Assistant: Matthew Arrott
Senior Programmer: Michael Johnson
Programmer: Colleen Bushell
Art Director/Animator: Jeffery Yost
Programmer/Animator Additional collaboration by: Michelle Mercer
Animator: Craig Upson
Research Scientist: Donna Cox
Research Artist: RayIdaszak
Visualization Research programmer