
Roger Edberg
Learning Presentation(s):
Type: [Talks (Sketches)]
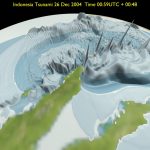
Data Visualization Strategies for Tsunami Research Presenter(s): [Edberg]
[SIGGRAPH 2005]
Role(s):
If you find errors or omissions on your profile page, please contact us: historyarchives@siggraph.org
Did you know you can send us a photo of yourself and a bio and we will post it? Make sure the photo is at least 1000 x 1000 and send it to the email above along with the bio and we will add it to your page.