
“SketchGraph: gestural data input for mobile tablet devices” by Martino, Matchen, Ossher, Bellamy and Swart
Conference:
Type(s):
Title:
- SketchGraph: gestural data input for mobile tablet devices
Presenter(s)/Author(s):
Abstract:
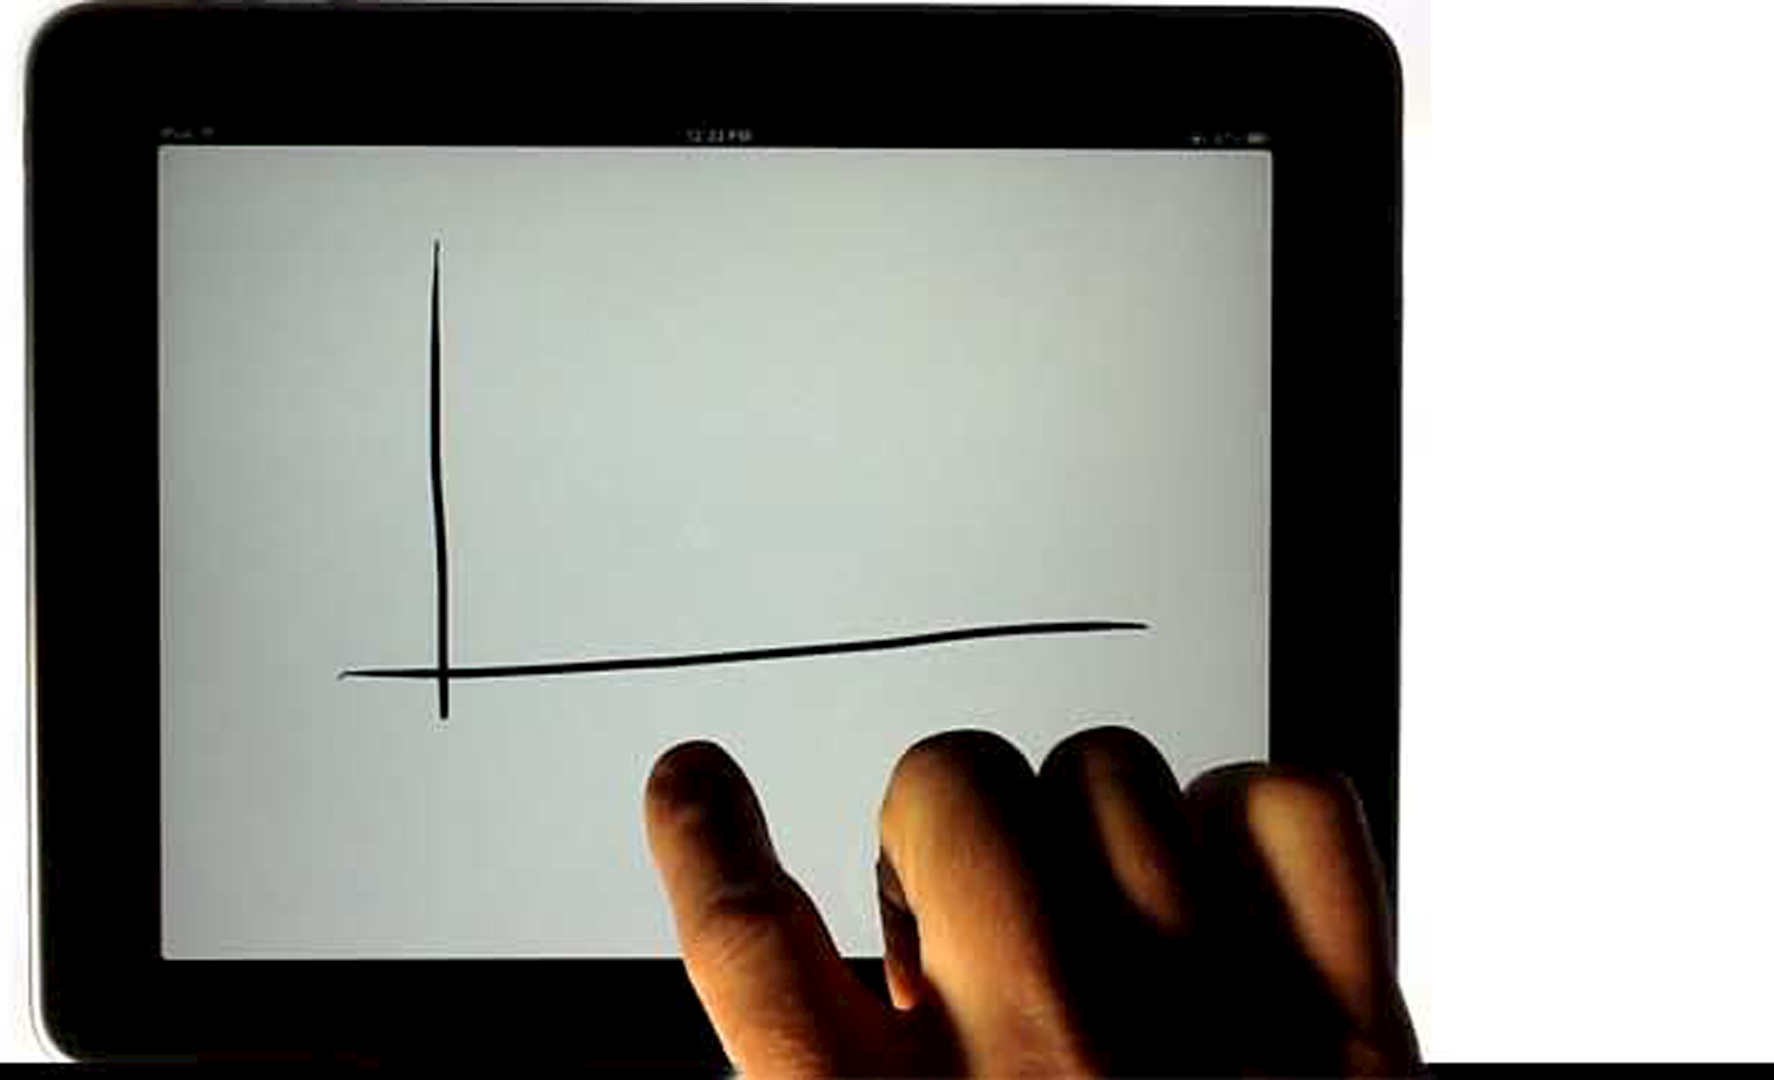
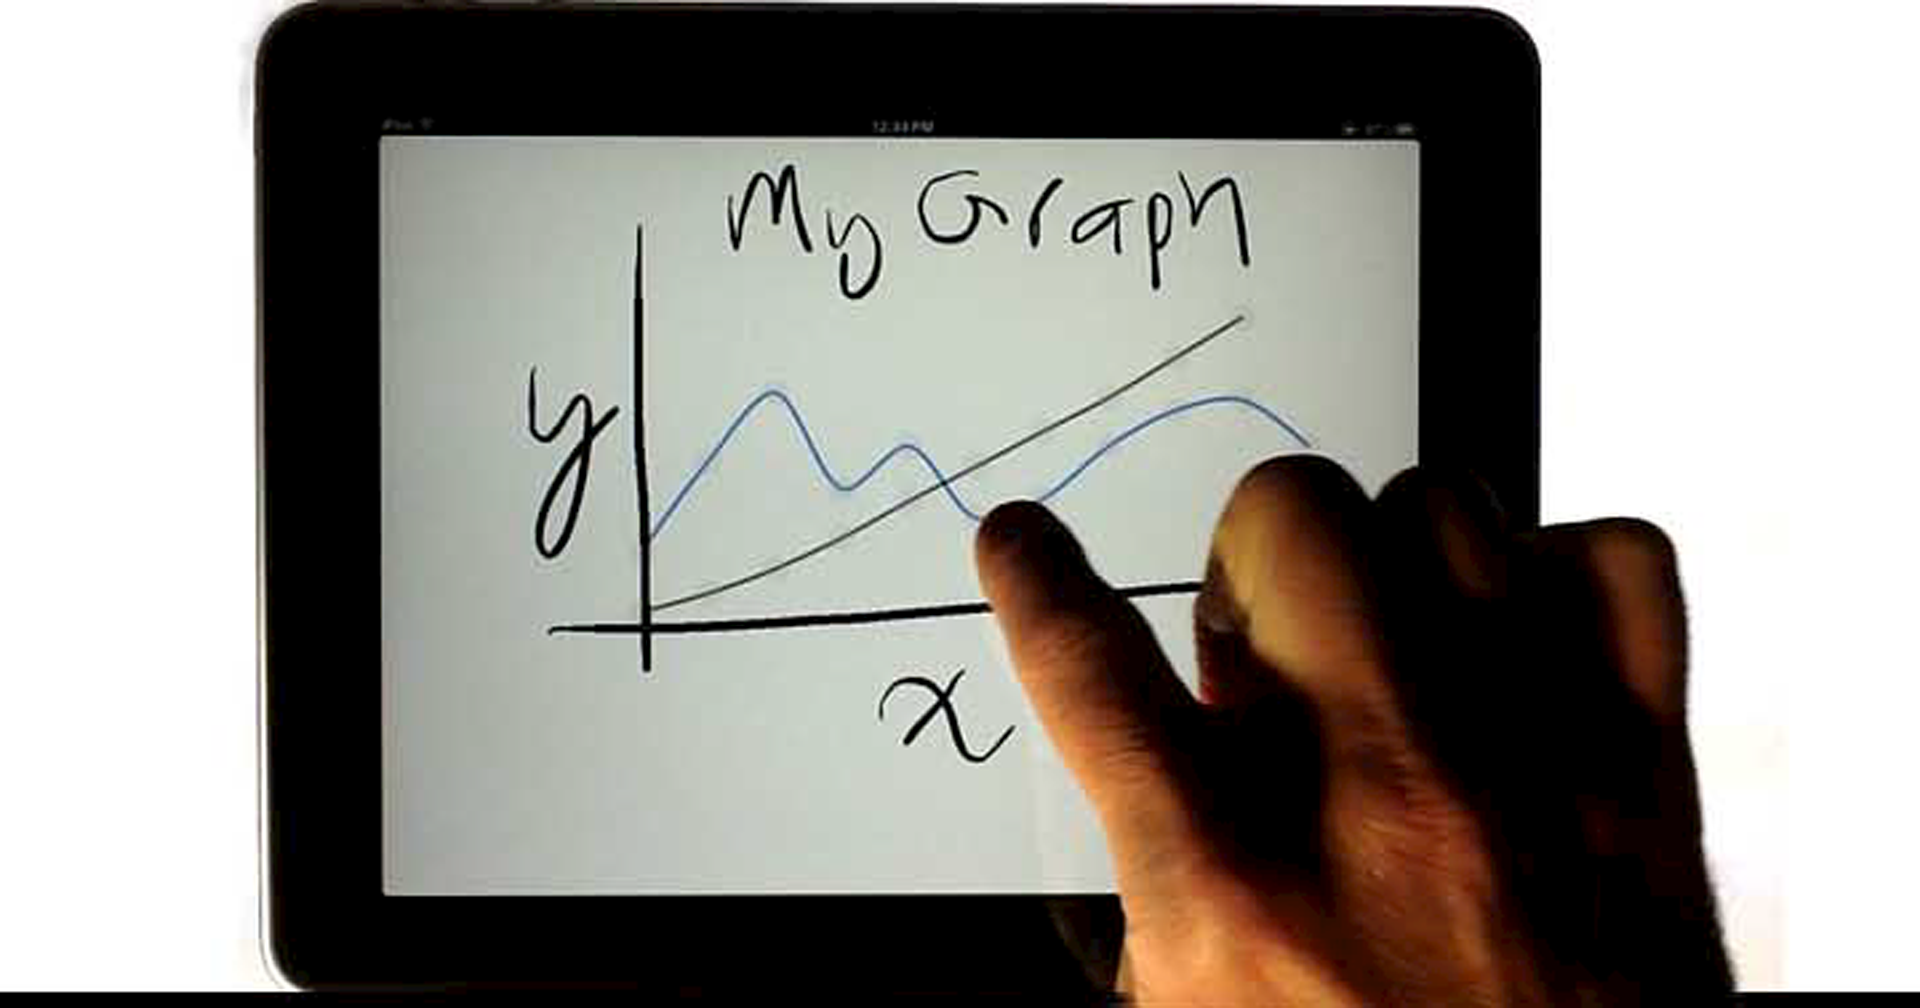
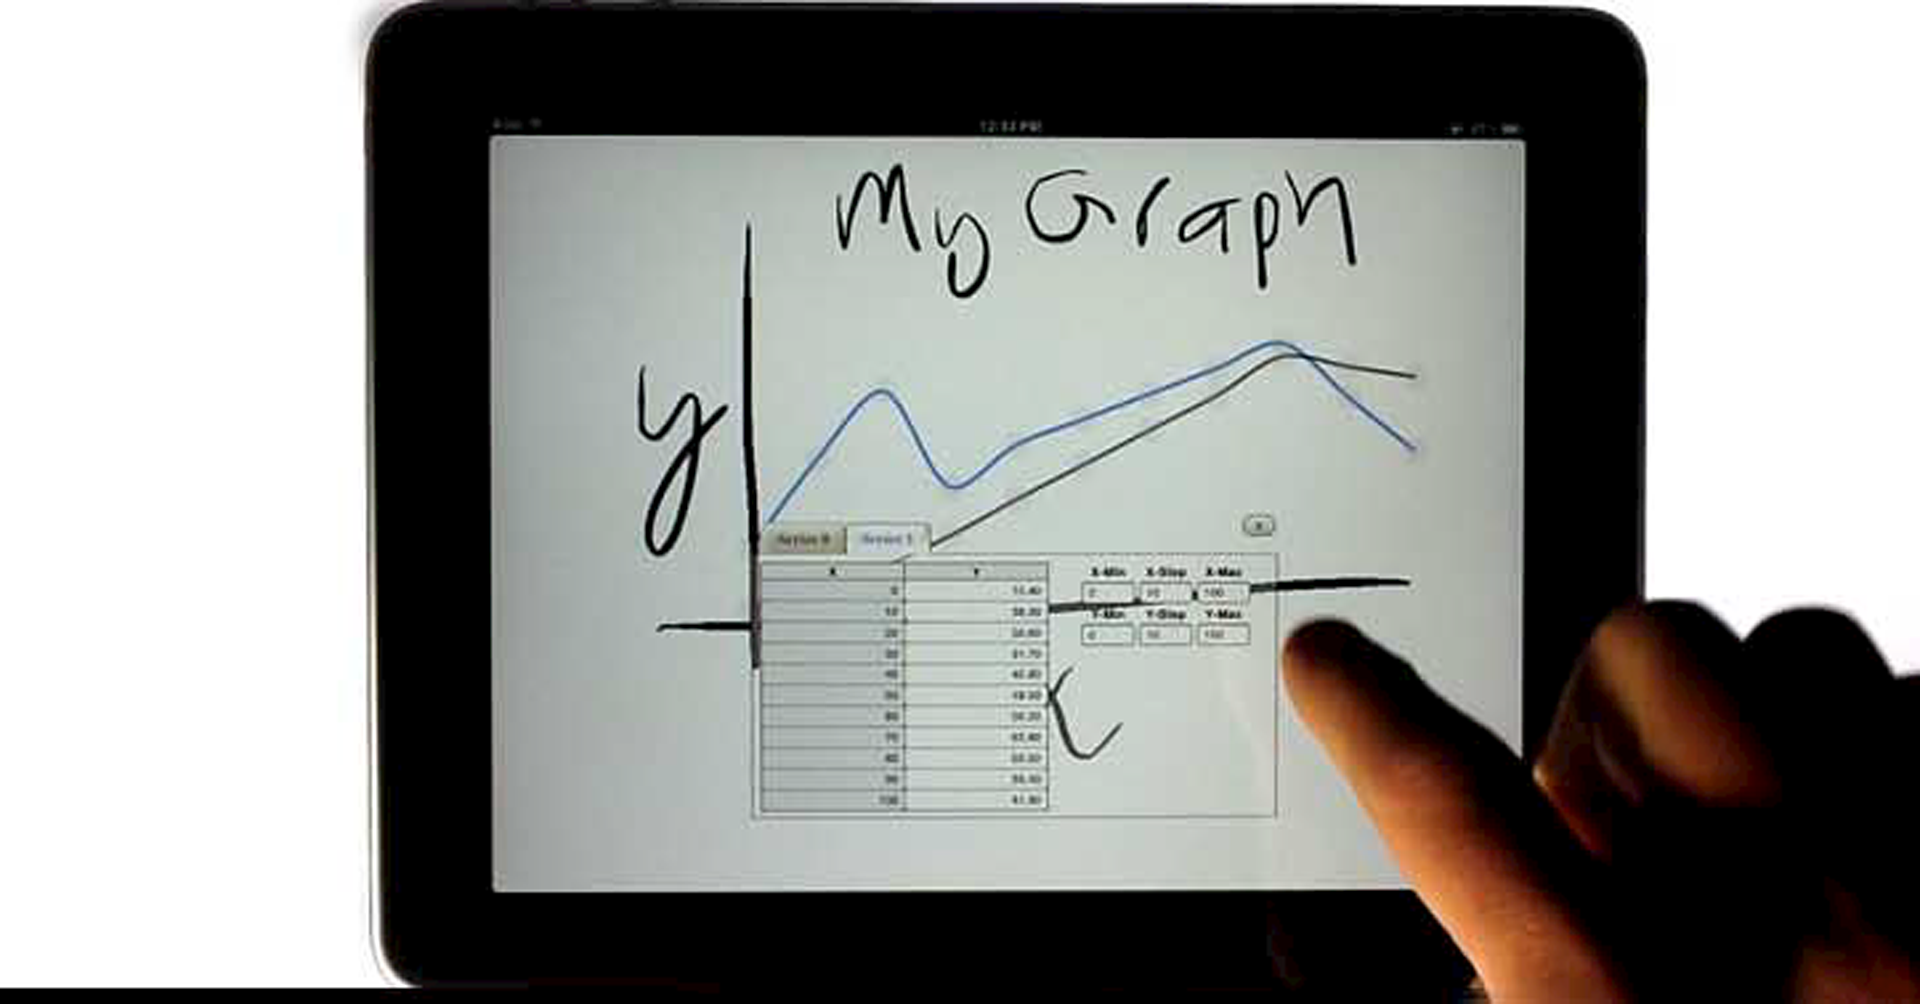
As tablets become ever more powerful and popular, people want to use them broadly, including for business applications like spreadsheet data graphing. Tablets are better suited to informal exploration through sketching, however, than to inputting data into a spreadsheet. It would be much more appealing, and suitable to the medium, to sketch a graph as if you were drawing on a napkin. We describe an early prototype to support a gestural, graphical interface for inputting and updating graph data that is as easy as drawing a few strokes. With it, users can focus on exploring their domain, rather than on the mechanics of data entry.
References:
1. Bellamy, R. K. E., et al., Sketching tools for ideation: NIER track. In Proceedings of ICSE. 2011, 808–811.
2. Csikszentmihalyi, M. 1990. Flow: The Psychology of Optimal Experience, New York: Harper and Row.
3. LaViola, J. J. Jr.. 2007. Mathematical sketching. In ACM SIGGRAPH 2007 courses (SIGGRAPH ’07). ACM, New York, NY, USA, Article 10
4. Tversky, B. et al. (2003). Sketches for design and design of sketches. In Ugo Lindemann (Ed), Human behavior in design: Individuals, teams, tools. Pp. 79–86. Berlin: Springer.D.