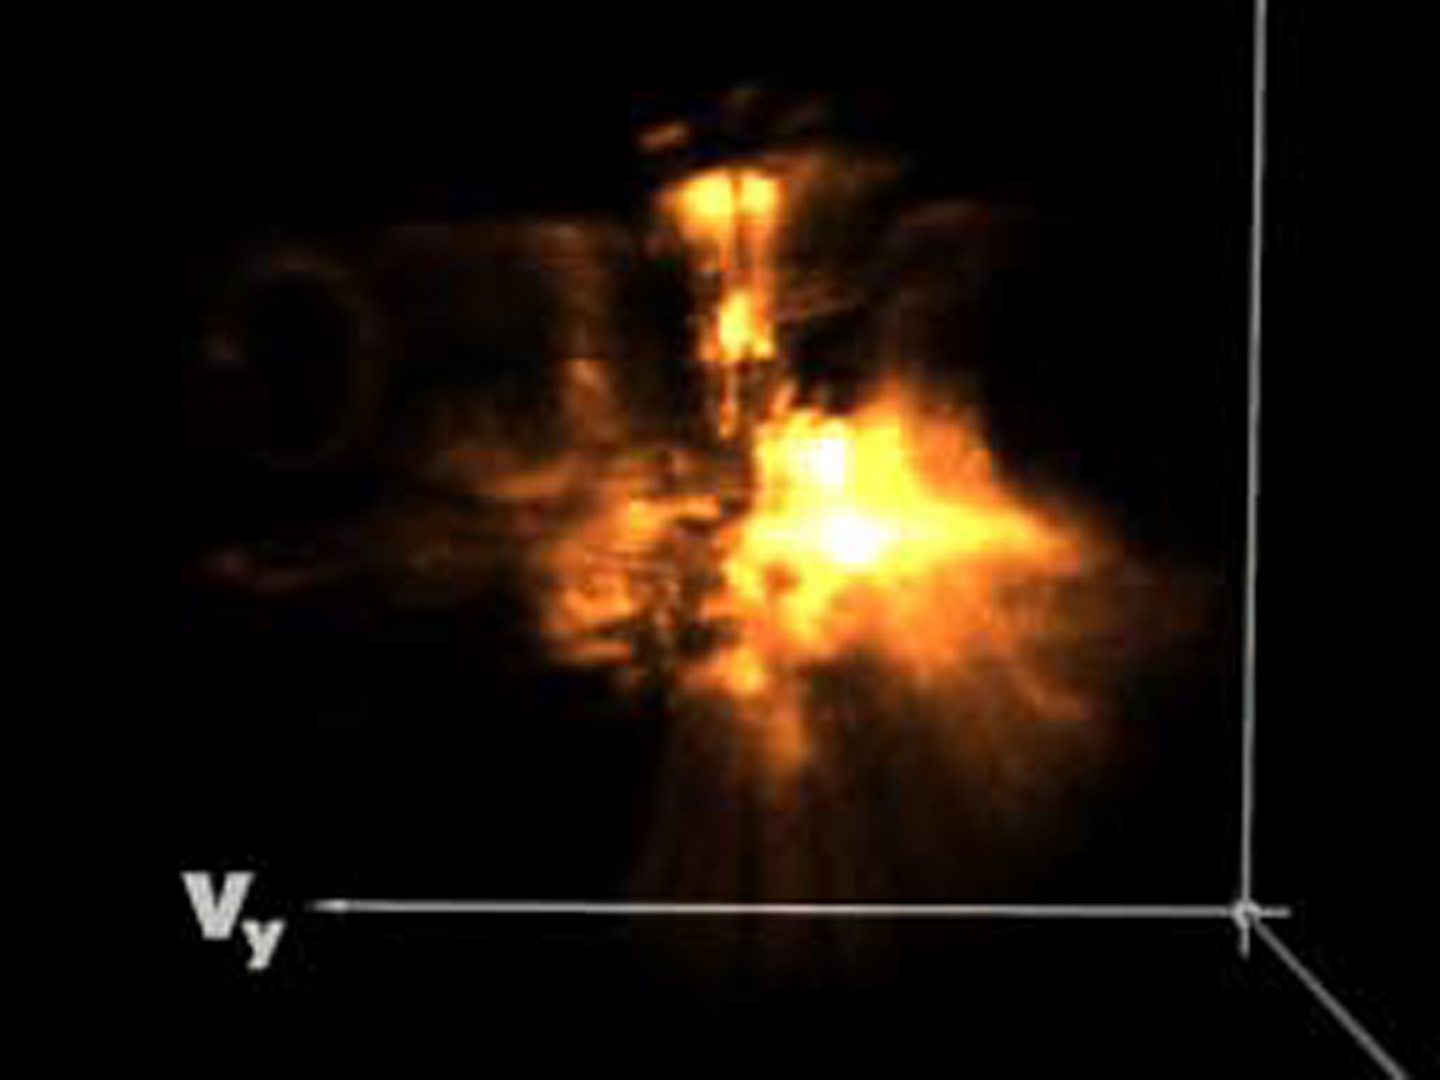
“Interactive visualization of large scale time varying data sets” by Ljung, Dieckmann and Ynnerman
Conference:
Type(s):
Interest Area:
- Application
Title:
- Interactive visualization of large scale time varying data sets
Session/Category Title: Applications
Presenter(s)/Author(s):
Abstract:
Visual analysis of time varying scientific data can be divided into four different categories with an increasing degree of user interaction. 1) Production of static images representing scientific data at selected times. 2) Production of video sequences in which graphical representation, time line and viewpoints are predefined. 3) Interactive streaming of logged data sets, allowing the user to alter graphical representation, filtering, time lines and viewpoints. 4) Real time interaction with the simulation or experiment that produces the data, allowing the user to alter parameters, graphical representation, filtering, time lines and viewpoints.
References:
1. McClements, K. G., Dieckmann, M. E., Ynnerman, A., Chapman, S. C. & Dendy, R. O. 2001. Surfatron and stochastic acceleration of electrons at supernova remnant shocks, In Phys. Rev. Lett., 25, No. 255002.
2. Ljung, P., Dieckmann, M., Andersson, N. & Ynnerman, A. 2000. Interactive Visualization of Particle In Cell Simulations. In Proceedings of IEEE Visualization 2000, pages 469–472.
3. Dieckmann, M. E., Ljung, P., Ynnerman, A., McClements, K. G. 2002. Three-dimensional visualization of electron acceleration in a magnetized plasma, In IEEE Transactions on Plasma Science, accepted for publication.


