
“Graphics for social scientists” by Schneider, Barge and Marks
Conference:
Type(s):
Title:
- Graphics for social scientists
Presenter(s)/Author(s):
Abstract:
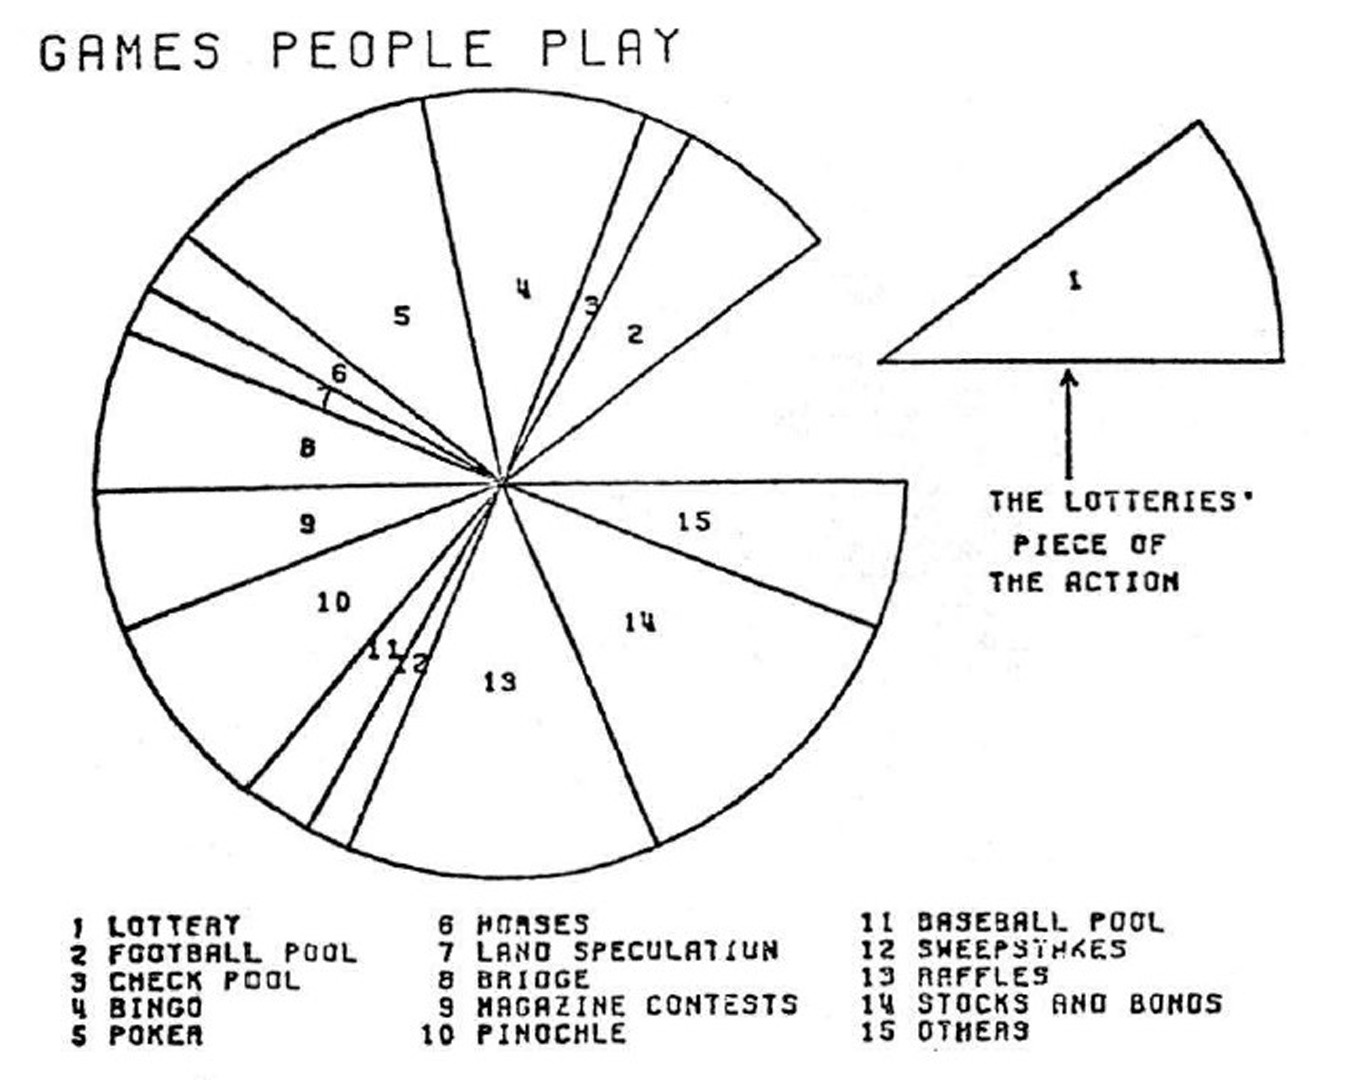
The social science computing environment and the implications of this for the developers of computer graphics is described. Graphic software developed for social scientists at the University of Michigan is illustrated. MULTIGROUP is used to generate displays in the process of data analysis. GRAPH is used to report results to others. A graphical editor is employed to customize displays.
References:
1. MIDAS is a sophisticated statistical system which is capable of performing a wide range of analyses and data manipulations. The multigroup command within MIDAS performs analyses requested by the user and then invokes our graphics routines and the supporting IG routines (see note 3 below) for plotting. For a description of MIDAS see Daniel J. Fox and Kenneth E. Guire (1974) Documentation for MIDAS Michigan Interactive Data Analysis System, the Statistical Research Laboratory, The University of Michigan, Ann Arbor.Google Scholar
2. GRAPH will be described below. A user’s writeup can be obtained from the Computer Support Group, Center for Political Studies, Institute for Social Research, P. O. Box 1248, Ann Arbor, Michigan 48106Google Scholar
3. The Integrated Graphics library was developed by the University of Michigan Computing Center. The library is described in a paper in these Proceedings by James Blynn and Andy Goodrich “The Internal Design of the IG Routines, an Interactive Graphics System for a Large Timesharing Environment.”Google Scholar
4. Norman Nie (1975) et al Statistical Package for the Social Sciences 2nd edition, McGraw-Hill, N.Y.Google Scholar
5. Institute for Social Research (1973), OSIRIS III, Ann Arbor, Michigan.Google Scholar
6. W. J. Dixon (Ed.) (1973) BMD, Bomedical Computer Programs. University of California Press, Berkeley, California.Google Scholar
7. There is no universal graphics terminology for the types of pictures we will describe. Hopefully the referents of these terms will become obvious, if only after seeing the examples used later in this paper.Google Scholar
8. For a discussion of an interactive graphic system used for factor analysis and multidimensional scaling see Edward J. Schneider and David John Gow, (1975) “Extending the Information Transfer in Multidimensional Analysis through the Use of Interactive Graphics,” Computer Graphics Vol. 9, pp. 191-200.Google Scholar
9. A standard text on regression analysis is Applied Regression Analysis by M. R. Draper and H. Smith (1966) Wiley, N.Y.Google Scholar
10. Perhaps the most innovative uses of graphics in statistics has been developed by John W. Tukey, Exploratory Data Analysis, Addison-Wesley, Reading Mass. (forthcoming).Google Scholar
11. For a description of an impressive set of Fortran callable subroutines see I. Hirschsohn, etal “Design and Implementation of the DISSPLA Graphics Language”. pp. 31-44 in Douglas Lewin (Ed) Interactive Systems (1975), Online, Uxbridge, England.Google Scholar
12. The hierarchial data structure is a feature of the Integrated Graphics library.Google Scholar
13. MIDAS was used over 100,000 times in the last year alone.Google Scholar
14. L. Borman, W. D. Dominick, R. Hay Jr., P. Kron, and B. Mittman, “Personalized Management and Graphical Display of Data: An Extensible System Approach,” Proceedings of the SIGDA/SIGNOD/SIGGRAPHWorkshop on Data Bases for Interactive Design,” September 1975, pp. 36-44.Google Scholar