
“Visualization of Earth and Space Science Data” by Green
Conference:
- SIGGRAPH 1996
-
More from SIGGRAPH 1996:


Type(s):
Entry Number: 35
Title:
- Visualization of Earth and Space Science Data
Program Title:
- Digital Bayou
Presenter(s):
Collaborator(s):
- Paul Andres
- Peter Blinn
- Kris Capraro
- Jerry Clark
- Robert Deen
- David Freda
- Zareh Gorjian
- Jeff Hall
- Tom Handley
- Frank Hartman
- Danika Jensen
- Pam Woncik
- Bill Lincoln
- Dave Kagels
- Myche Mcauley
- Barbara McGuffie
- Mike Mueller
- Steve Noland
- Vadim Parizher
- Larry Preheim
- Ken Scott
- Shigeru Suzuki
- Charles Thompson
- John Wright
- Tom Thaller
Project Affiliation:
- Jet Propulsion Laboratory
Description:
- The Science Analysis Graphics Environment (SAGE)
A graphical interface used to control processing of imaging and other science data returned by the Pathfinder solar system exploration mission in 1997, providing stereoscopic mission planning tools for supporting rover navigation on the surface of Mars. - VISTASAn interactive tool for query and retrieval of earth- observation data acquired by the TOVS sensor.
- A working prototype of software that will be used to process data returned by the Atmospheric Infra-Red Sounder (AIRS) to be flown as part of NASA’s Mission to Planet Earth.
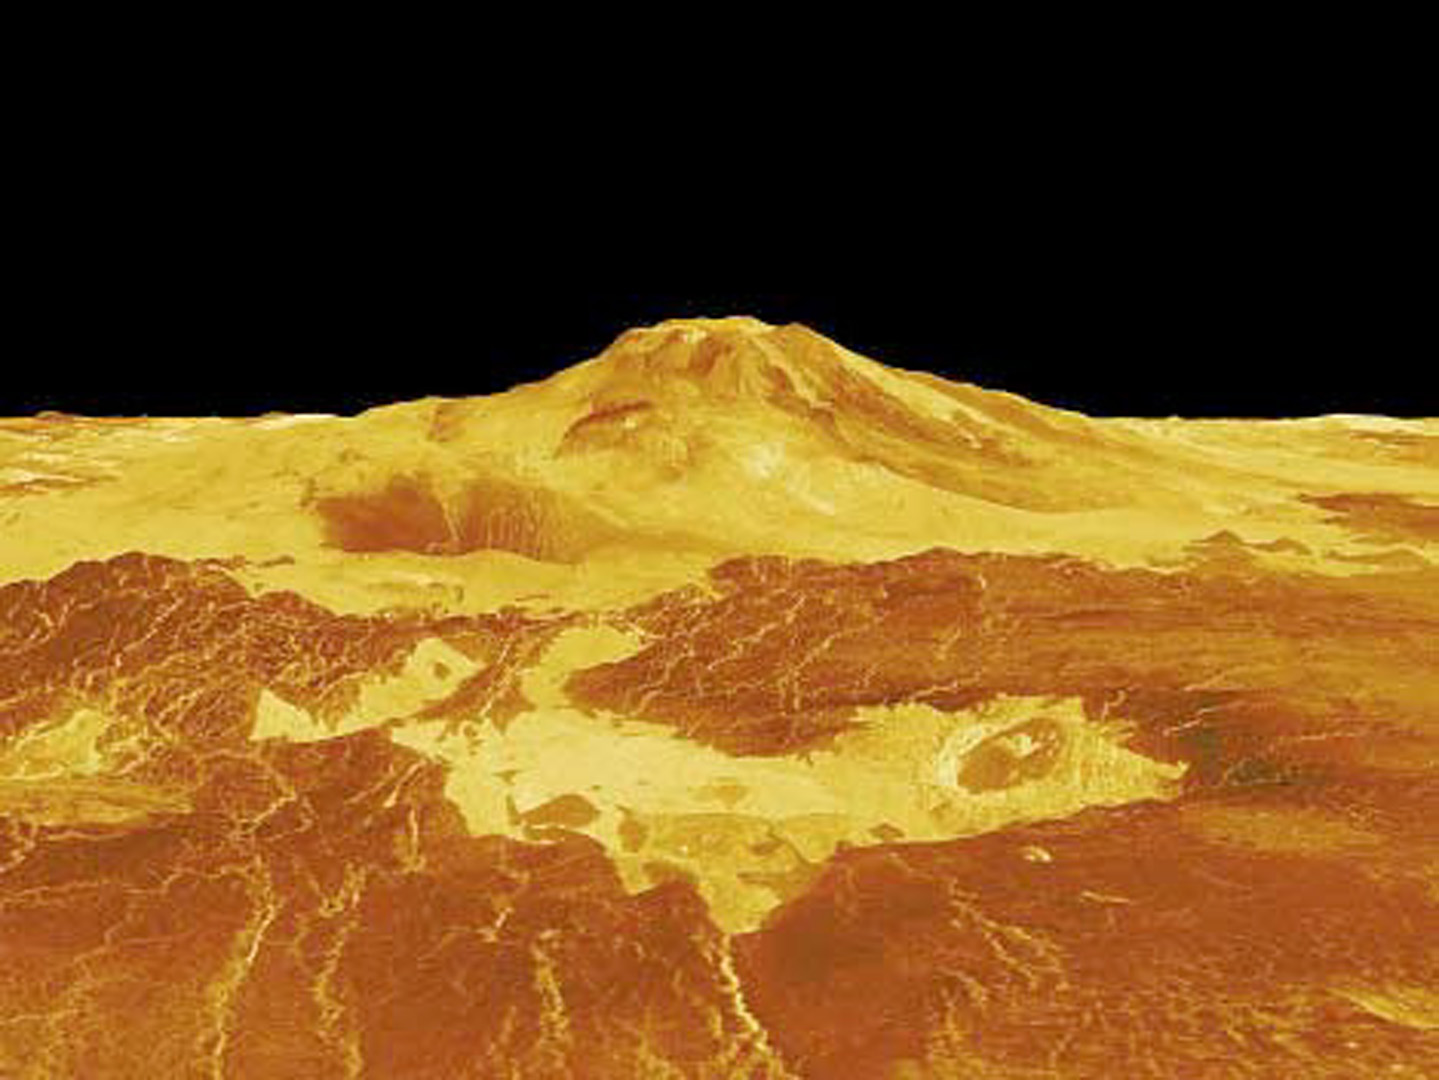
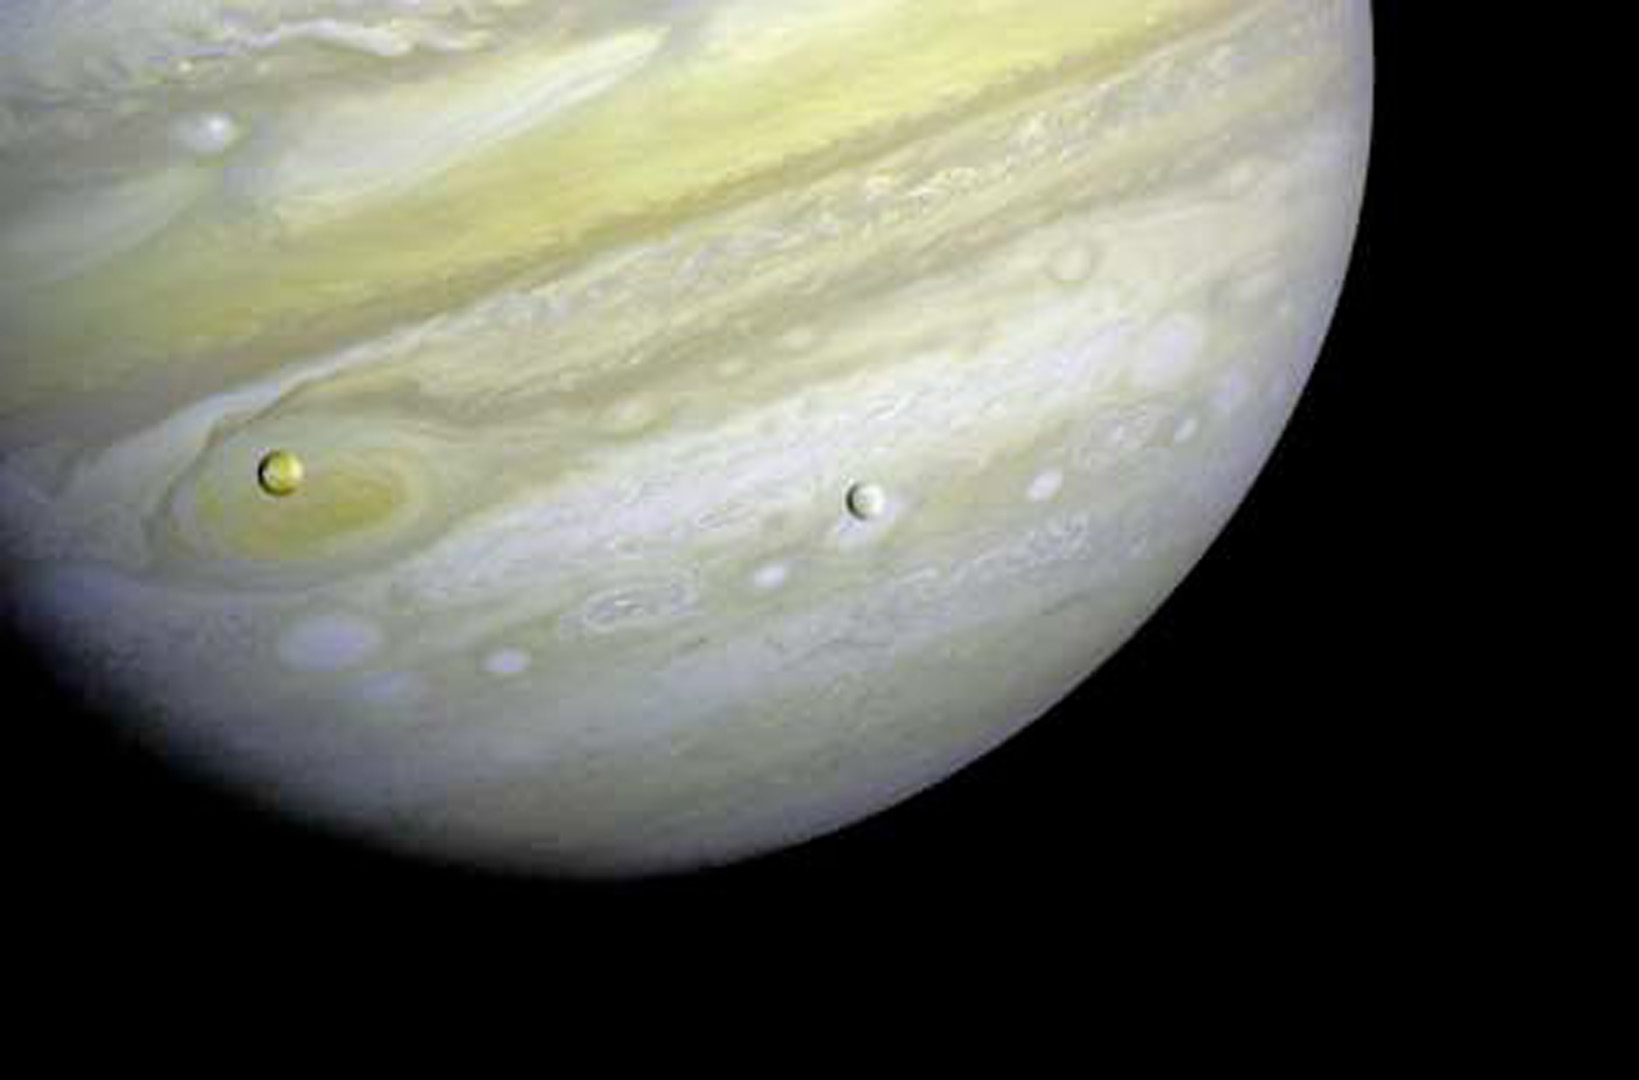
- Animation and “fly-by” systems to explore Mars, Jupiter, and Venus.
- Internet-accessible image database browsers and navigators that provide public access to space mission image archives.
- Other current work focusing on processing of operational data.
Daily demonstrations of several interactive JPL systems for processing and visualization of science data returned by instruments flown on spacecraft in earth orbit and on solar system exploration missions: