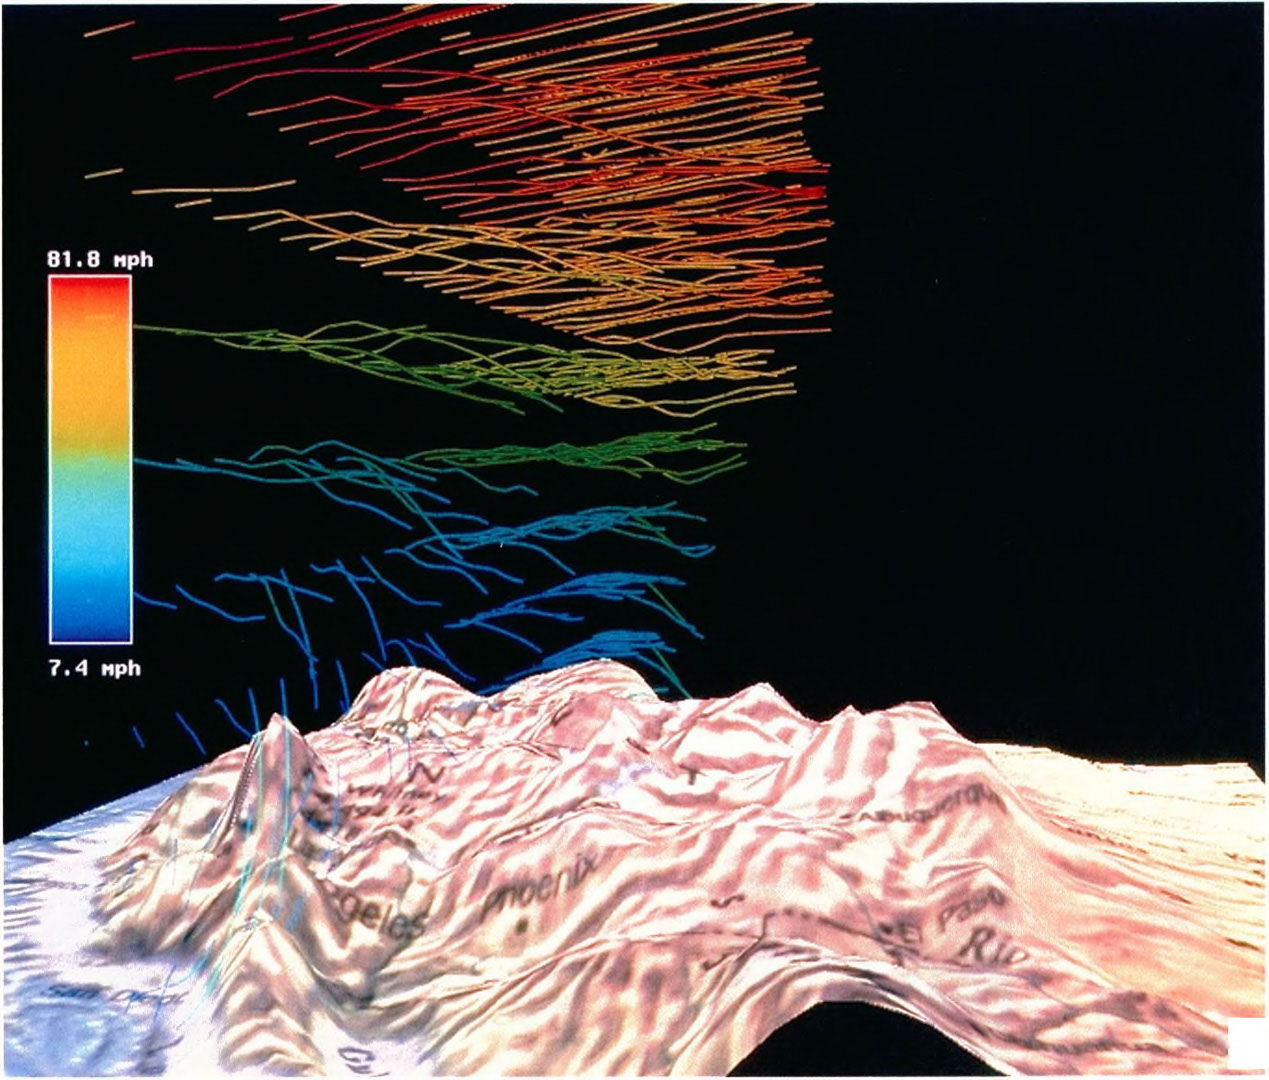
“Visualization of Climate Data Over the Western United States” by Kochevar
Notice: Pod Template PHP code has been deprecated, please use WP Templates instead of embedding PHP. has been deprecated since Pods version 2.3 with no alternative available. in /data/siggraph/websites/history/wp-content/plugins/pods/includes/general.php on line 518
Conference:
- SIGGRAPH 1994
-
More from SIGGRAPH 1994:
Notice: Array to string conversion in /data/siggraph/websites/history/wp-content/plugins/siggraph-archive-plugin/src/next_previous/source.php on line 345

Notice: Array to string conversion in /data/siggraph/websites/history/wp-content/plugins/siggraph-archive-plugin/src/next_previous/source.php on line 345

Type(s):
Title:
- Visualization of Climate Data Over the Western United States
Program Title:
- VROOM
Presenter(s):
Description:
Many climatologists are interested in understanding energy transport in the atmosphere due to wind and precipitation. A thesis currently being investigated is that immersion in a virtual world that models the one in which we live may enable scientists to better understand Earth’s dynamic climate processes. This demonstration represents output from a regional climate model for the western United States. Data from the model are compared with actual measurements to help gauge the validity of the model.


