
“T_Vision” by Grueneis
Notice: Pod Template PHP code has been deprecated, please use WP Templates instead of embedding PHP. has been deprecated since Pods version 2.3 with no alternative available. in /data/siggraph/websites/history/wp-content/plugins/pods/includes/general.php on line 518
Conference:
- SIGGRAPH 1995
-
More from SIGGRAPH 1995:
Notice: Array to string conversion in /data/siggraph/websites/history/wp-content/plugins/siggraph-archive-plugin/src/next_previous/source.php on line 345

Notice: Array to string conversion in /data/siggraph/websites/history/wp-content/plugins/siggraph-archive-plugin/src/next_previous/source.php on line 345


Type(s):
Title:
- T_Vision
Program Title:
- Interactive Communities
Presenter(s):
Collaborator(s):
Project Affiliation:
- ART+COM
Description:
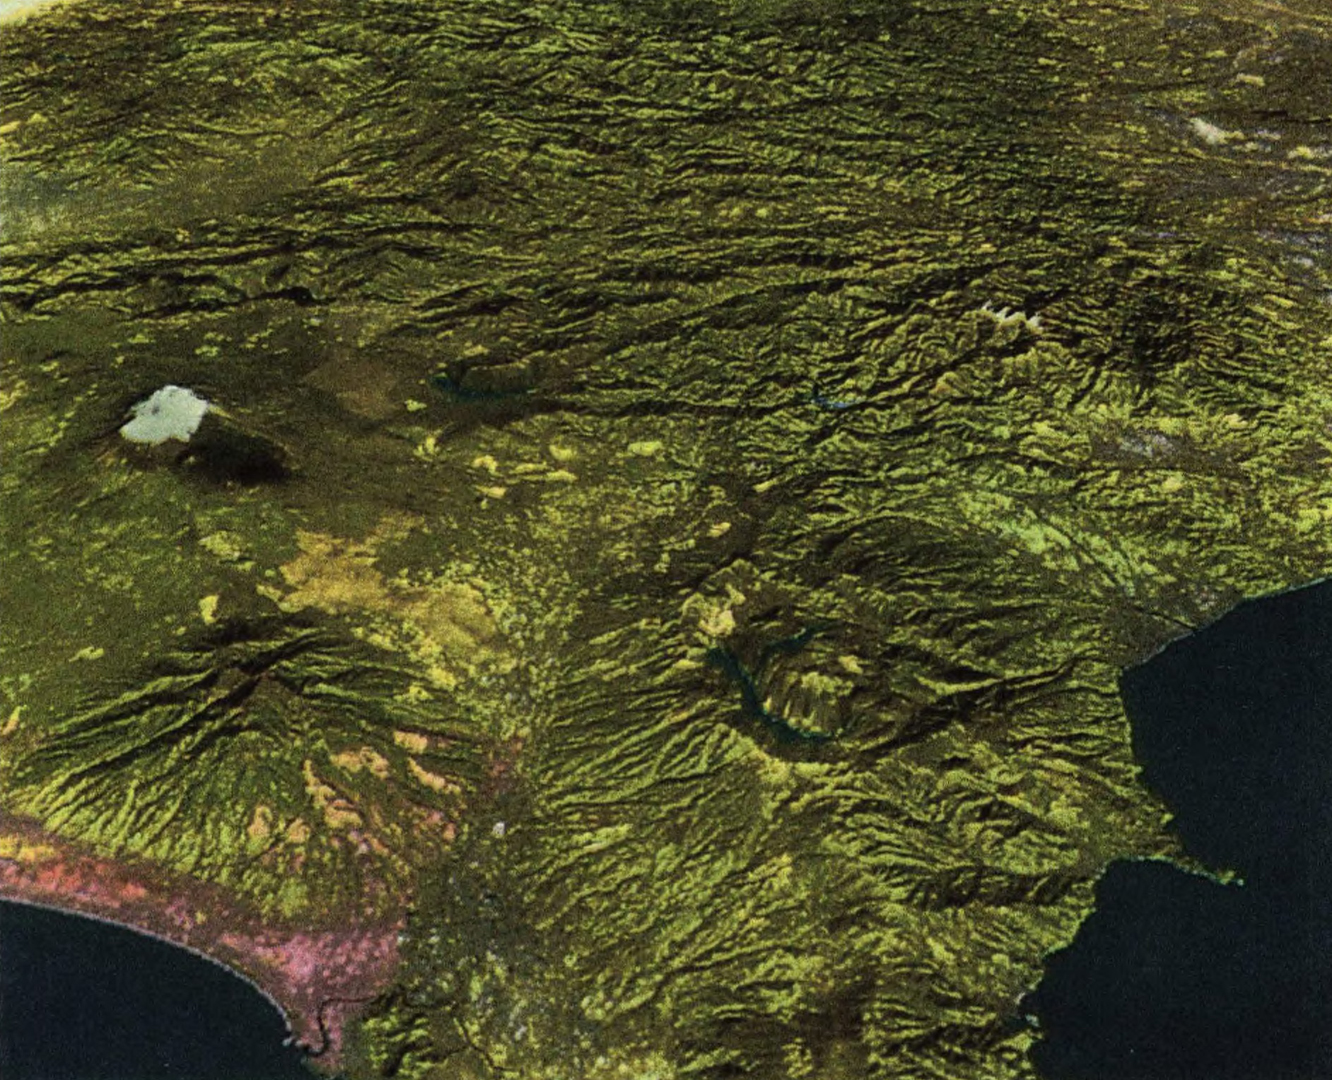
T_Vision is a broad-band application research project. It provides a distributed virtual globe as a multimedia interface to visualize any kind of data related to a geographic region. The virtual globe is modeled from high-resolution spatial data and textured with high-resolution satellite images.
A T_Vision database and realtime rendering system has been developed to handle this huge amount of data. Seamless links between different levels of detail allow continuous zooming from a global view down to recognizable features of only a few centimeters in size. The virtual globe can display many types of data, including biological, sociological, economical, and others.
This project is based on the concept of a transparent and worldwide broad-band, networked topography and surface data bank. Because it is impossible for a single location to store and maintain the huge amount of high-resolution data necessary for such a visualization application, the system automatically establishes an ATM connection to the server that provides the most up-to- date and highest-resolution data required for the current field of view (and visualization layer). These remotely accessed data are integrated unobtrusively into the user’s system on the fly. A special T_Vision user interface based on a large real globe (“earthtracker”) facilitates the user’s navigation around the virtual globe, so the user has full control over which information to view, when, and at which location.
A successful ATM T_Vision test network between Tokyo and Berlin was established in October 1994. A third node will be added this year, in Sunnyvale, California USA.