
“Distributed Scientific Visualization of Ocean Models” by Knesel
Notice: Pod Template PHP code has been deprecated, please use WP Templates instead of embedding PHP. has been deprecated since Pods version 2.3 with no alternative available. in /data/siggraph/websites/history/wp-content/plugins/pods/includes/general.php on line 518
Conference:
- SIGGRAPH 1996
-
More from SIGGRAPH 1996:
Notice: Array to string conversion in /data/siggraph/websites/history/wp-content/plugins/siggraph-archive-plugin/src/next_previous/source.php on line 345

Notice: Array to string conversion in /data/siggraph/websites/history/wp-content/plugins/siggraph-archive-plugin/src/next_previous/source.php on line 345


Type(s):
Entry Number: 07
Title:
- Distributed Scientific Visualization of Ocean Models
Program Title:
- Digital Bayou
Presenter(s):
Collaborator(s):
- Dan Williams
- Steven Lingsch
- Houston Costolo III
- Peter Gruzinskas
- Cass Everitt
- Jack Breyer
- Michael Adams
- Gary Herring
- Daniel N. Fox
- Peter Flynn
- Robert Moorhead
- Kelly Gaither
- Scott Nations
Project Affiliation:
- Naval Oceanographic Office, Naval Research Laboratory, and Mississippi State University
Description:
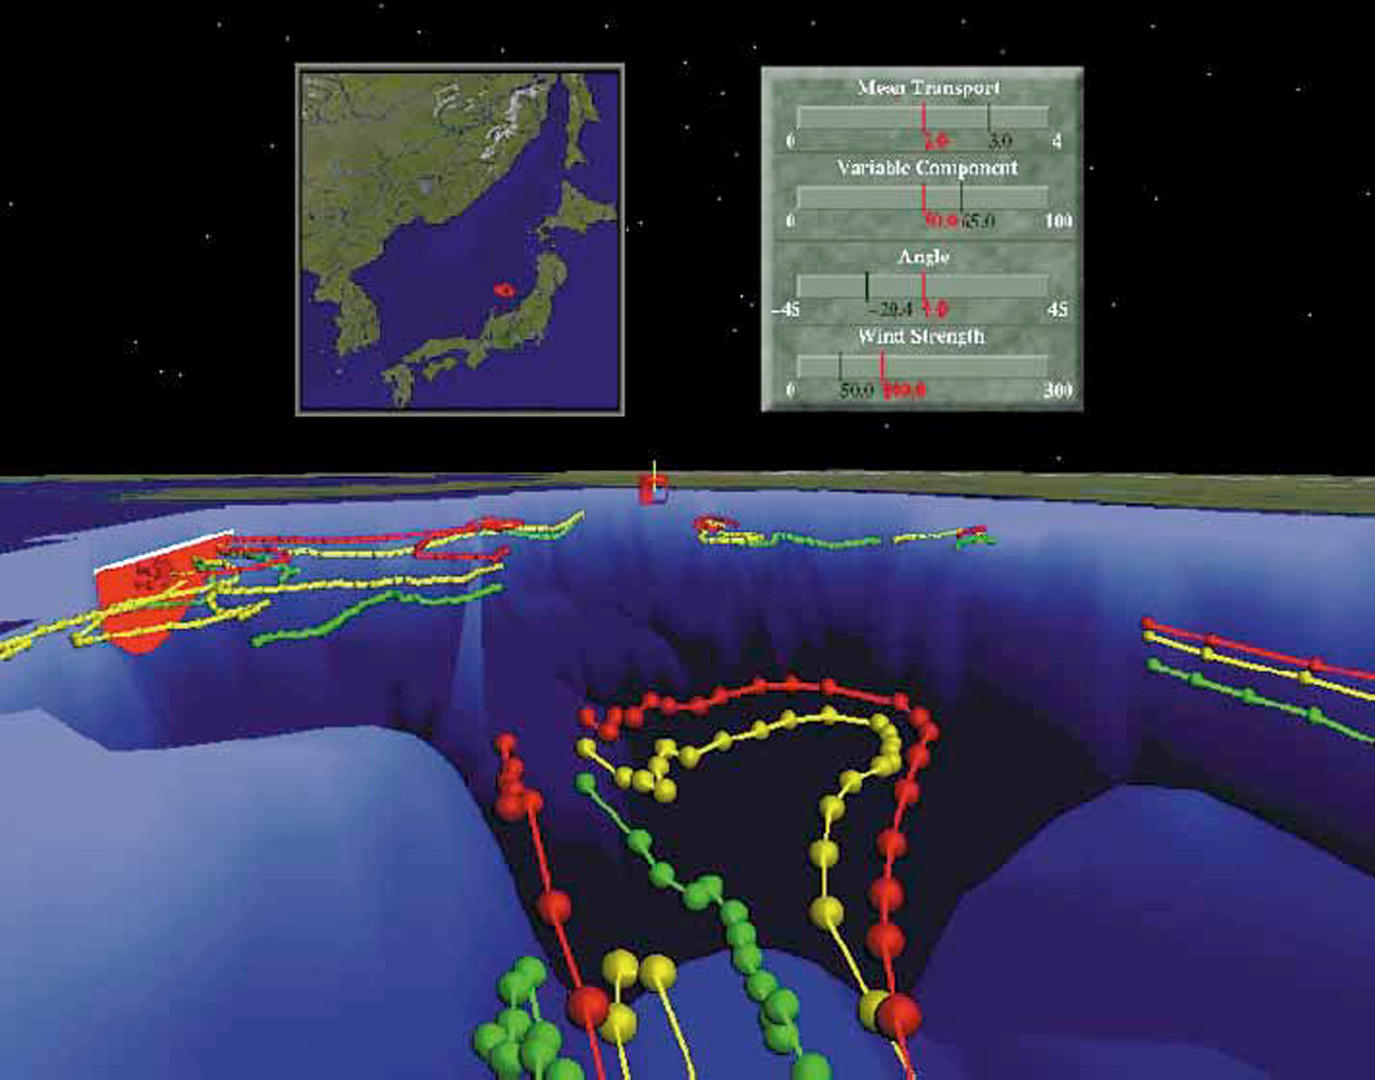
This prototype simulation enables operational or exercise planners to test various scenar- ios prior to initiation of the operation. The application is highly adaptable to training operations via interactive “fly- throughs” of ocean simulations, including interactive control of the ocean model itself.
Participants use a virtual reality boom driven by a Silicon Graphics RE 3 engine. Imaging is also displayed on two Silicon Graphics MAX IMPACT work- stations. In addition, a continuous animation describes the evolution of the science of oceanography. In the virtual reality displays, 3-D images of the ocean include undulating surfaces, small tracer balls flowing through space, tub-like surfaces representing currents and eddies, and graphics from raytraced surfaces. The interactive circulation model is user-controlled via keyboard and certain parameters that affect the model’s solutions, such as current strength and wind force, are controllable.
These techniques for incor- porating high-resolution bathymetry and acoustic back-scatter imagery into a simulated ocean floor visualization will eventually be coupled with oceanographic models to produce volumetric/parameter- selectable visualizations of the water column, and the results will be exported into an interactive bathymetric/topographic flythrough/flyover