“4th graders learn about the Global Positioning System (GPS) and Digital Elevation Maps (DEM)” by Scrivener and Bigger
Notice: Pod Template PHP code has been deprecated, please use WP Templates instead of embedding PHP. has been deprecated since Pods version 2.3 with no alternative available. in /data/siggraph/websites/history/wp-content/plugins/pods/includes/general.php on line 518
Conference:
- SIGGRAPH 2003
-
More from SIGGRAPH 2003:
Notice: Array to string conversion in /data/siggraph/websites/history/wp-content/plugins/siggraph-archive-plugin/src/next_previous/source.php on line 345

Notice: Array to string conversion in /data/siggraph/websites/history/wp-content/plugins/siggraph-archive-plugin/src/next_previous/source.php on line 345


Type(s):
Title:
- 4th graders learn about the Global Positioning System (GPS) and Digital Elevation Maps (DEM)
Program Title:
- sigKIDS Demonstrations
Organizer(s)/Presenter(s):
Description:
Two San Diego county residents — Alan Scrivener of the San Diego Chapter of the Association for Computing Machinery’s Special Interest Group on Graphics ( ACM SIGGRAPH), and Mollie Bigger of the Air & Waste Management Association (A&WMA;) — decided to do a community outreach project that would involve school children in San Diego County, water quality awareness, and 3d interactive graphics, timed with the arrival of the 2003 conferences of each of these organizations in San Diego: the A&WMA; conference in June and the SIGGRAPH conference and parallel SIGKIDS event in July.
Principal Ms. Bowen and teacher Ms. Glanz at the Rio Seco School in Santee agreed to let us work with a fourth grade class which was studying geography, and learning about latitude, longitude, elevation and maps.
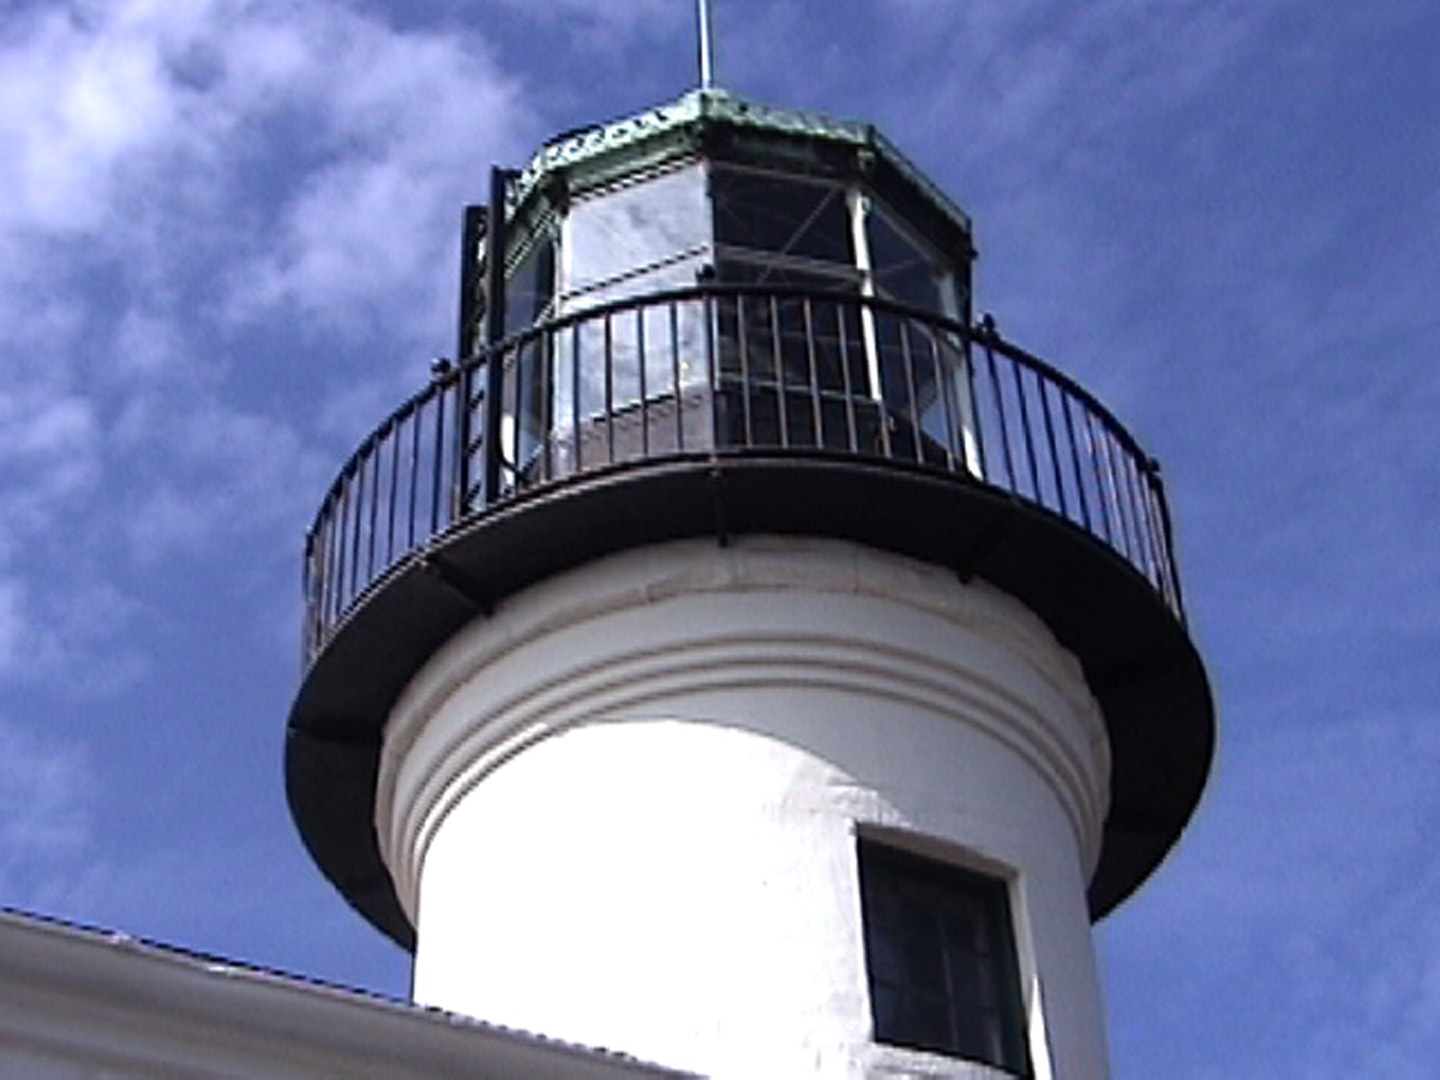
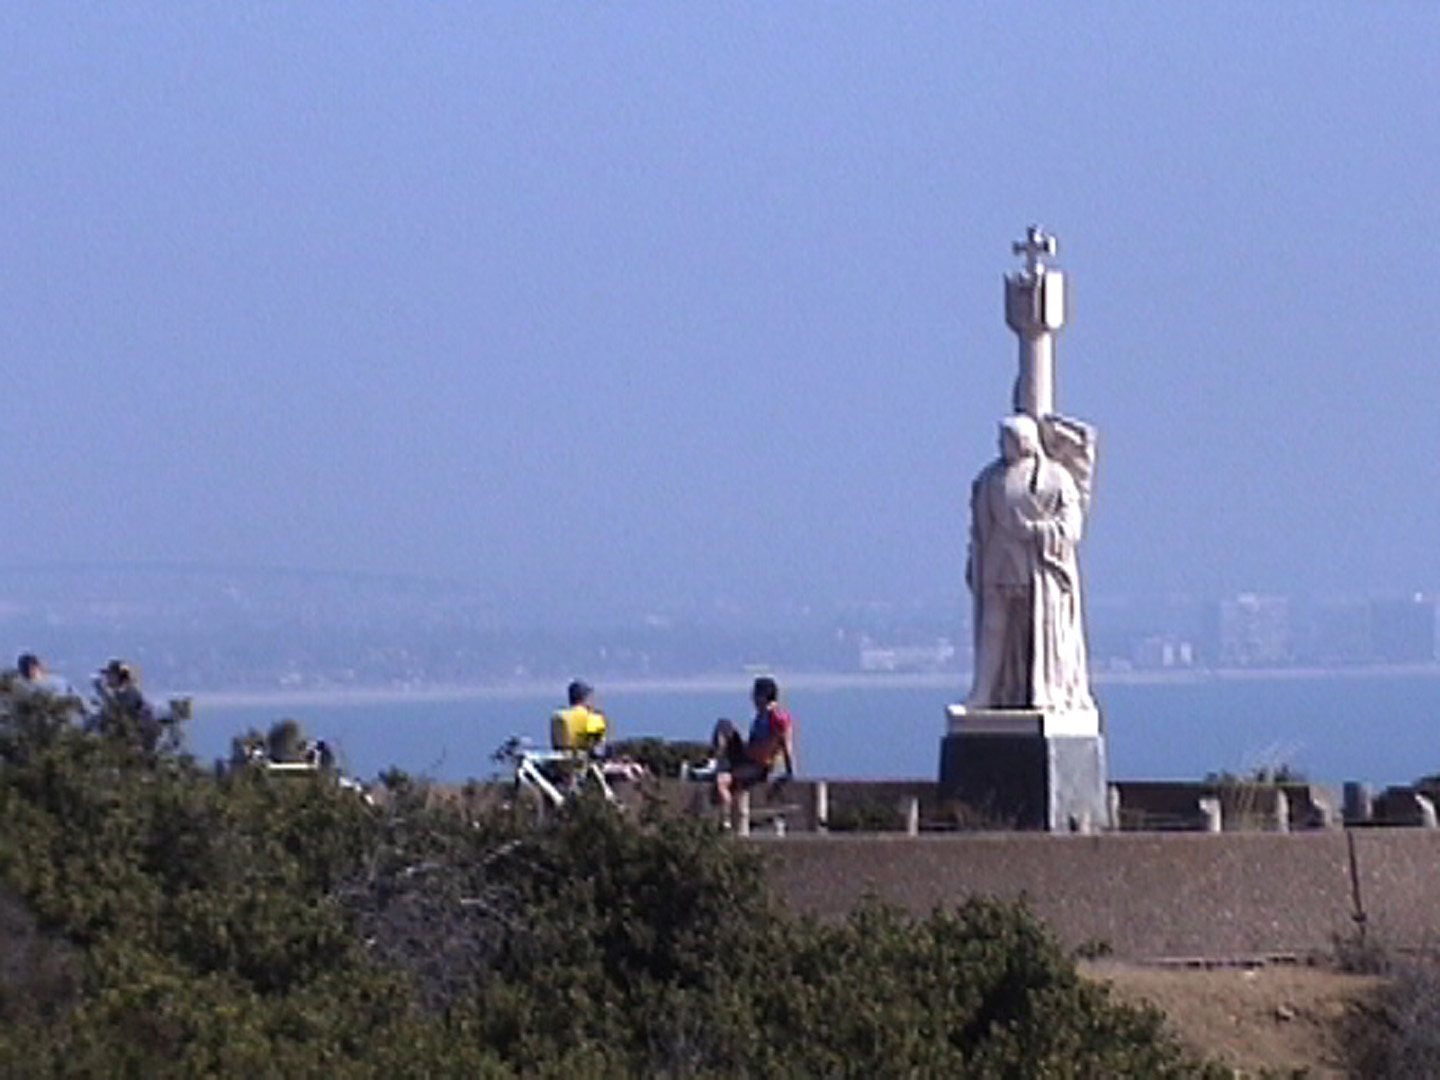
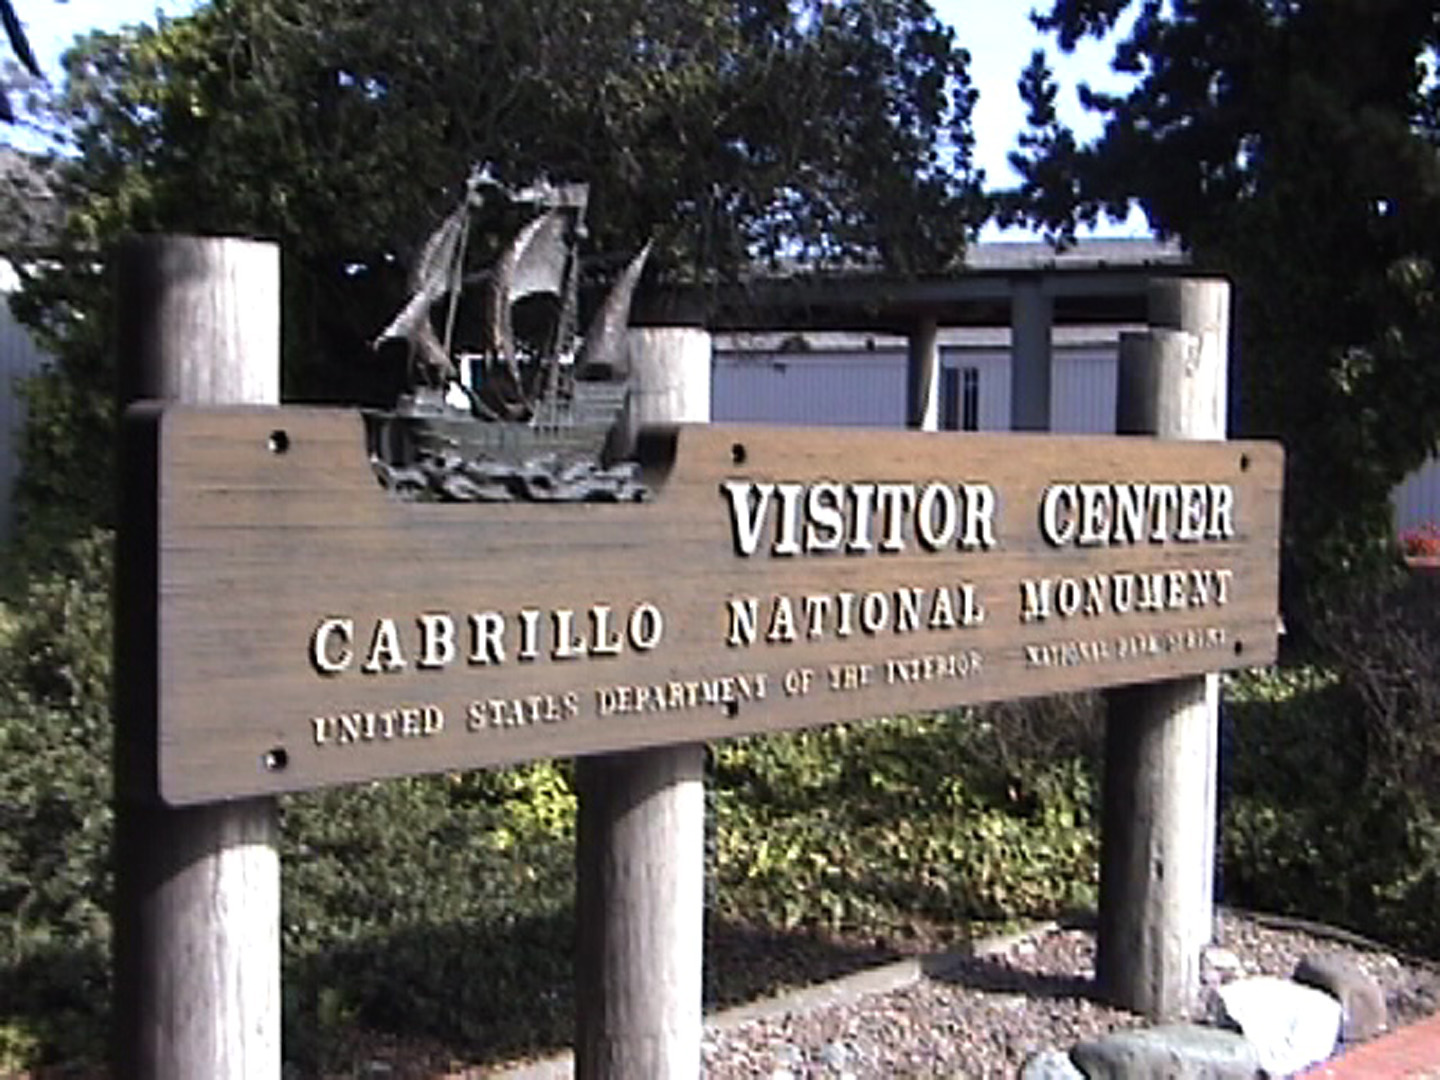
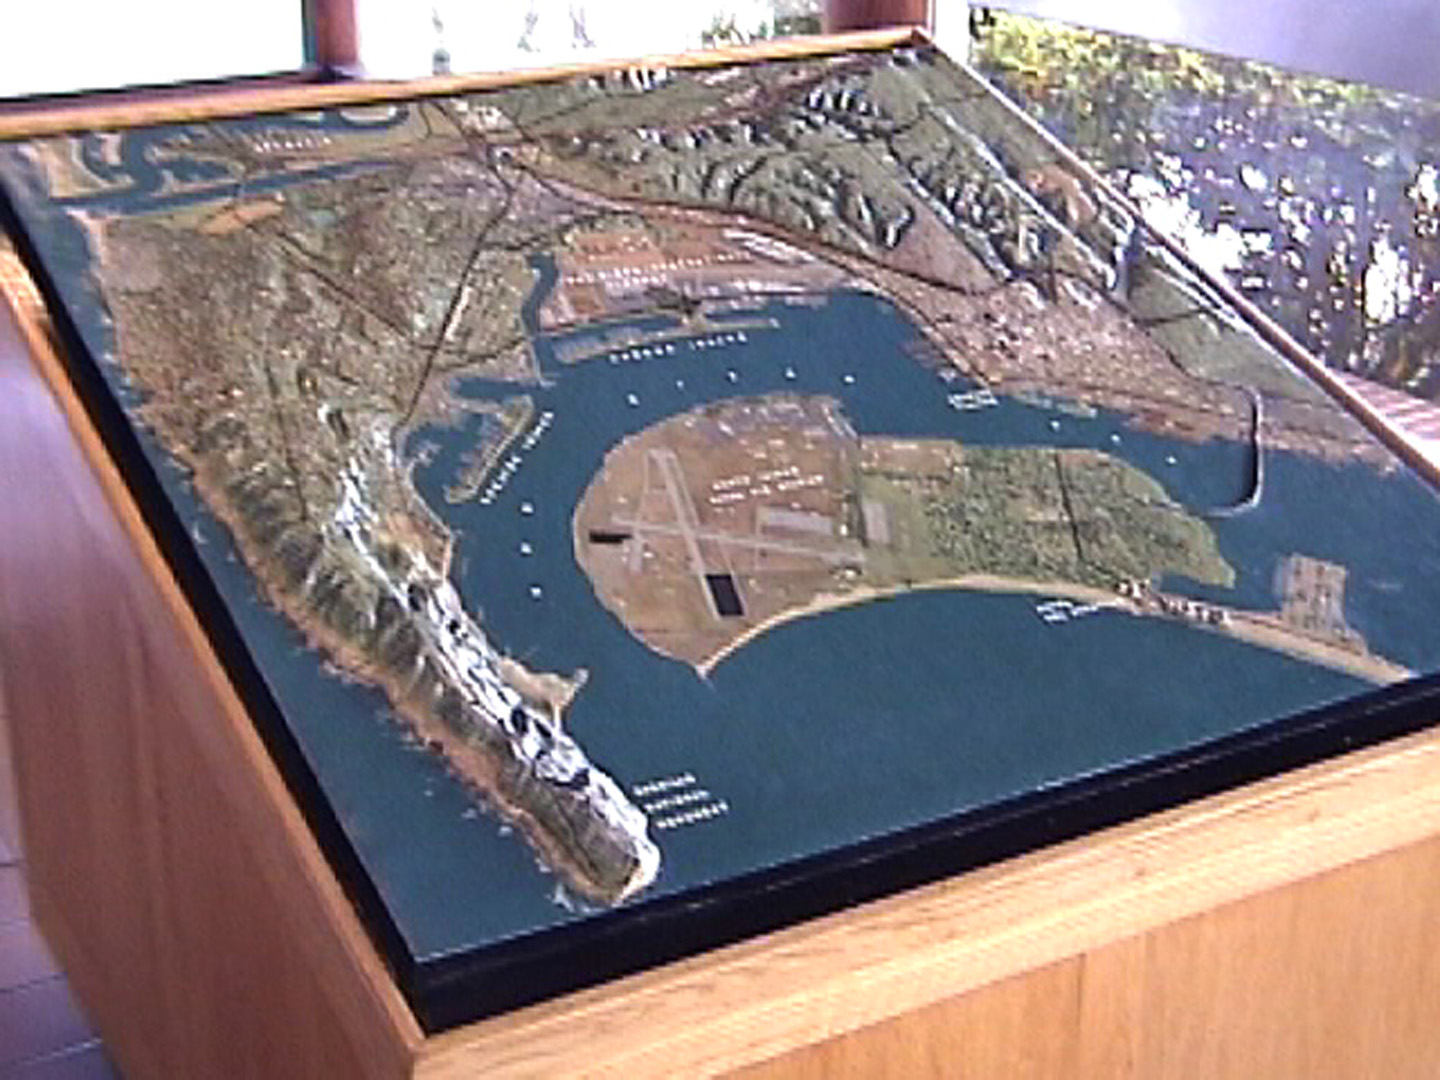
The class had a field trip scheduled to Cabrillo National Monument and so we decided to use this location for our project.
The monument is located on Point Loma, a very prominent geographical feature of San Diego’s coast, which helps form San Diego Bay and protect the harbor; it is also has a number of sensitive ecological habitats.
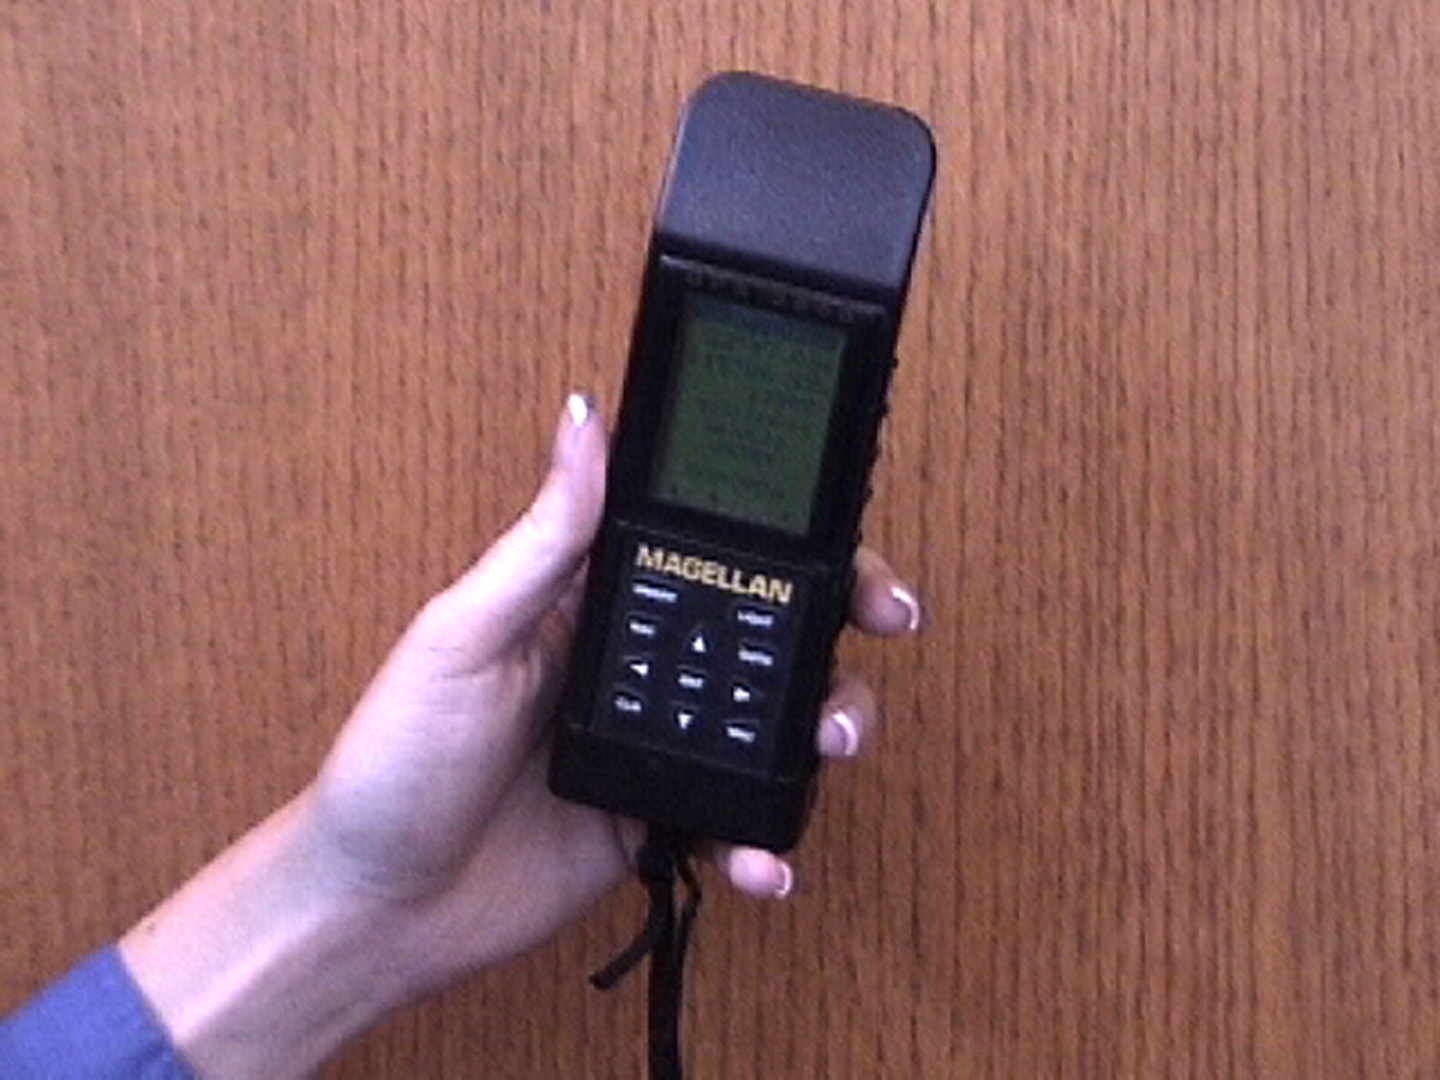
An emailed request for GPS receivers we could borrow for a day, sent to the San Diego SIGGRAPH membership, yielded four workable units.
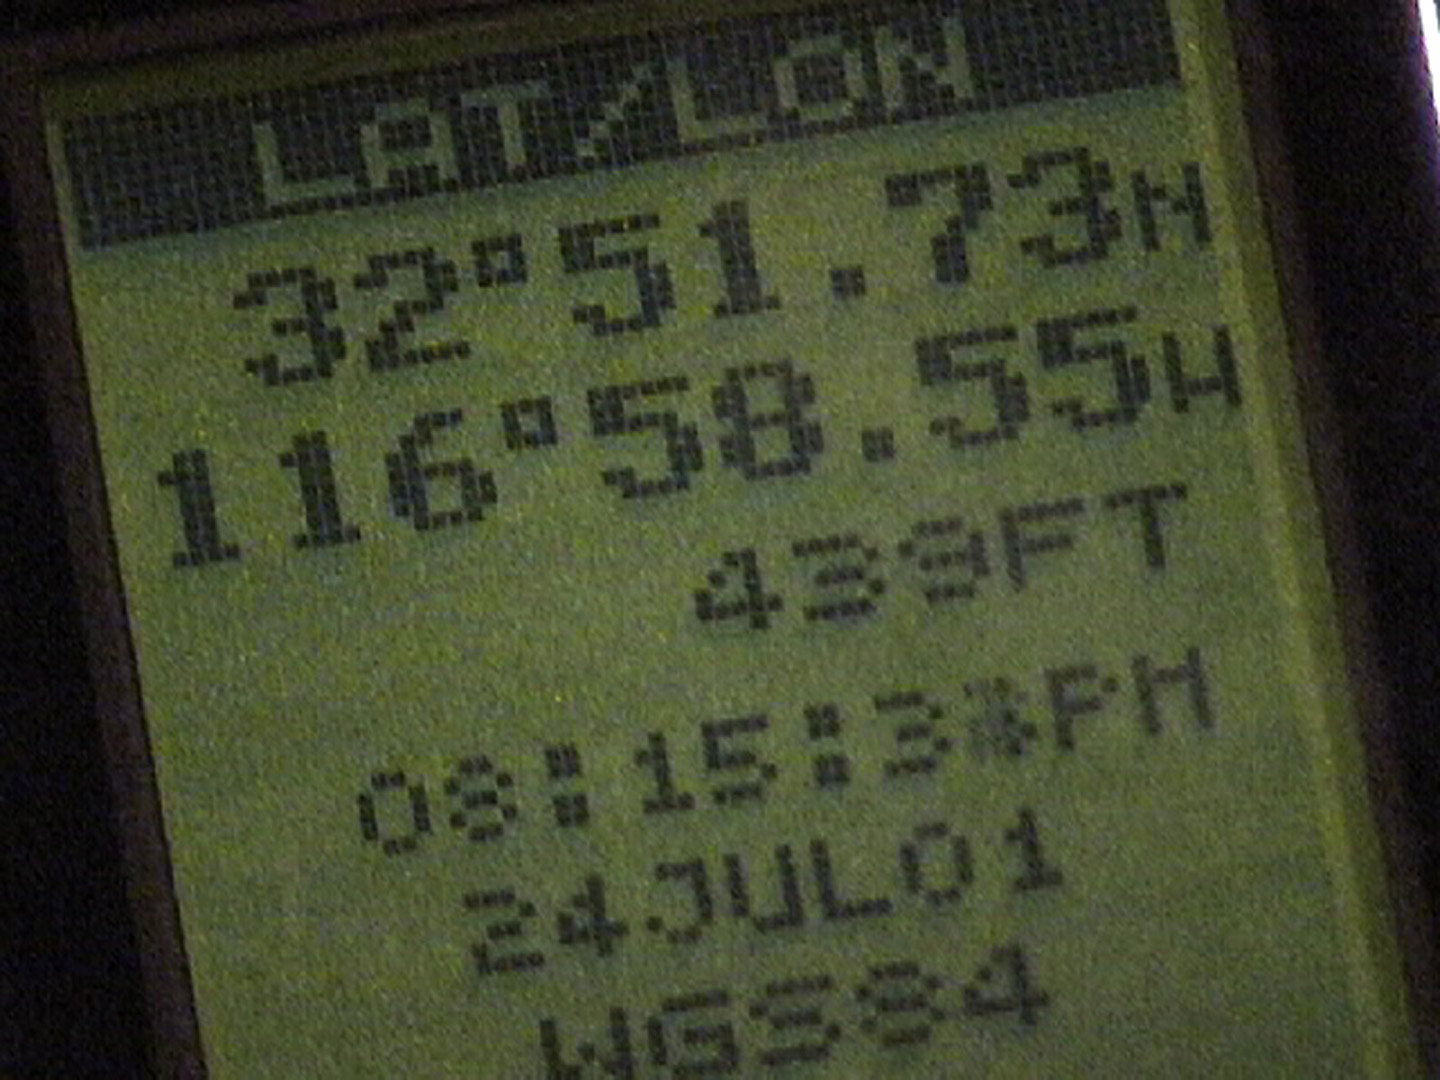
We calibrated the receivers and made sure each one was set to display the current position: latitude, longitude, and altitude (elevation) automatically.
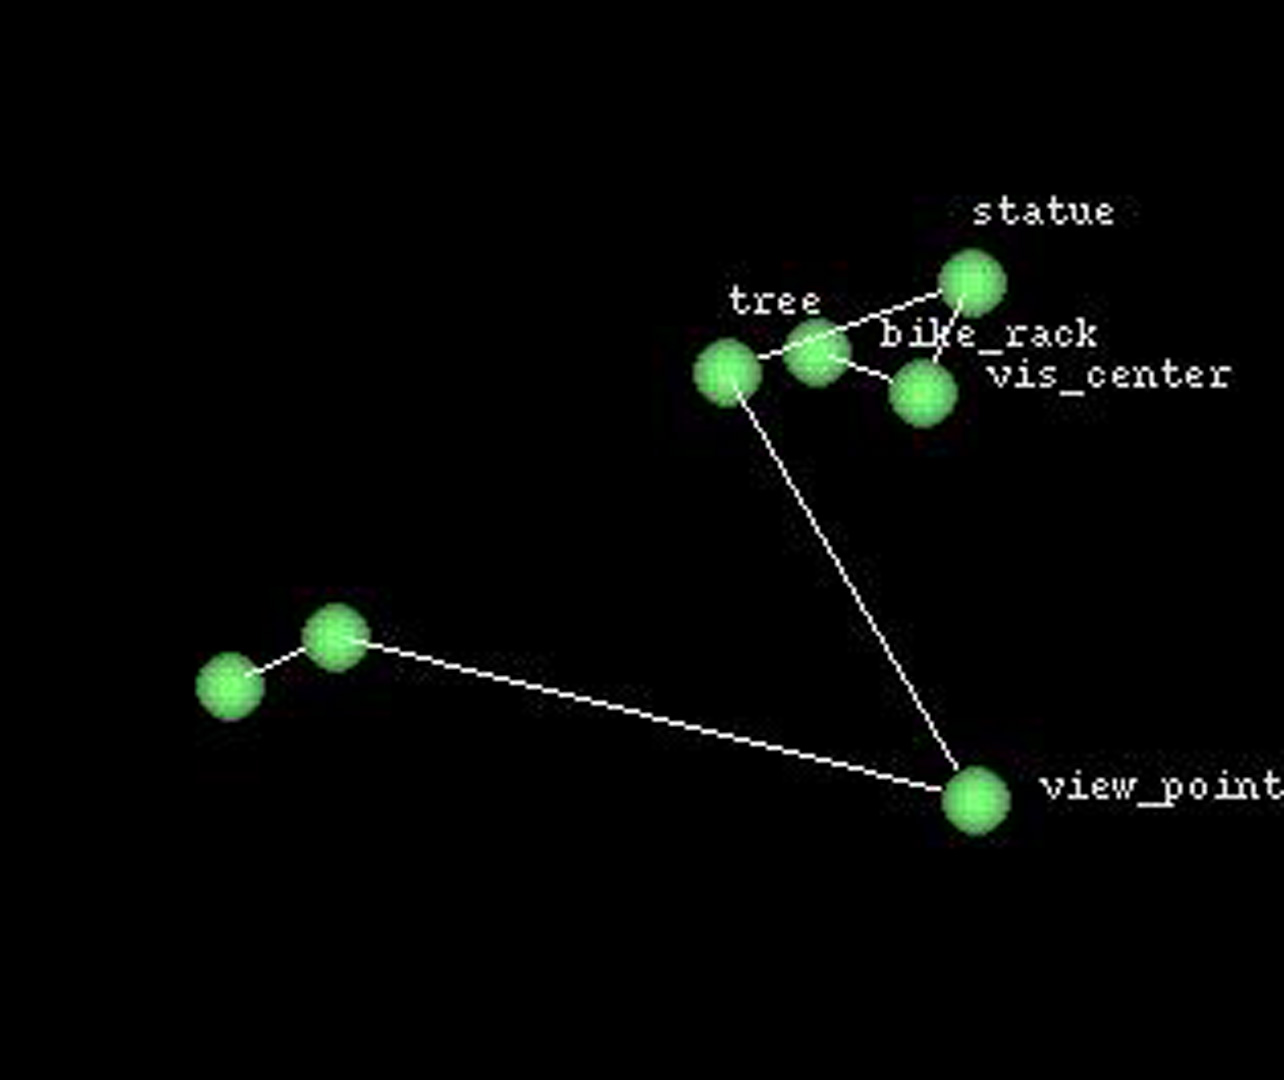
At the field trip we distributed the GPS receivers to four groups of kids, each with an adult chaperone. Each group wandered around the grounds of the monument, measuring and recording position data. A typical list looked like this:
bike rack by flag pole
N 32.67400 deg
W 117.23936 deg
374 feet

front visitor's center
N 32.67477 deg
W 117.23922 deg
359 feet
…and so on.
We encouraged the students to record data at positions with different elevations, and the Cabrillo monument grounds offered a hilly landscape in which to do this.
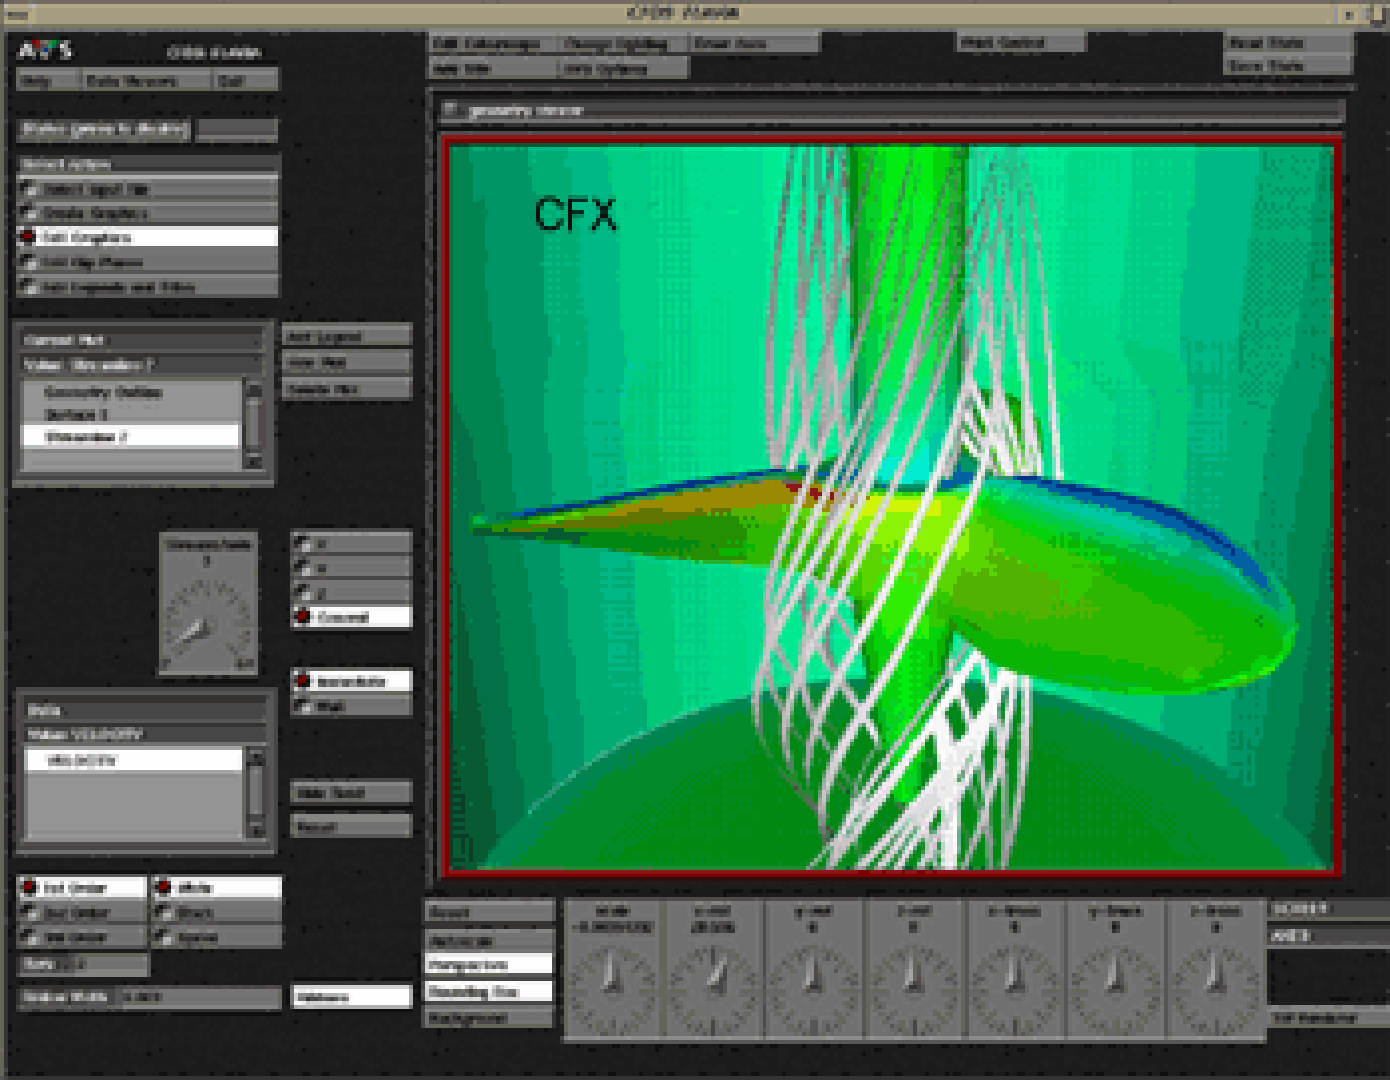
After we collected the data we keyed it in to a computer and used the AVS5 software package from Advanced Visual Systems (AVS) to perform some visualization experiments.
When we were happy with the results we took a computer and projector to the Rio Seco School and showed the real-time interactive 3D graphics to the fourth graders.
First we plotted some of the data collected by the students. Each point in space became a colored sphere, and the order in which data was collected was indicated by connecting line segments. When we had the location name we added a label.
These plots were three-D objects which we could rotate and move around in space in the graphics display, or alternately we could change our view point. Looking top down showed a map-like view, while looking edge-on show an elevation profile.
We explained that not long ago surveyors starting at sea level had to work overland, sometimes for months, to get elevation measurements; and often the results weren’t very accurate. Now, anyone with a GPS receiver can get accurate elevation data anywhere in the world where there is a clear view of the sky, for the receiver to find the satellites.
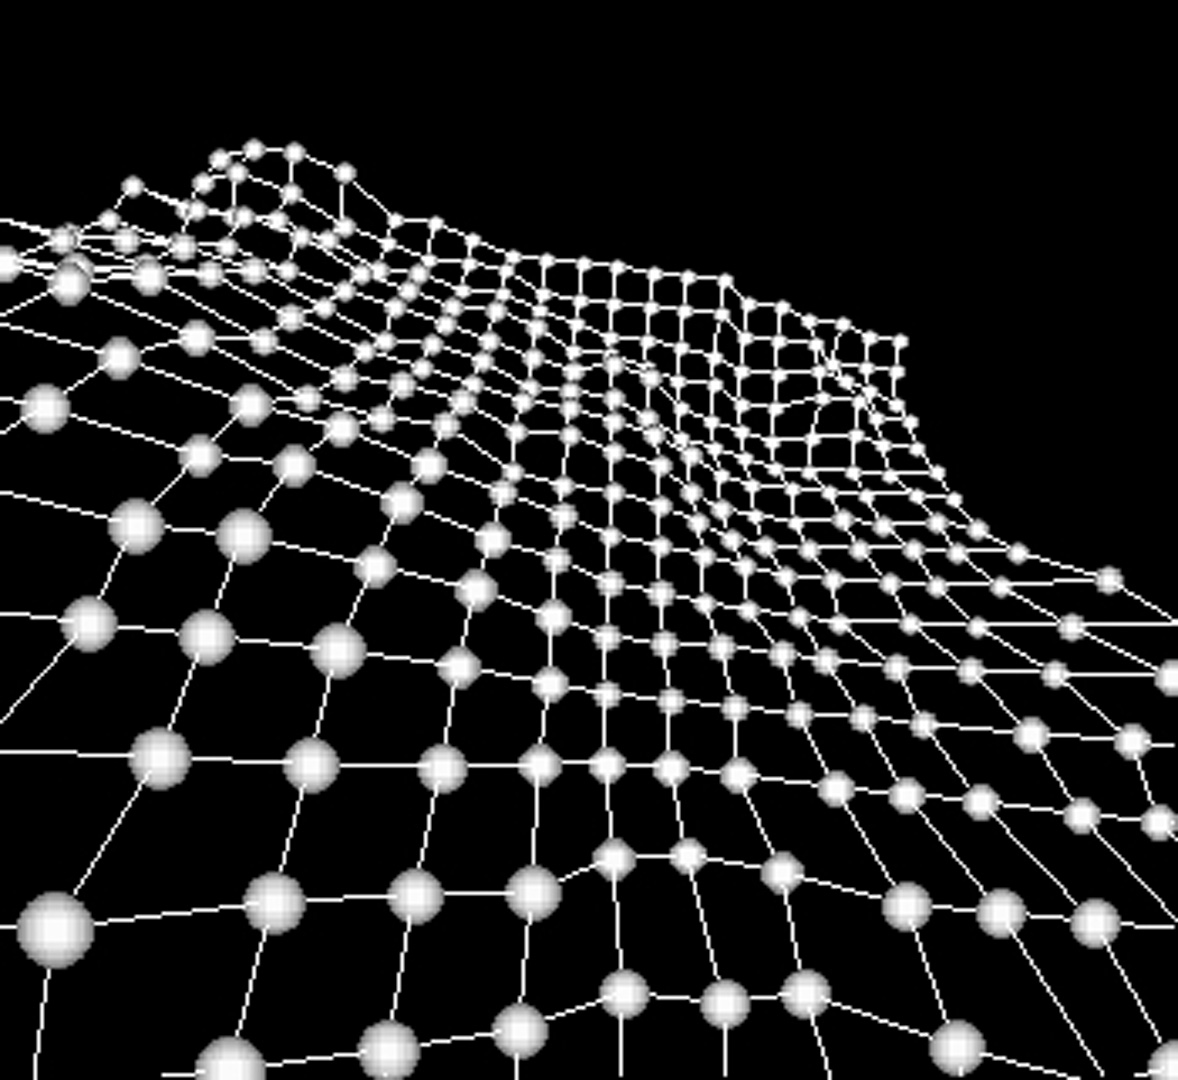
But there is an even easier way to acquire this data now. Satellites and spacecraft such as the space shuttle can use radar to measure elevation in a grid moving over the earth, and the results can be assembled into a Digital Elevation Map (DEM), which is just a list of numbers like this:
 0    0    0    0    0    0
 0    0    0    0    0    1
 7    9    9    9    9    9
13   13   13   15   15   15
40   40   41   41   41   41
23   18   18   18   15   15
 1    1    1    0    0    0
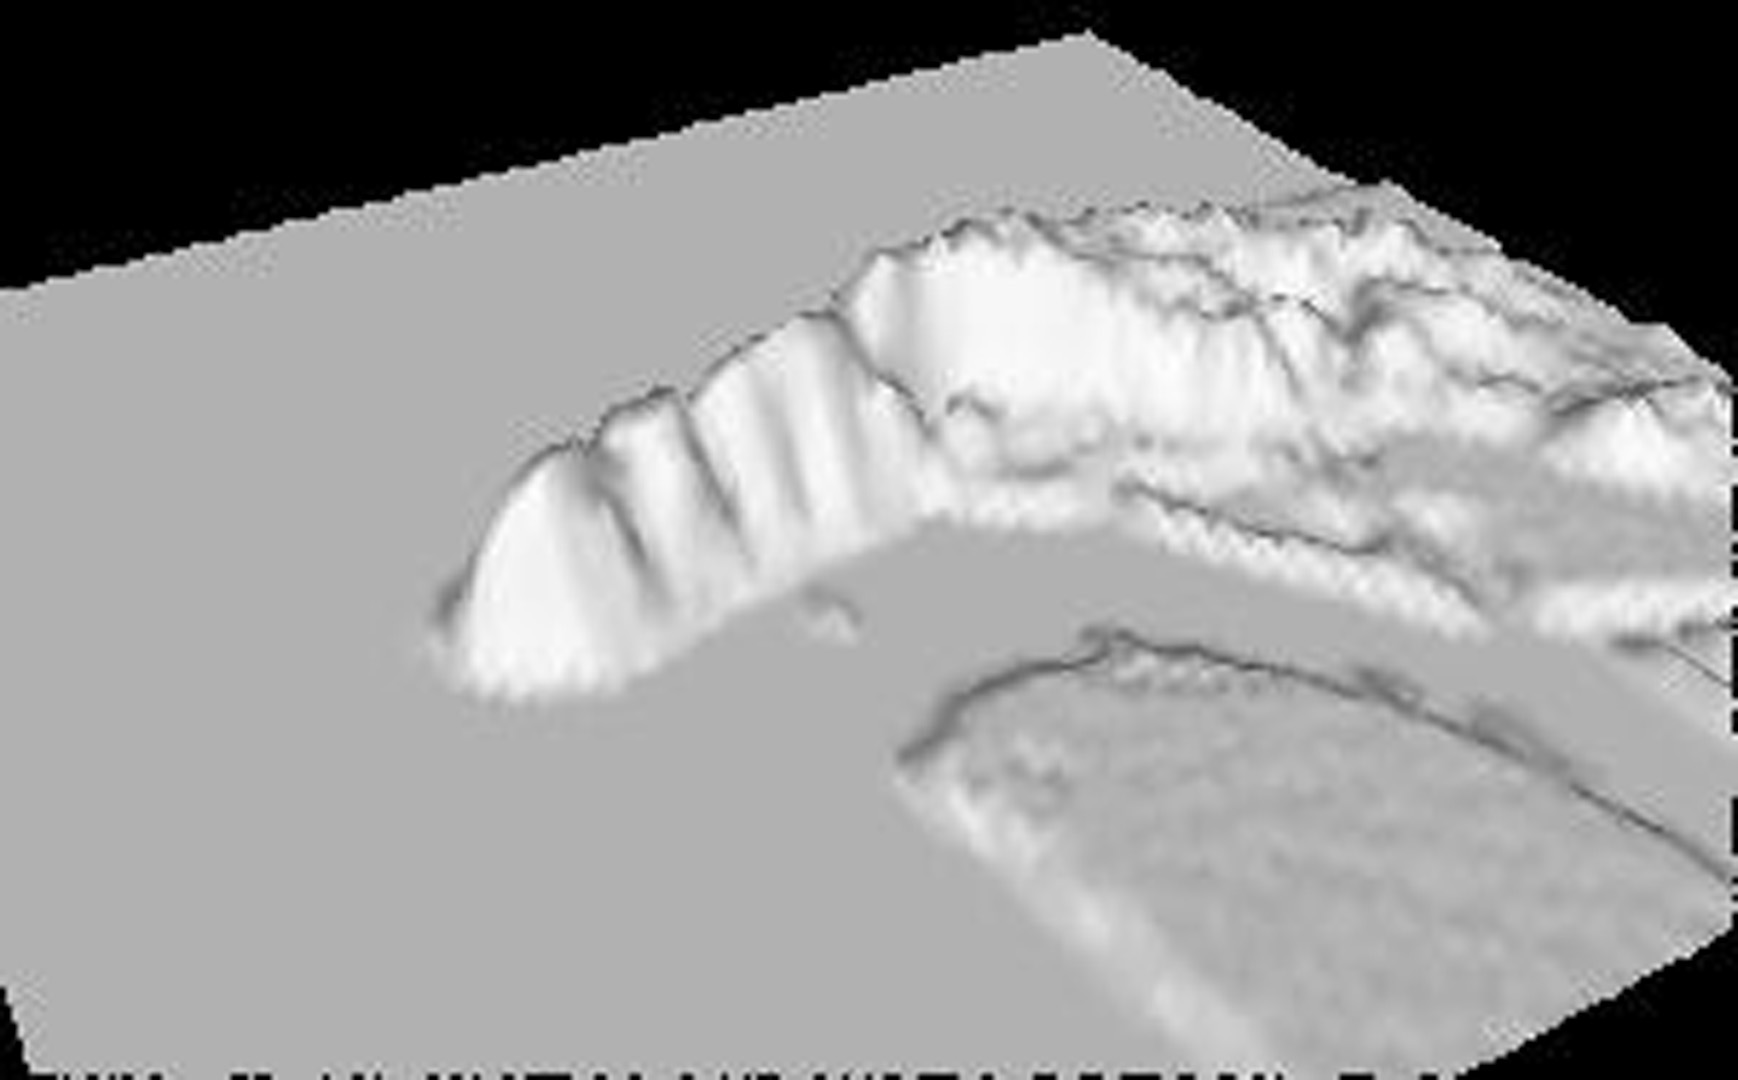
…and so on. Using a DEM, we can create and display a mesh of data.
With a large enough set of data, a realistic looking mesh shaped like the landform can be displayed. Again this three-D display allowed us to rotate and position our view.
We explained that this kind of data display can be used in flight simulators, in military mission planning, and by geologists studying how the land is formed.
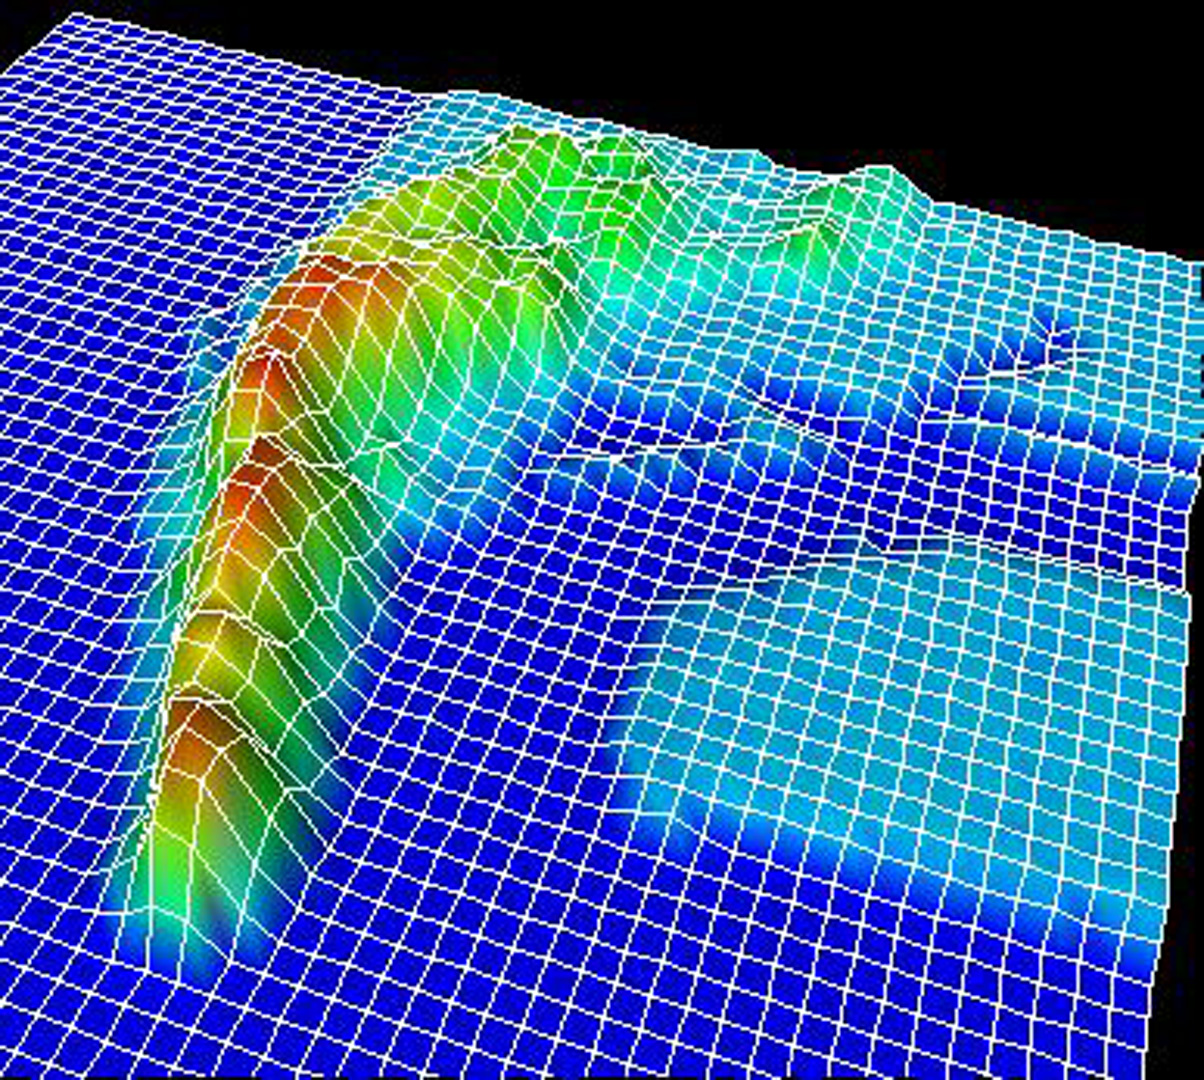
We can exaggerate the appearance of the elevation data by adding grid lines and coloring by elevation. We explained that this kind of 3D interactive graphics is also used in movie special effects and in computer games.
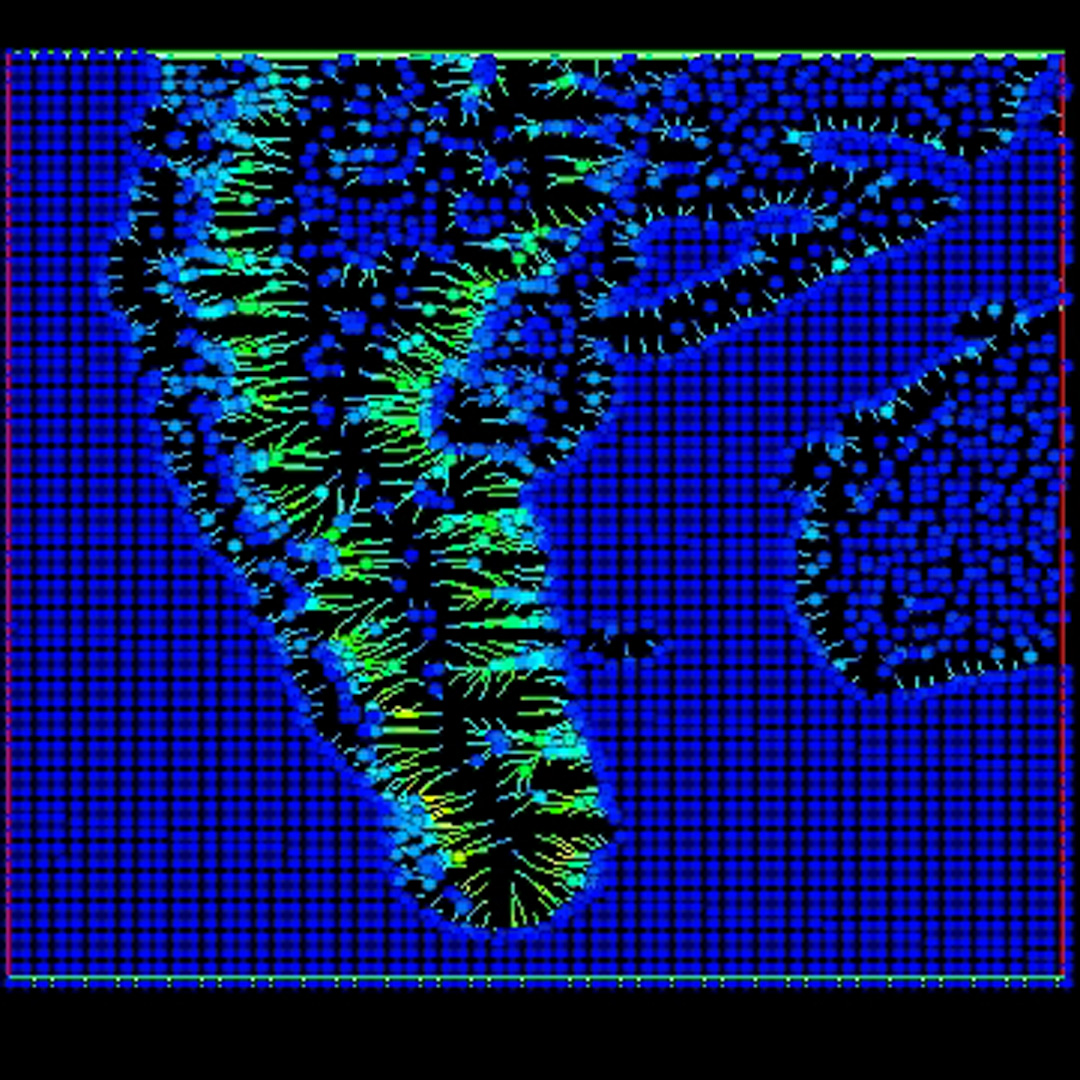
Then we explained that we could analyze data using math and come up with more information to display. By comparing each elevation with its four neighbors we can calculate the direction and steepness of slope at every point. This creates a flow fieldrecording the direction of “downhill” at each point. Into this flow field we can release colored particles, which will flow in the downhill direction like drops of water. Slow drops are blue and faster ones are green. This analysis shows the shape of the watershed. We explained that civil engineers can use this type of data for flood control projects, and environmental scientists can use it to trace the potential sources of pollutants.
Additional Images: