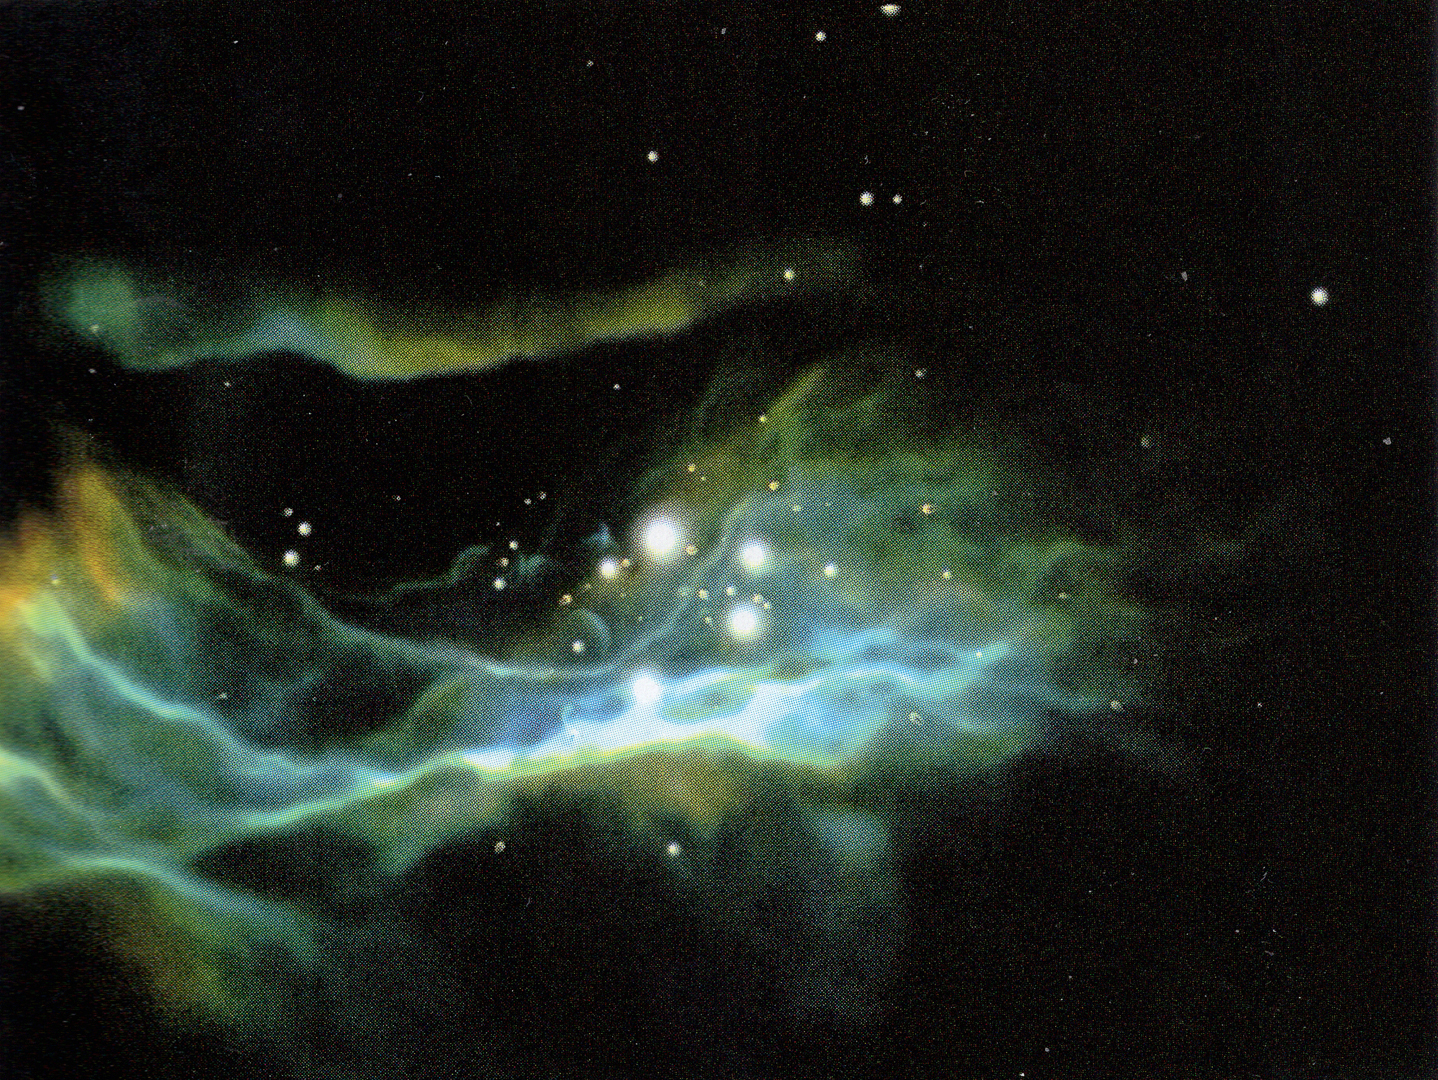
“Volume Visualization of the Orion Nebula” by Jon Genetti
Conference:
- SIGGRAPH 2000 More animation videos from SIGGRAPH 2000:


SIGGRAPH Video Review:
Track:
- 15
Title:
- Volume Visualization of the Orion Nebula
Director(s):
Company / Institution / Agency:
- San Diego Supercomputer Center
Description:
In this visualization, viewers are transported 1,500 light years to the heart of the Orion Nebula. The nebula is derived from a 3D polygonal model based on radio and visible light observations from the Hubble Space Telescope and ground-based observations. A custom toolkit converts this polygonal model to 3D volume data with accurate and controllable nebulosity rendition of the various depicted forms. Eighty-four additional volumes were modeled and placed into the scene with 883 stars, using Gaussian footprints for star brightness. The animation was created using custom volume-rendering software that renders multiple, multi-resolution volumes using perspective viewing transformations.
Additional Contributors:
Technical Contributors: Carter Emmart, Erik Wesselak, American Museum of Natural History, Jon D. Genetti, David R. Nadeau, San Diego Supercomputer Center
Contributors: Dennis Davidson, American Museum of Natural History, Steve Napear, Bernard Pailthorpe, San Diego Supercomputer Center


