“Sentinels of the Heliosphere” by USRA – NASA/Goddard Space Flight Center
Notice: Pod Template PHP code has been deprecated, please use WP Templates instead of embedding PHP. has been deprecated since Pods version 2.3 with no alternative available. in /data/siggraph/websites/history/wp-content/plugins/pods/includes/general.php on line 518
Conference:
- SIGGRAPH 2009 More animation videos from SIGGRAPH 2009:
Notice: Array to string conversion in /data/siggraph/websites/history/wp-content/plugins/siggraph-archive-plugin/src/next_previous/source.php on line 345

Notice: Array to string conversion in /data/siggraph/websites/history/wp-content/plugins/siggraph-archive-plugin/src/next_previous/source.php on line 345

SIGGRAPH Video Review:
Track:
- 21
Title:
- Sentinels of the Heliosphere
Director(s):
Company / Institution / Agency:
- USRA – NASA/Goddard Space Flight Center
Description:
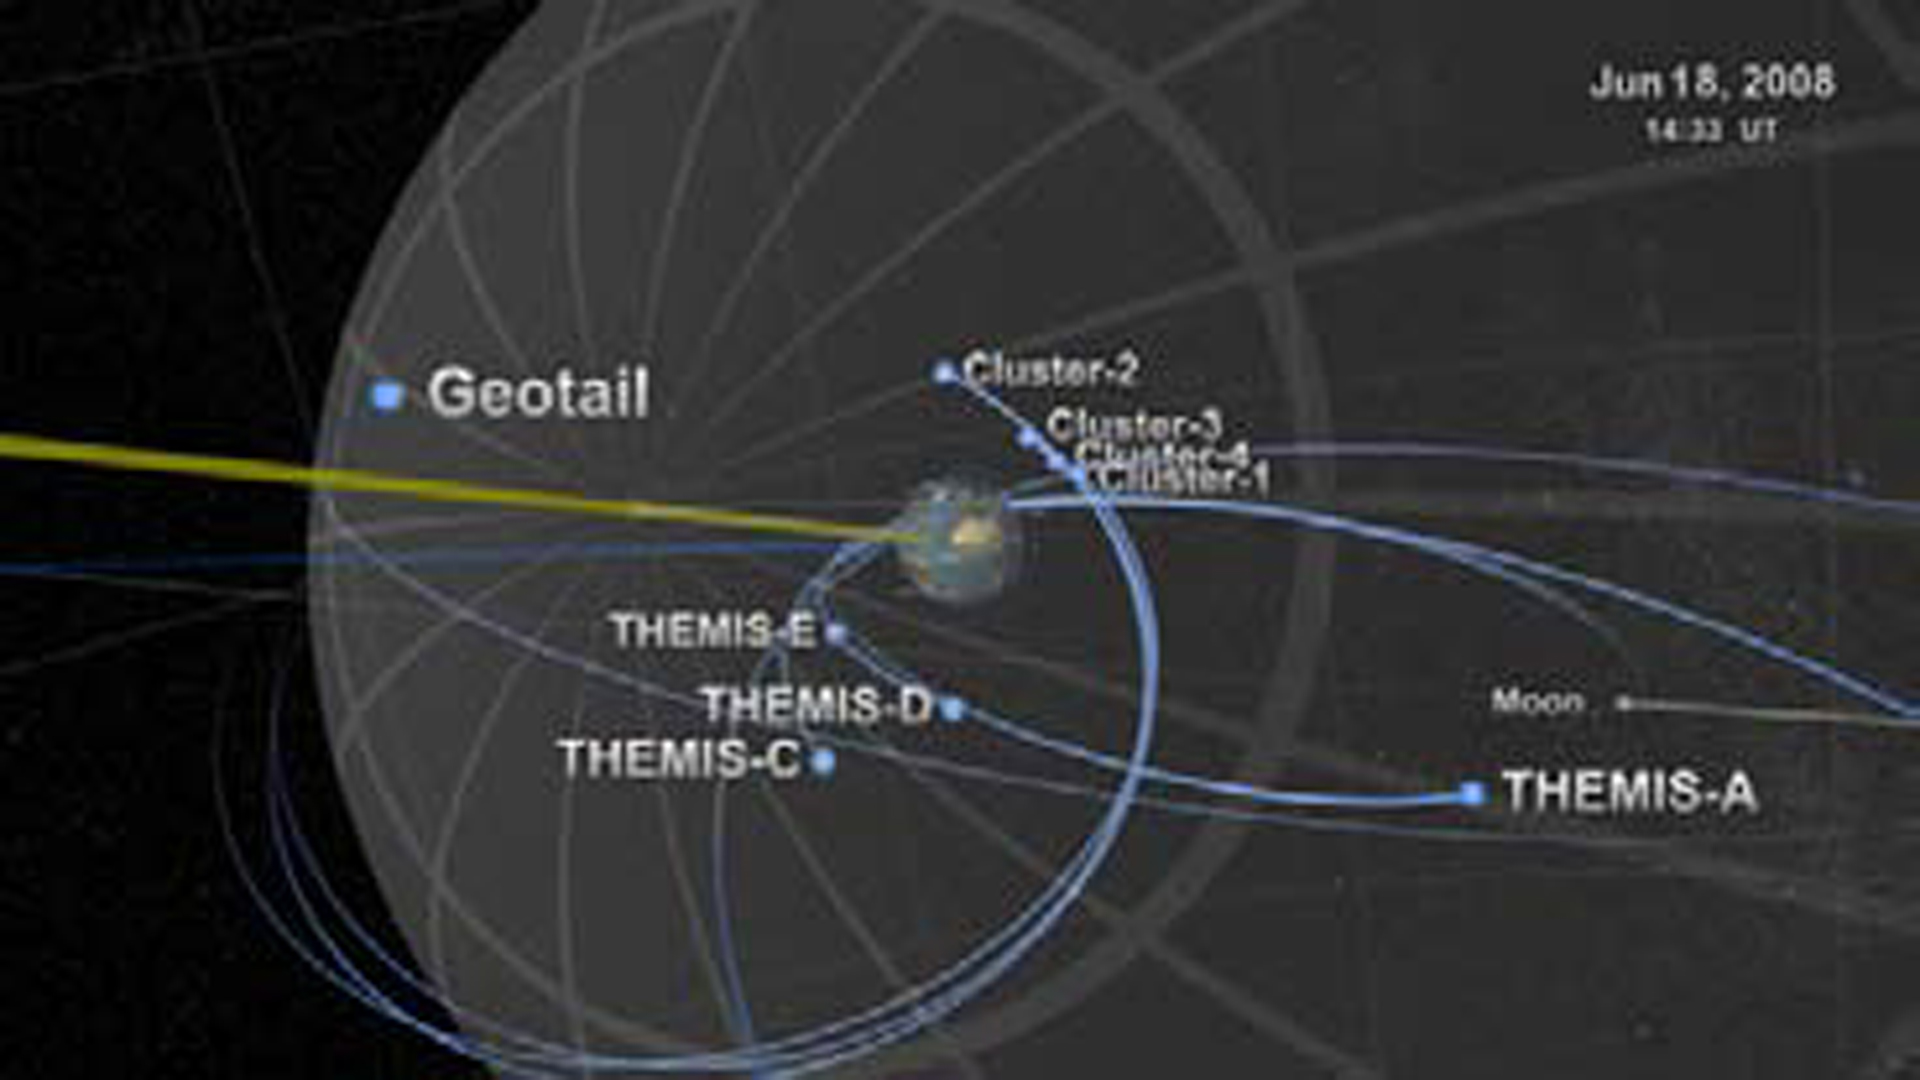
This scientific visualization shows the intricate orbits of NASA’s fleet of solar-observing spacecraft using accurate relative positions and velocities of spacecraft, planetary bodies, and stars, illustrating vast ranges of spatial and temporal scales.
Heliophysics, the science of the sun and its connections to the solar system, is complex and daunting, because the Sun’s influence is present through vast reaches of space beyond our most distant space probes. The structures formed by the Sun’s interaction with planetary bodies are staggeringly huge. The Sun’s interaction with the Earth’s magnetic field creates Earth’s magneto-sphere, a massive structure that protects us from harmful solar particles.
NASA studies heliophysics using a fleet of specialized spacecraft that make measurements from many different, carefully chosen orbits around Earth and throughout the solar system.
Some instruments observe the Sun, and some study interaction phenomena between the Sun and the planets. Studying these phenomena by flying spacecraft through them is analogous to studying an invisible hurricane by flying aircraft through it. We get critical, detailed, in-situ data, but only from where the sensors currently are. Therefore, we sometimes fly clusters of spacecraft to get measurements from close-by positions to help us understand the dynamics.
This visualization shows the elaborate orbits of the spacecraft in NASA’s heliosphysics fleet. Some of the spacecraft are in near-Earth orbit, others are in more exotic orbits about a Lagrange point, and still others are departing the solar system. Data from these many vantage points are critical to the science of heliophysics. The visualization was created using a series of custom Maya and Python scripts and RenderMan shaders that process and accurately display spacecraft and planetary ephermerides based on time.
Hardware:
64-bit linux renderfarm and desktops, Macintosh desktops
Software:
Autodesk Maya 2008, Pixar’s RenderMan and RenderMan Artist Tools, custom MEL scripts, RenderMan shaders, and Python code
Additional Contributors:
Director: Gregory W. Shirah
Created by: Scientific Visualization Studio NASA/Goddard Space Flight Center
Producer: Horace Mitchell
Visualizers: Gregory W. Shirah, Ernie Wright, Tom Bridgman, Horace Mitchell, Trent Schindler, Cindy Starr
Science Advisors: Jeffrey Hayes, Jennifer Rumburg
NASA Public Affairs: Rani Gran
Script & Narration: Michael Starobin
Editor: Stuart Snodgrass
IT Systems Support: James W. Williams
Audio Design & Mixing: Michael Starobin, Mike Velle
Database Management: Joycelyn Jones
Data Providers: Spacecraft ephemerides courtesy of the NASA/GSFC SSCweb and NASA/JPLHorizons, Blue Marble MODIS data composite courtesy of NASA/GSFC MODIS Science Team and NASA’s Earth Observatory, Reto Stockli, SSAI, Inc., Cloud composite textures courtesy of NOAA’s Climate Prediction Center., Hipparcos and Tycho star catalogues courtesy of the European Space Agency., Sea ice data courtesy of NASA’s AMSR-E team.
Music: Wolfgang Amadeus Mozart Symphony No. 29, 1st Movement, Shockwave-Sound.com


