
“Visualization of Casting Process in Foundries” by Schimtt
Conference:
Experience Type(s):
Title:
- Visualization of Casting Process in Foundries
Program Title:
- VROOM
Presenter(s):
Description:
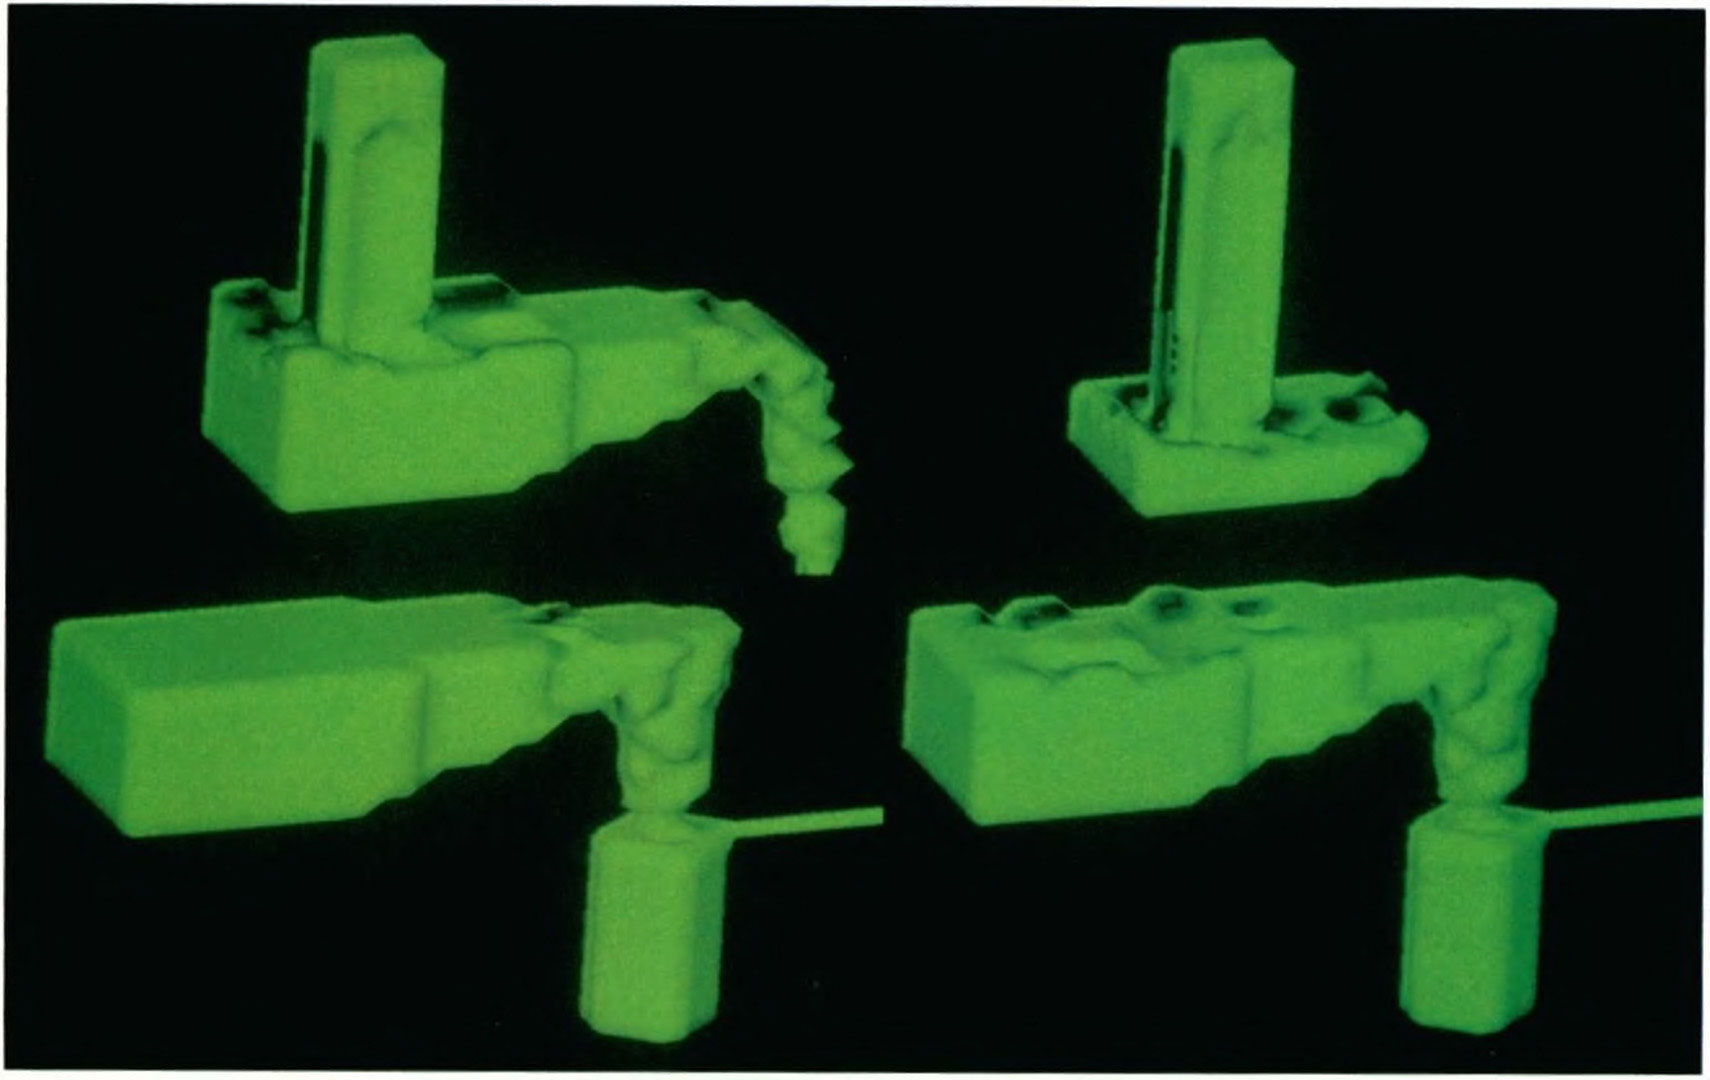
This application models the pouring of a fluidity spiral used to measure the distance metal can flow in a channel before being stopped by solidification. The gray iron at 1395 degrees C is poured into the mold for two seconds and flows down the spiral arm turning to mush at 1215 degrees C. The casting then continues to lose heat to the mold until solidification is complete.
Overview Page:
Submit a story:
If you would like to submit a story about this experience or presentation, please contact us: historyarchives@siggraph.org