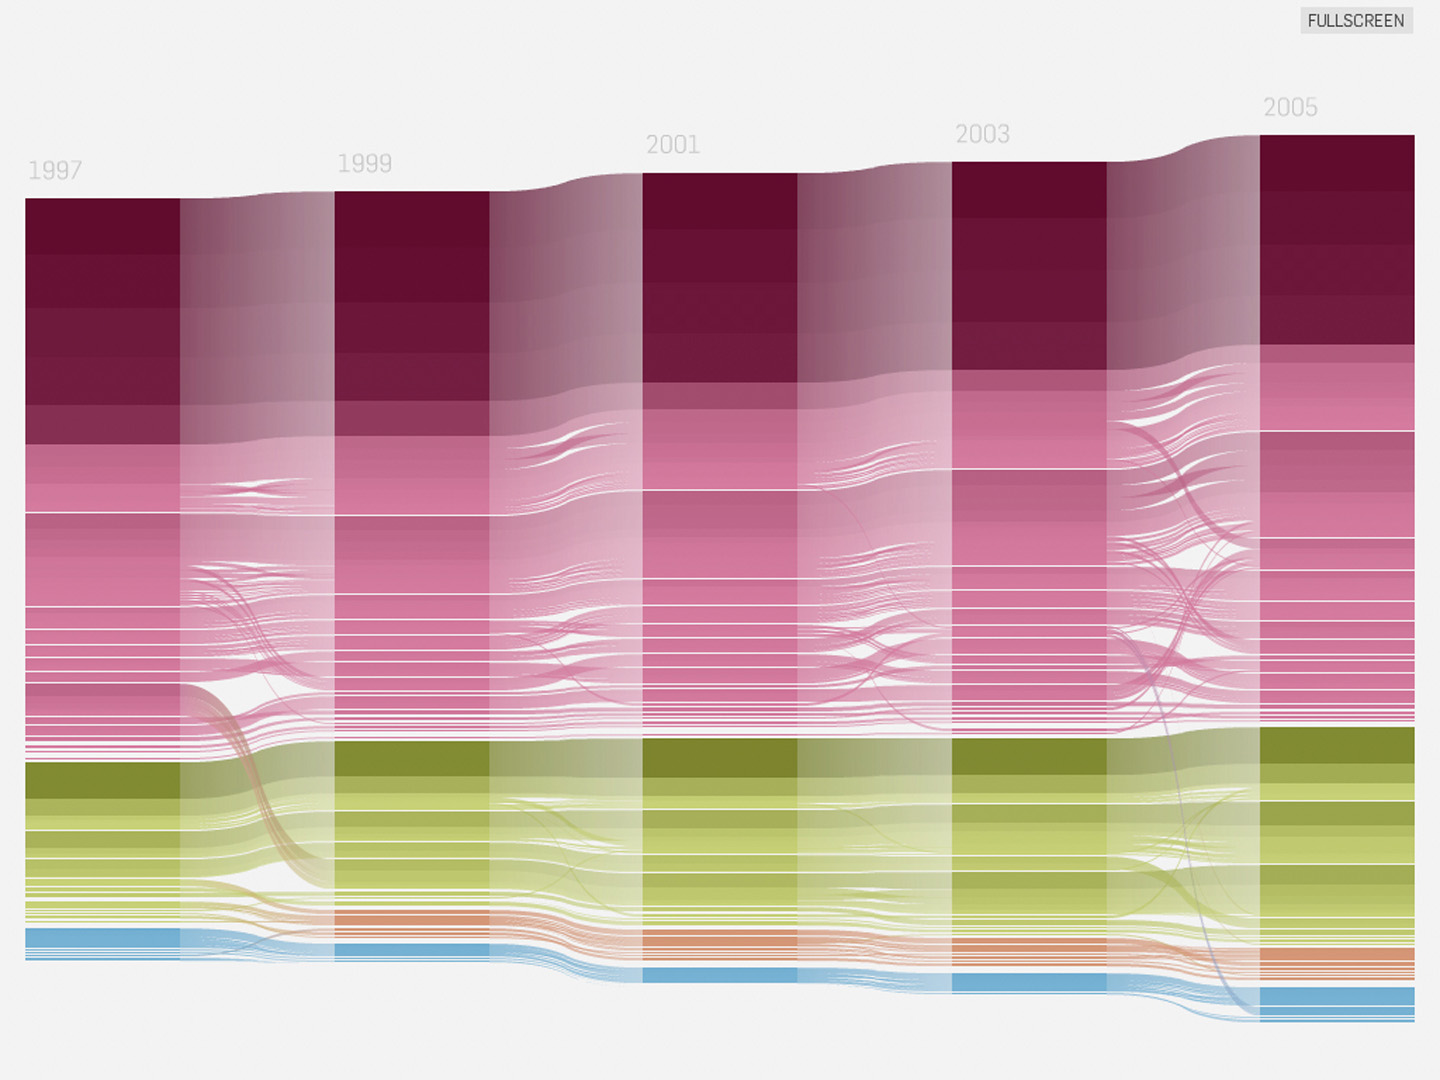
“well–formed.eigenfactor: Visualizing Information Flow in Science” by Stefaner, Rosvall and Bergstrom
Conference:
Type(s):
Talk Type(s):
Title:
- well--formed.eigenfactor: Visualizing Information Flow in Science
Session/Category Title:
- Information and Aesthetics: Designing Interactions
Presenter(s)/Author(s):
Abstract:
well–formed.eigenfactor presents interactive visualizations to explore emerging patterns in scientific citation networks. The Eigenfactor project calculates a measure of importance for individual journals — the Eigenfactor score — as well as measures of citation flow and a hierarchical clustering based thereon. Moritz Stefaner turns this information into a set of four information — aesthetic visualizations, each highlighting different aspects of the data.
References:
1. fn1 Holten, D. (2006): Hierarchical Edge Bundles: Visualization of Adjacency Relations in Hierarchical Data. IEEE Transactions on Visualization and Computer Graphics, Volume 12, Issue 5, pp. 741-748.
2. fn2 Bruls, M., Huizing, K. and van Wijk, J.J. (2006): Squarified Treemaps. Proceedings of the Joint Eurographics and IEEE TCVG Symposium on Visualization, pp. 33-42.


