
“Visualization of Blood Platelets in a Virtual Environment” by Pivkin, Yang, Richardson, Karniadakis and Laidlaw
Conference:
Type(s):
Entry Number: 111
Title:
- Visualization of Blood Platelets in a Virtual Environment
Presenter(s)/Author(s):
Abstract:
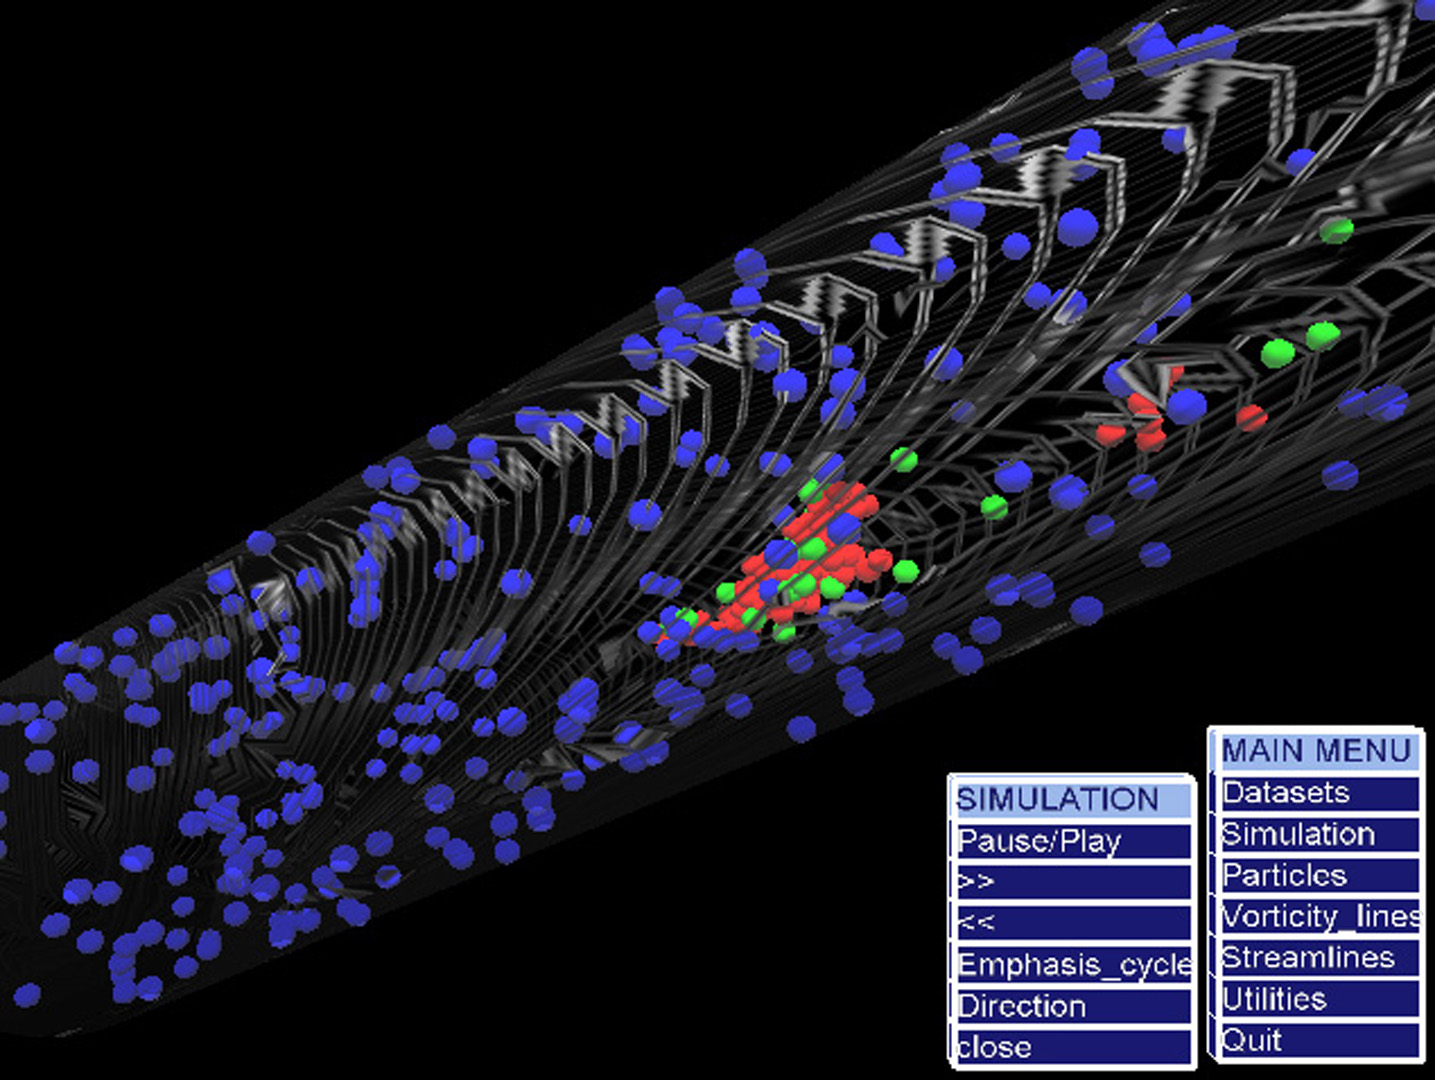
Platelet aggregation is important for closing the minute ruptures in small blood vessels that occur hundreds of times daily, but may also lead to arterial occlusion in the setting of atherosclerosis and trigger disease such as myocardial infarction. Platelet aggregation involves platelet activation due to vascular injury, cell-cell interactions, platelet-vessel walls and platelet-thrombus interactions.
We visualized the results of simulations of platelets in small blood vessels in an interactive immersive virtual environment. Our hope was to increase the intuition of 3D platelet data by using a 3D display, a CAVE environment. Previously the simulation results were visualized using commercially available software Tecplot from Amtec Engineering, Inc. Tecplot can display a large number of platelets on a standard computer monitor. As in the case with most 3D data, the visualization of 3D platelets is not easy on a 2D display.
References:
1. Maxey, M., and Patel, B. 2001. Localized force representation for particles sedimenting in stokes flow. Int. J. Multiphase Flow 9, 1603.
2. Sobel, J., Forsberg, A., Laidlaw, D. H., Zeleznik, R., Keefe, D., Pivkin, I., Karniadakis, G., Richardson, P., and Swartz, S. 2004. Particle flurries: Synoptic 3D pulsatile flow visualization. IEEE Computer Graphics and Applications 24, 2 (March/April), 76–85.