
“Interactive color map displays of domestic information” by Dalton, Billingsley, Quann and Bracken
Conference:
Type(s):
Title:
- Interactive color map displays of domestic information
Presenter(s)/Author(s):
Abstract:
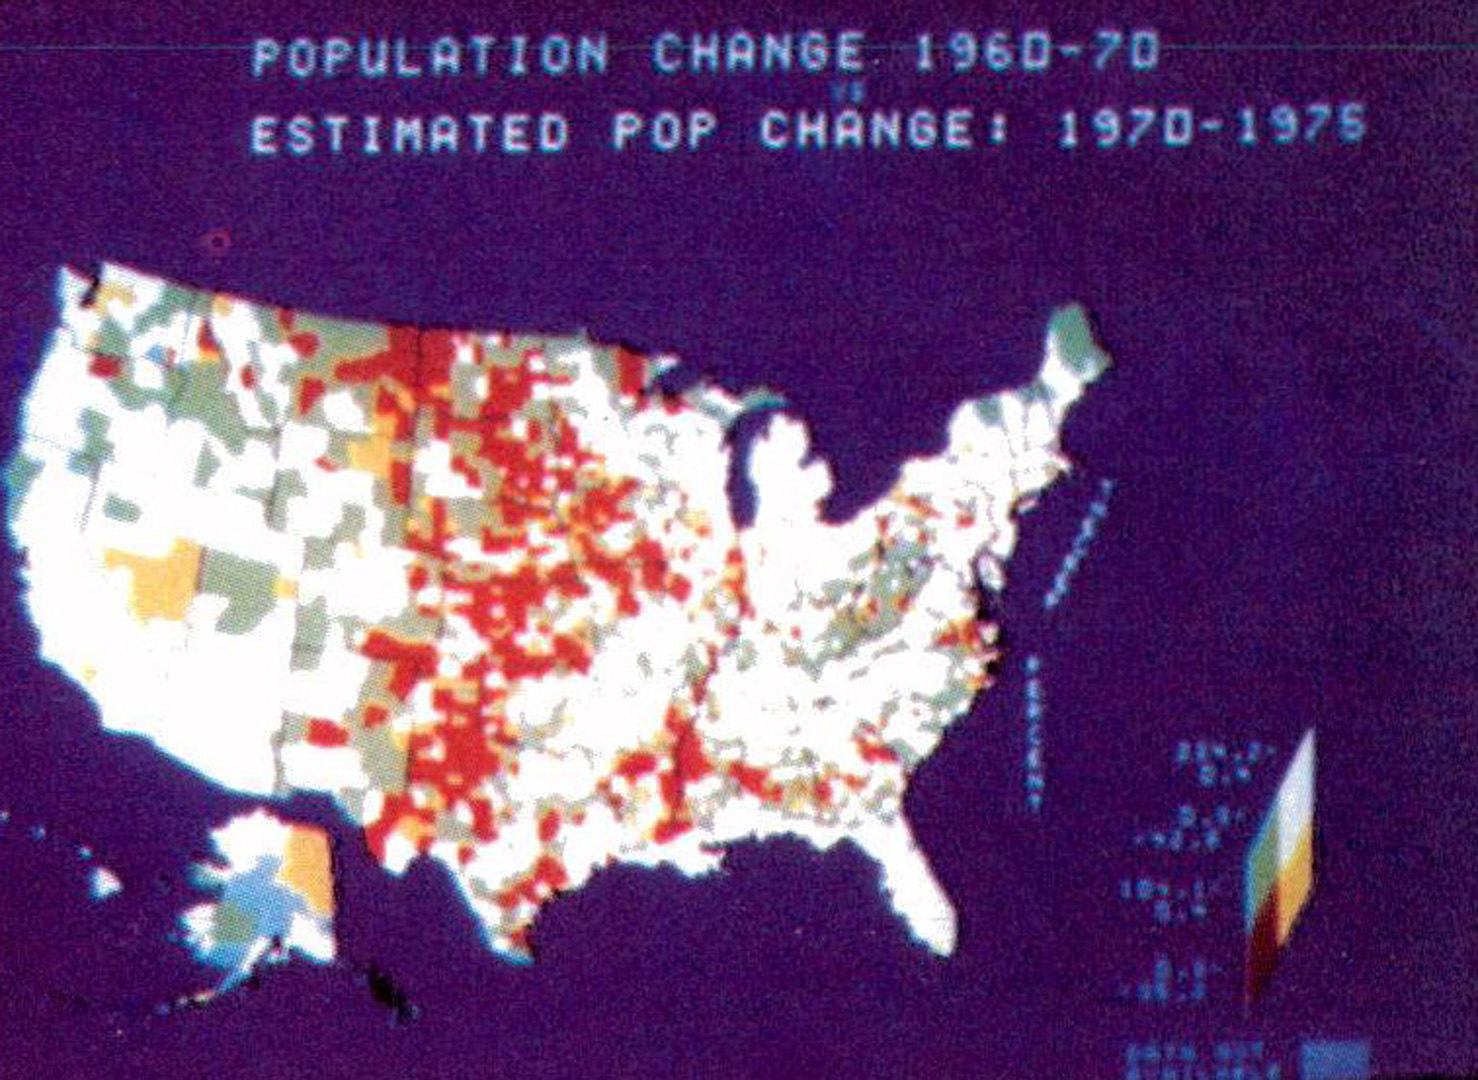
Governmental decision makers require an increasing variety and volume of information in order to formulate effective policies, plans, and legislation. Moreover, rapid access to this broad body of information is critical to timely and effective governmental action. This paper describes a recent joint project undertaken by the NASA/Goddard Space Flight Center and the Bureau of the Census at the request of the Executive of the President to demonstrate the potential of graphic information display technology for the rapid delivery and effective display of Federal statistics. This project resulted in the development of a prototype Domestic Information Display System which was demonstrated to President Carter, members of Congress, and their respective staffs in June 1978. The Domestic Information Display System is an interactive, menu-driven software system which produces single and bivariate choropleth maps of socio-economic data by county at the national and state level, and by census tract for Standard Metropolitan Statistical Areas (SMSA’s). Selected subareas of national and SMSA maps may be dynamically enlarged to show greater detail. Histogram displays may be selected to show statistical as well as geographic structure. The system is minicomputer-based and utilizes the image manipulation capabilities of a raster-scan color graphics terminal designed at NASA/Goddard as part of the Atmospheric and Oceanographic Information Processing System (AOIPS) which was adapted to demonstrate the potential of a Domestic Information Display System. The system is highly interactive and can produce a color map display within seconds of the selection of a data item from a menu. This paper discusses the operation of the Domestic Information Display System, presents sample output products, and describes in detail the software and hardware organization through which the system flexibility and rapid response were achieved.
References:
1. Harden, R. The Presidency in the Information Age: A Philosophy for Managing Information, Bulletin of the American Society for Information Science, Vol. 5, No. 2, (Dec. 1978), p. 13.
2. Zimmerman, E., The Presidency in the Information Age: Planning and Outreach, Bulletin of the American Society for Information Science, Vol. 5, No. 2, (Dec. 1978), pp. 19-21.
3. Meyer, M. A., Broome, F. R., and Schweitzer, R.H. Color Statistical Mapping by the U.S. Bureau of the Census, The American Cartographer, Vol. 2, No. 2, (1975), pp. 100-117.
4. Bracken, P. A., Dalton, J. T., Quann, J. J., and Billingsley, J. B., AOIPS-An Interactive Image Processing System, National Computer Conference, (1978), pp. 159-171.
5. Brassel, K. E., Utrano, J. J. and Hanson, P.O. The Buffalo Crime Mapping System: A Design Strategy for the Display and Analysis of Spatially Referenced Crime Data, SIGGRAPH-ACM Computer Graphics, Vol. 11, No.2, (July 1977), pp. 78-85.