
“Graphlets: a method for visualizing dynamic data” by Gering and Hoford

Conference:
Type(s):
Title:
- Graphlets: a method for visualizing dynamic data
Presenter(s)/Author(s):
Abstract:
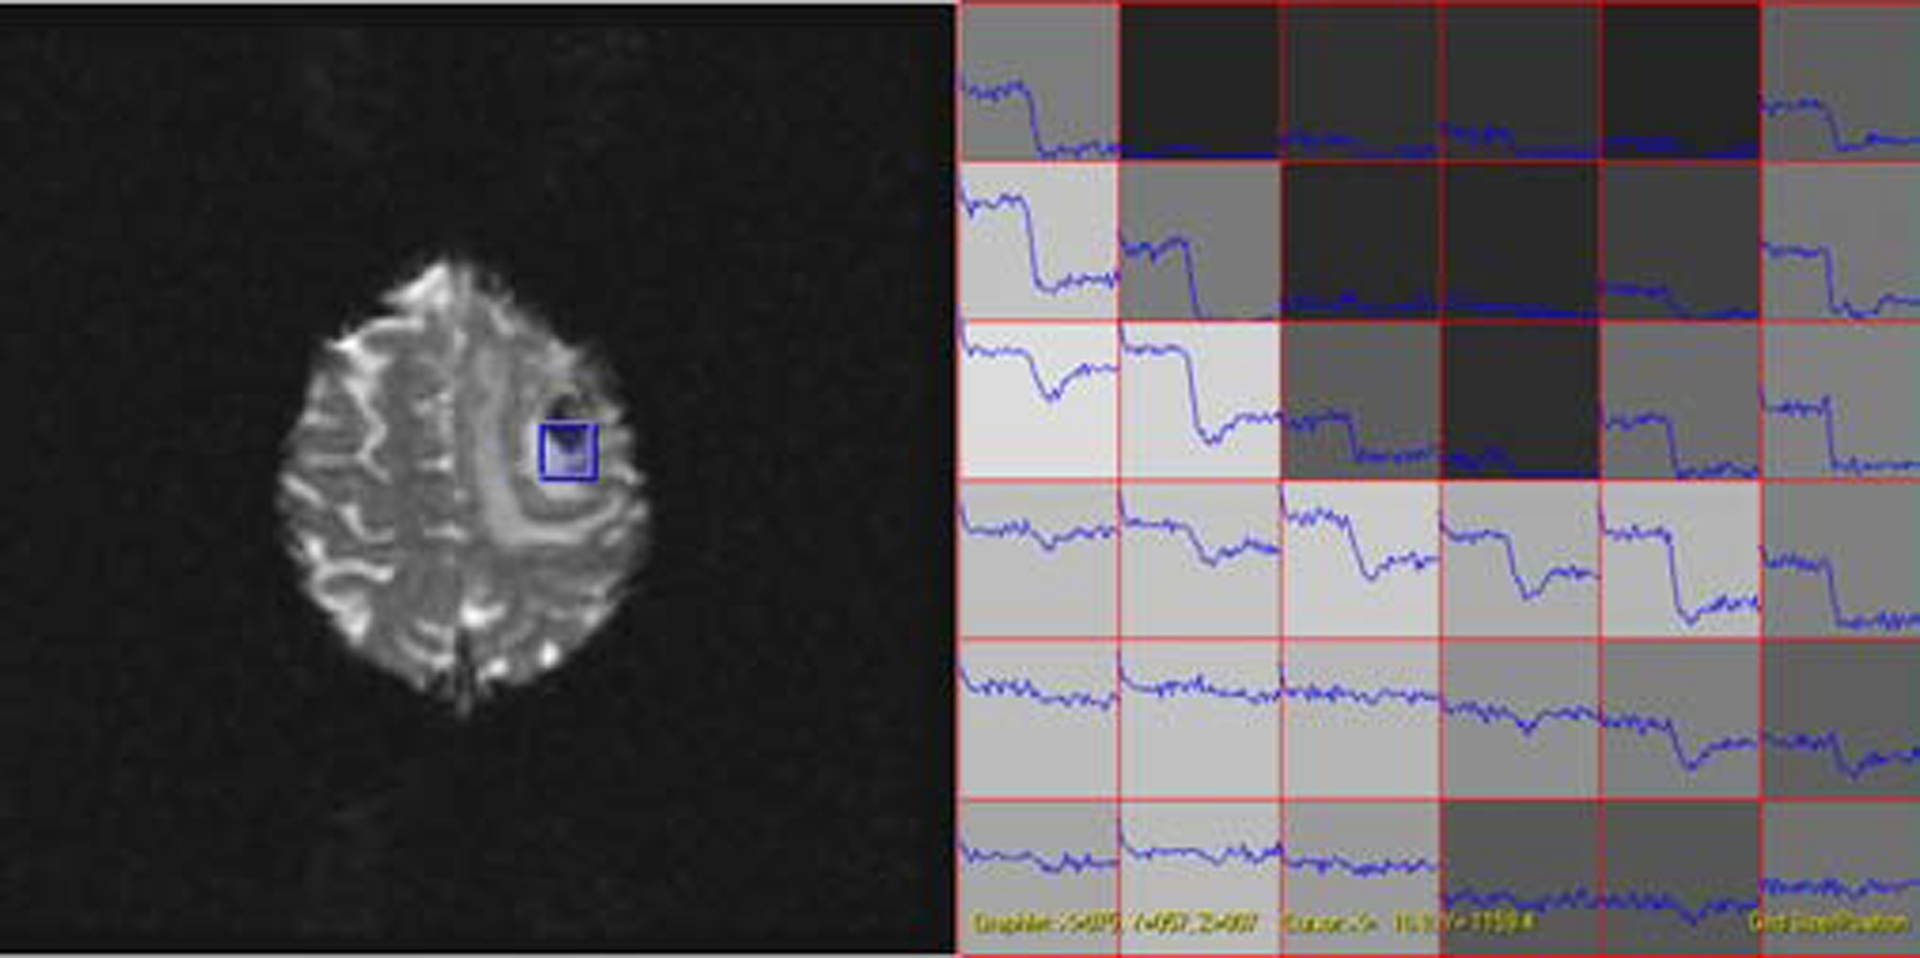
Dynamic contrast-enhanced MRI is often performed to characterize tissue by observing the passage of an agent injected into the bloodstream. MR images are acquired at regular intervals during a time period that begins prior to injection of the contrast agent, and extends through the agent’s passage through the vasculature under study. The MRI signal observed during this time period can be transformed into a curve of contrast concentration over time [Ostergaard]. Parametric maps can be computed from the time-series and overlaid on an anatomical image for review by radiologists. Typical hemodynamic parameters include regional cerebral blood flow (rCBF), mean transit time (MTT), and regional Cerebral Blood Volume (rCBV). The shortcoming of this approach is that the parametric maps, although convenient, do not allow the clinician the opportunity to observe the full richness of the dynamic data.
References:
1. Ostergaard, L., Weisskoff, R. M., Chesler, D. A., Gyldensted, C., Rosen, B. R. High resolution measurement of Cerebral blood flow using intravascular tracer bolus passages, part I: mathematical approach and statistical analysis. Magn Reson Med 1996; 36:715–725