
“Extending the Information Transfer in Multidimensional Analysis through the Use of Interactive Graphics” by Schneider and Gow
Conference:
Type(s):
Title:
- Extending the Information Transfer in Multidimensional Analysis through the Use of Interactive Graphics
Session/Category Title: Large Systems Session
Presenter(s)/Author(s):
Moderator(s):
Abstract:
The models and methods available to the social scientist are now more numerous and more complex than ever before. One of the most complex family of models presently available is non-metric multidimensional analysis. In multidimensional analysis the investigator seeks a spatial representation of a set of data. Ideally the rank-order of the interpoint distances in the multidimensional space should be identical to the rank order of the variables they represent. The emphasis on non-metric models has been due to a self-conscious attempt by social scientists to accommodate cruder levels of observation in their conceptualization and measurement procedures. The algorithms for multidimensional analysis all use iterative procedures which take some initial spatial representation of the data, assess the degree of fit with a criterion, and then change the configuration of points in ways designed to improve the fit. This iterative process is continued until some arbitrary cutoff is reached.
References:
1. The general field of dimensional analysis is best explained in Clyde H. Coombs, A Theory of Data, (New York: John Wiley & Sons, INC., 1964). For an introduction to that area of the field which is generally known as non-metric multidimensional scaling see Joseph B. Kruskal, “Multidimensional Scaling by Optimizing Goodness of Fit to a Nonmetric Hypothesis”, Psychometrika, 29 (1964) pp. 1–27. For more recent developments in the field see Roger N. Shepard, A. Kimball Romney and Sara Beth Nerlove (Eds.), Multidimensional Scaling: Theory and Applications in the Behavioral Sciences, Volumes I and II, (New York: Seminar Press, 1972). For a good review of the available programs and applications see Paul Green and Vithala Rao, Applied Multidimensional Scaling: A Comparison of Approaches and Algorithms, (New York: Holt, Rinehart and Winston, Inc., 1972).]]
2. In this paper we shall use the terms spatial representation, space, and configuration interchangeably.]]
3. J. B. Kruskal, “Multidimensional Scaling: A Numerical Method”, Psychometrika, 29 (1964) pp. 115–129. Recently KYST has become available. KYST combines the best features of MDSCAL and TORSCA.]]
4. L. Guttman, “A General Nonmetric Technique for Finding the Smallest Coordinate Space for a Configuration of Points”, Psychometrika, 33 (1968) pp. 469–506. J. C. Lingoes and E. E. Roskam, “A Mathematical and Empirical Analysis of Two Multi-dimensional Scaling Algorithms”, Psychometrika, 38 (1973) Monograph Supplement.]]
5. F. W. Young and W. S. Torgerson, “TORSCA, A FORTRAN IV Program for Shepard-Kruskal Multidimensional Scaling Analysis”, Behavioral Science, 12 (1967) p. 498.]]
6. Spence, “Multidimensional Scaling: An Empirical and Theoretical Investigation”, Psychometrika, 37 (1972) 461–486. J. C. Lingoes and E. E. Roskam, op. cit.]]
7. J. C. Lingoes and E. E. Roskam, pp. 64–66.]]
8. For a review of interactive graphics applications see the two papers by L. B. Smith, “The Use of Interactive Graphical Systems for Mathematics”, Communications of the ACM, 13 (1970) pp. 625–634; and “A Survey of Interactive Graphical Systems for Mathematics”, Computing Surveys, 2 (1970) pp. 261–301.]]
9. IMDS is written in FORTRAN IV(G) and runs under the Michigan Terminal System on a virtual memory IBM 370/168. IMDS can be run from a standard teletype or a cathode ray tube terminal. The cathode ray tube can be either storage or refresh. IMDS employs subroutines which were originally written for batch programs. These routines are J. B. Kruskal’s MDSCAL-V; J. C. Lingoes’ MFIT; and S. C. Johnson’s HICLUS. IMDS is not the only interactive scaling system. See J. E. Dannemiller and D. J. Gow, “An APL/360 Program for Monotone Distance Analysis”, Behavior Research Methods and Instrumentation, 6 (1974) pp. 356–357.]]
10. E. J. Schneider and H. F. Weisberg, “An Interactive Graphics Approach to Dimensional Analysis”, Behavior Research Methods and Instrumentation, 6 (1974) pp. 185–194.]]
11. For a discussion of the ability to retrieve metric information from ordinal information see B. N. Shepard, “Metric Structure in Ordinal Data”, Journal of Mathematical Psychology 3 (1966) pp. 287–315.]]
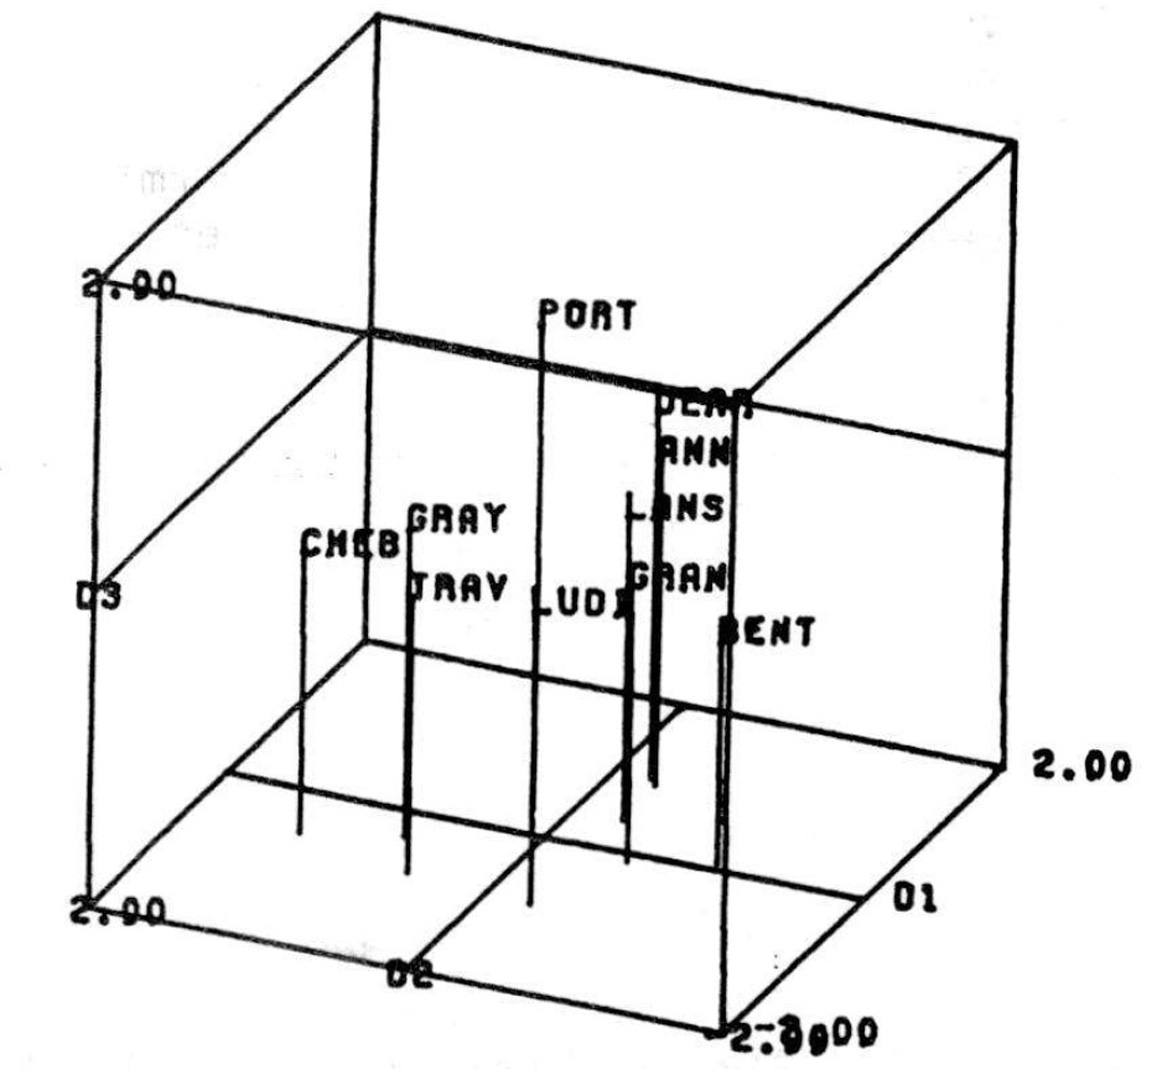
12. Throughout this paper we will describe IMDS as it is typically used. Such use can be modified by the user at any time by normal IMDS commands. For example, the plane displayed does not have to be the plane 1, 2; it could be the plane 2, 3. The dictionary need not be displayed; variable names could be used to label the points rather than numbers or alternatively, a single character may be used. The maximum value for display can be changed from 2.0 to whatever degree of resolution the user desires. The choice of options can tailor the display to the user’s requirements.]]
13. Stress is a measure of fit that corresponds to the coefficient of alienation in regression analysis. See Kruskal, supra. fn. 3.]]
14. For a discussion of the Shepard diagram see Kruskal supra. fn. 3.]]
15. For a discussion of the steepest descent algorithm see Kruskal supra. fn. 3.]]
16. The hash marks along the vectors represent the first attempt which the program will make in the next iteration. If the stress increases instead of decreases, the program realizes that it may have gone too far along the gradient (i.e., the stepsize was too large). It will then “back-up” by reducing the stepsize by a factor of ten. Unfortunately the negative gradient (Figure 3) in our display is not particularly large.]]
17. For a discussion of the elbow diagram used in the scree test see R. J. Rummel, Applied Factor Analysis (Evanston: Northwestern University Press 1970) p. 361.]]
18. For an excellent description of the state of the art of three dimensional display see W. N. Newman and R. F. Sproull, Principles of Interactive Computer Graphics, (New York: McGraw-Hill Book Co. 1973). Unfortunately most three dimensional graphics literature is inappropriate to our work because it deals with solid objects and/or continuous surfaces.]]
19. The scaling literature contains few examples of three dimensional displays. When a three dimensional display is used it is either a photograph of flags on sticks or balls on strings, or an elaborately shaded diagram drawn by a draftsman. For example see D. J. Carroll and M. Wish, “Measuring Preference and Perception with Multidimensional Models”, Bell Telephone Record 49 (1971) pp. 146–154. Computer generated three dimensional displays have not been used in the scaling literature.]]
20. S. C. Johnson, “Hierarchical Clustering Schemes”. Psychometrika 32 (1967) pp. 241–254.]]
21. P. H. Schönemann and R. M. Carroll, “Fitting One Matrix to Another under Choice of a Central Dilation and a Rigid Motion”, Psychometrika 35 (1970) pp. 245–255. J. C. Lingoes, “A FORTRAN IV Program Generalizing the Schönemann-Carroll Matrix Fitting Algorithm to Monotone and Linear Fitting of Configurations”, Educational and Psychological Measurement 34 (1974) pp. 121–124.]]
22. See J. G. Rusk and H. F. Weisberg, “Perceptions of Presidential Candidates: Implications for Electoral Change”, Midwest Journal of Political Science 16 (1972) pp. 388–410.]]
23. Perhaps the most massive transfer of information on multidimensional scaling occurred in 1972 at the Bell Laboratories-University of Pennsylvania Workshop on Multidimensional Scaling. The audience consisted of relatively sophisticated users from a variety of fields. They were presented with a series of lectures which employed a considerable amount of graphical displays. Perhaps the highlight of which was a film produced by Bell Laboratories which traced the movement of points and the smoothing of the regression curve. The unanimous impression was that everyone who viewed the film learned more about the behavior of the algorithm in the process. This film provided the impetus for many of the features of IMDS. It is noteworthy that IMDS has been used by some of the principal developers of the scaling model and algorithm. Even these individuals felt they had learned something by being able to interact with the system and by seeing the graphical result. Their experience was similar to the audience experience at the Workshop.]]
24. An algorithm for placing points for individuals in a multidimensional space is described in G. B. Rabinowitz, Spatial Models of Electorate Choice: An Empirical Analysis (Chapel Hill: Institute for Research in the Social Sciences, 1973).]]
25. We added the default system to the commands in order to minimize this problem.]]
26. Some potential users are reluctant to use a CRT because they want a hard copy of the analysis. IMDS provides hard copy on a remote line printer. This removes a potential stumbling block for most, but not all potential users.]]