
“DATAPLOT—an interactive high-level language for graphics, non-linear fitting, data analysis, and mathematics” by Filliben
Conference:
Type(s):
Title:
- DATAPLOT—an interactive high-level language for graphics, non-linear fitting, data analysis, and mathematics
Presenter(s)/Author(s):
Abstract:
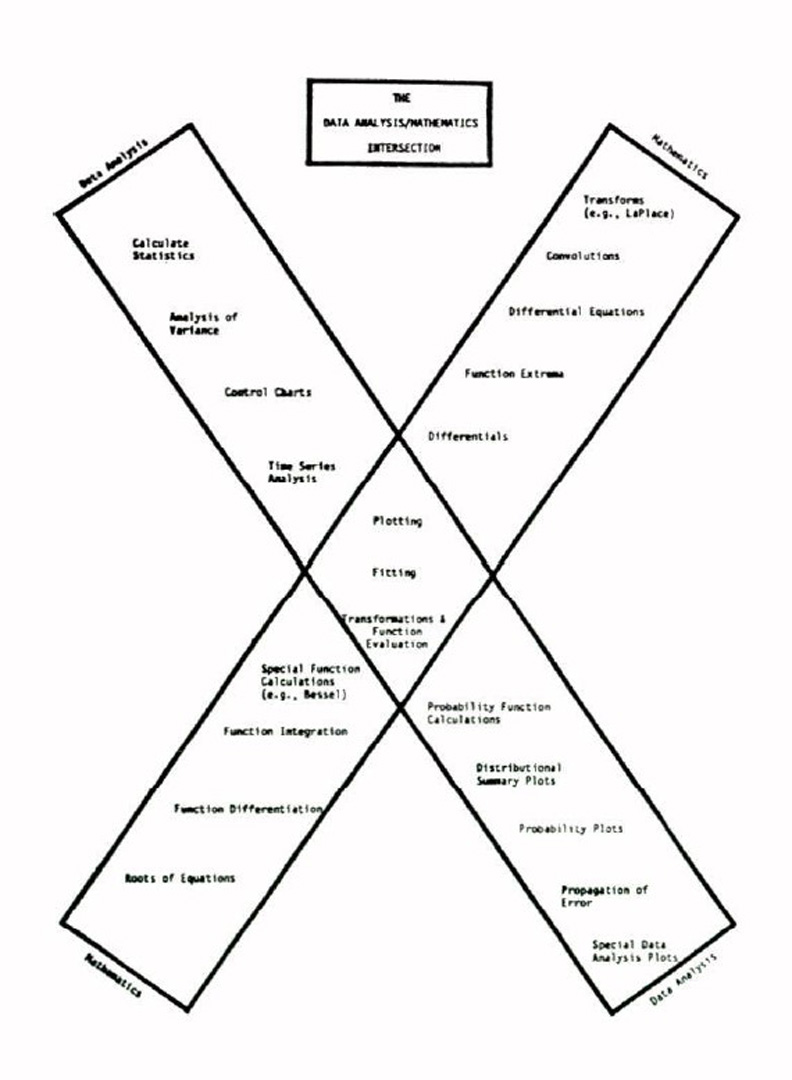
This paper describes the design philosphy and features of DATAPLOT—a high-level (free-format English-like syntax) language for: 1) graphics (continuous or discrete); 2) fitting (linear or non-linear); 3) general data analysis; 4) mathematics. DATAPLOT was developed originally in 1977 in response to data analysis problems encountered at the National Bureau of Standards. It has subsequently been the most heavily-used interactive graphics and non-linear fitting language at NBS. It is a valuable tool not only for “raw” graphics, but also for manuscript preparation, modeling, data analysis, data summarization, and mathematical analysis. DATAPLOT may be run either in batch mode or interactively, although it was primarily designed for (and is most effectively used in) an interactive environmnet. DATAPLOT graphics may appear on many different types of output devices. Due to its modular design and underlying ANSI FORTRAN (PFORT) code, DATAPLOT is portable to a wide variety of computers. The paper is divided into three general parts: part 1 deals with background motivation and design philosophy; part 2 deals with capability and implementation features; part 3 deals with a comparison of DATAPLOT to other systems/languages.
References:
1. Caporal, P. M. and Hahn, G. J. (1981). An Overview of Tools for Automated Statistical Graphics. General Electric Corporate Research and Development Technical Information Series Report No. 81CRD024, Schenectady, New York.
2. Coswell, W. (1977). Portability of Numerical Software. Lecture Notes in Computer Science No. 57 Springer-Verlag, New York.
3. Filliben, James J. (1978). DATAPLOT—An Interactive System for Graphics, Fortran Function Evaluation, and Linear/Non-linear Fitting. Proceedings of the Statistical Computing Section of the American Statistical Association 1977.
4. Filliben, James J. (1979). Factors Affecting the Use of Statistical Graphical Software. Proceedings of the Twelfth Interface Symposium on Computer Science and Statistics. Toronto.
5. Filliben, James J. (1979). New Features in DATAPLOT—A Language for Graphics, Non-linear Fitting, Data Analysis, and Mathematics. Proceedings of the Statistical Computing Section of the American Statistical Association: 1977.
6. Filliben, James J. (1980). A Review of DATAPLOT—An Interactive High-Level Language for Graphics, Non-linear Fitting, Data Analysis, and Mathematics. Proceedings of the Statistical Computing Section of the American Statistical Association: 1980.
7. Francis, I. (1981). Comparative Review of Statistical Software (Edition 2). International Association for Statistical Computing. 358 Ives Hall, Cornell University, Ithaca, New York.
8. Knott, Gary D. (1979). MLAB—A Mathematical Modeling Tool. Computer Programs in Biomedicine, pages 271-280. Elsevier/North Holland Biomedical Press.