
“Data Visualization: A Starting Point” by Laramee
Notice: Pod Template PHP code has been deprecated, please use WP Templates instead of embedding PHP. has been deprecated since Pods version 2.3 with no alternative available. in /data/siggraph/websites/history/wp-content/plugins/pods/includes/general.php on line 518
Conference:
- SIGGRAPH 2014
-
More from SIGGRAPH 2014:
Notice: Array to string conversion in /data/siggraph/websites/history/wp-content/plugins/siggraph-archive-plugin/src/next_previous/source.php on line 345

Notice: Array to string conversion in /data/siggraph/websites/history/wp-content/plugins/siggraph-archive-plugin/src/next_previous/source.php on line 345


Type(s):
Title:
- Data Visualization: A Starting Point
Presenter(s):
Description:
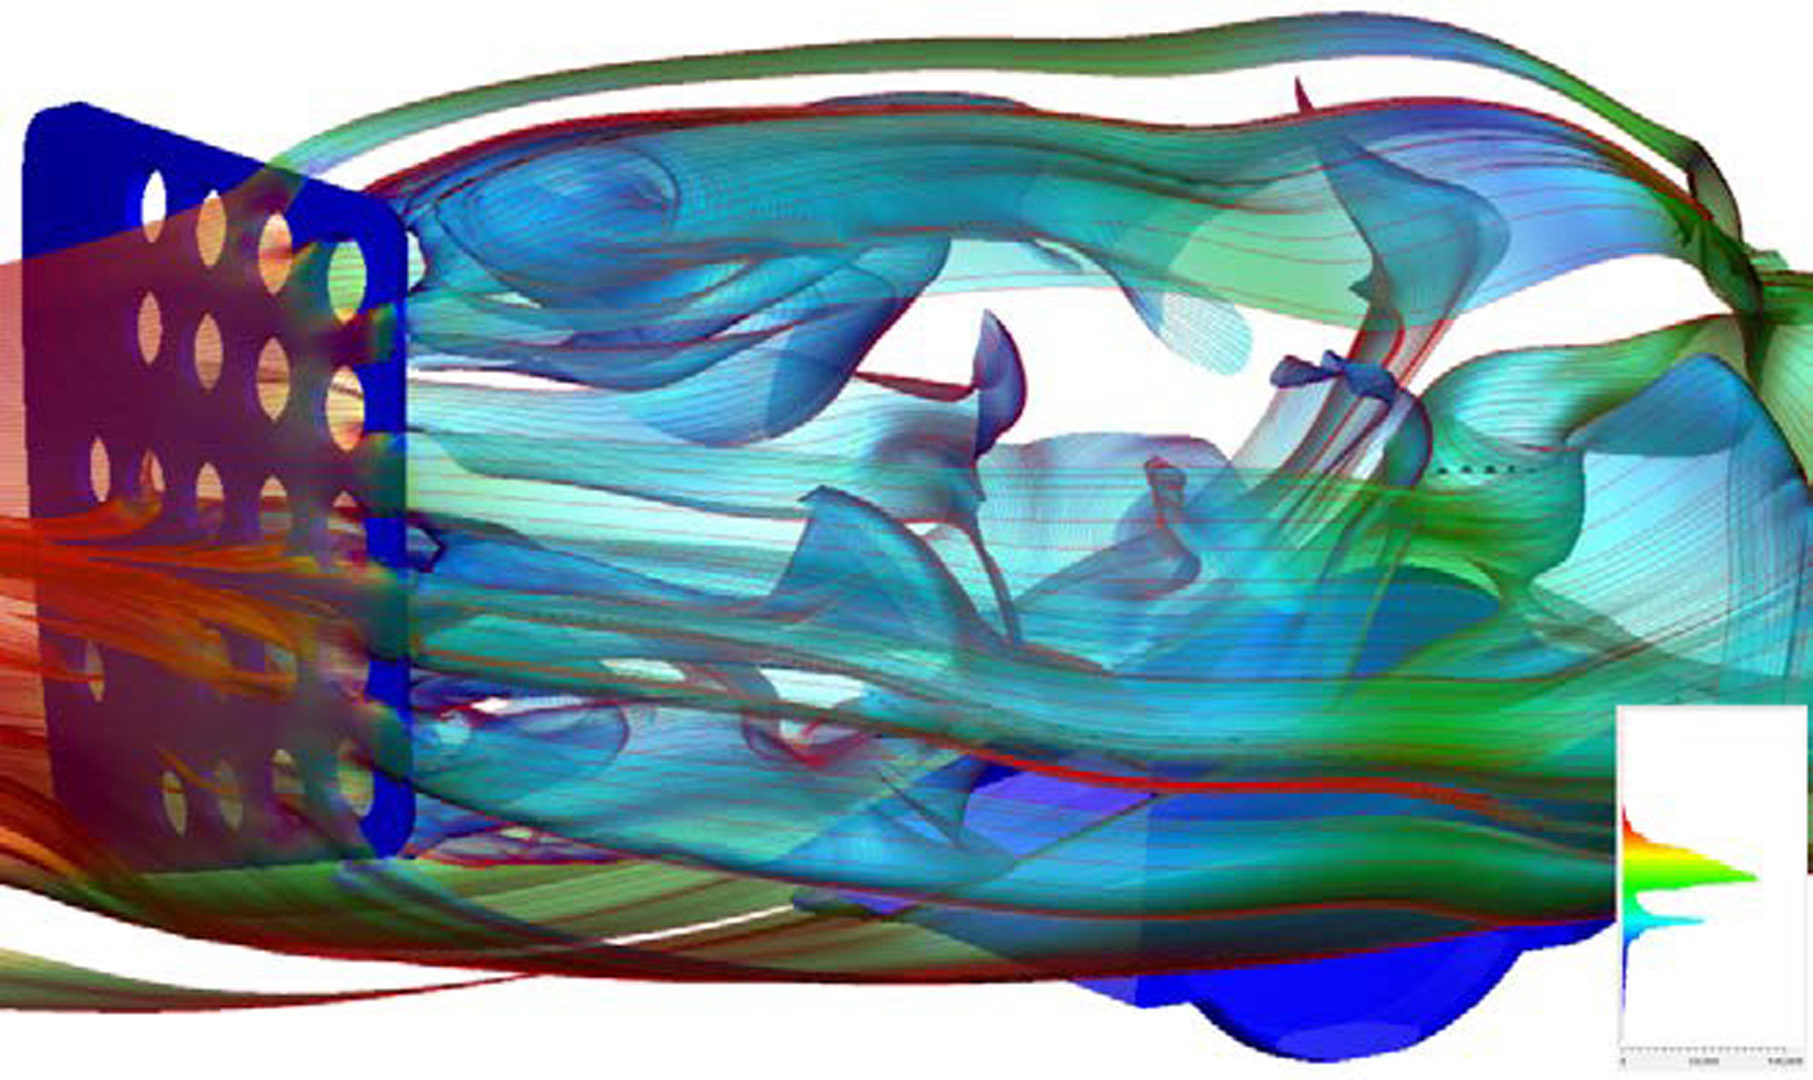
Many computing processes result in large, complex, time-dependent data sets. Over the past three decades, the sizes of common data sets has exploded ranging from several Gigabytes to Terabytes in size.
From the data collection and storage point of view, computing in general is a huge success. Data is archived very cheaply and can provides a very valuable resource for those studying improvements in academia and industry. However all data generating practices face major challenges from a knowledge extraction point of view. Our ability to collect and archive data vastly exceeds our ability to extract useful knowledge and insight from it. The larger and more complex a dataset is, the more difficult it is to extract knowledge and insight. This is precisely where the power of data visualization comes in.
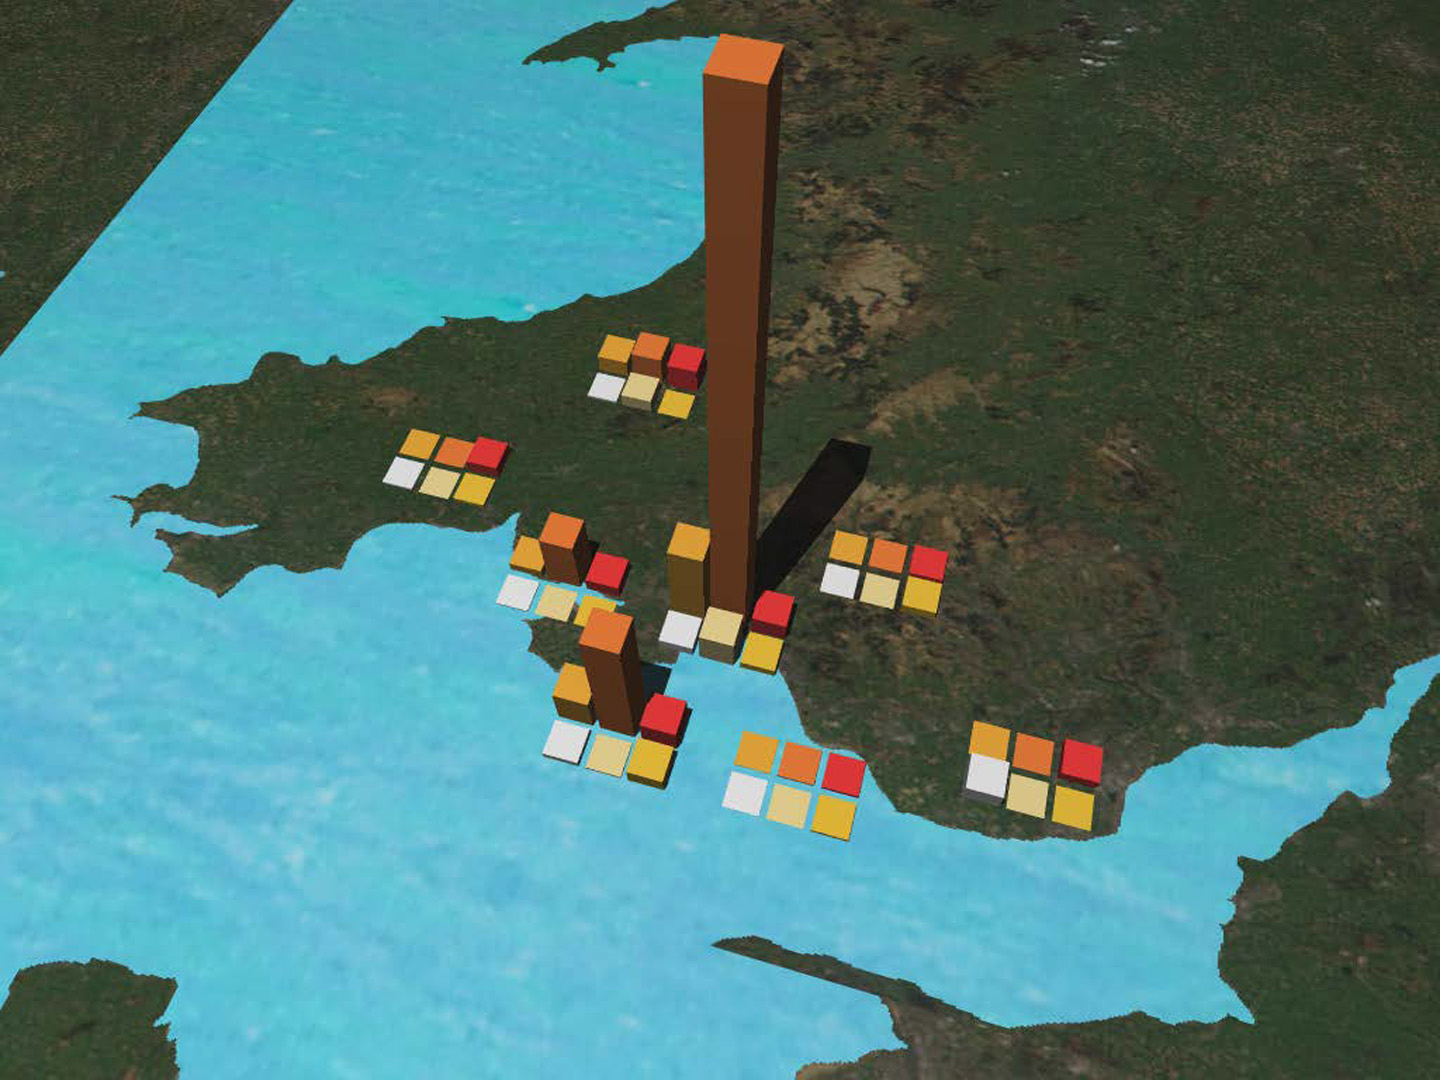
The exciting and vibrant field of Visualization is an increasingly important research area due to its wide range of applications in many disciplines. Data visualization is vital in gaining an understanding large, complex data sets by exploiting the human visual system. Data visualization leverages modern computer graphics in order to provide a visual overview, explore, analyze, and present phenomena which is often difficult to understand.
This course provides both a theoretical and practical introduction to data visualization. Due to the varying nature of data sources, we will take a two-fold approach introducing both information visualization for abstract data and scientific visualization for inherently spatial data. Some of the topics we will discuss are: purposes and goals of visualization, applications, challenges, sources of data, data dimensionality, time-dependent, data types.