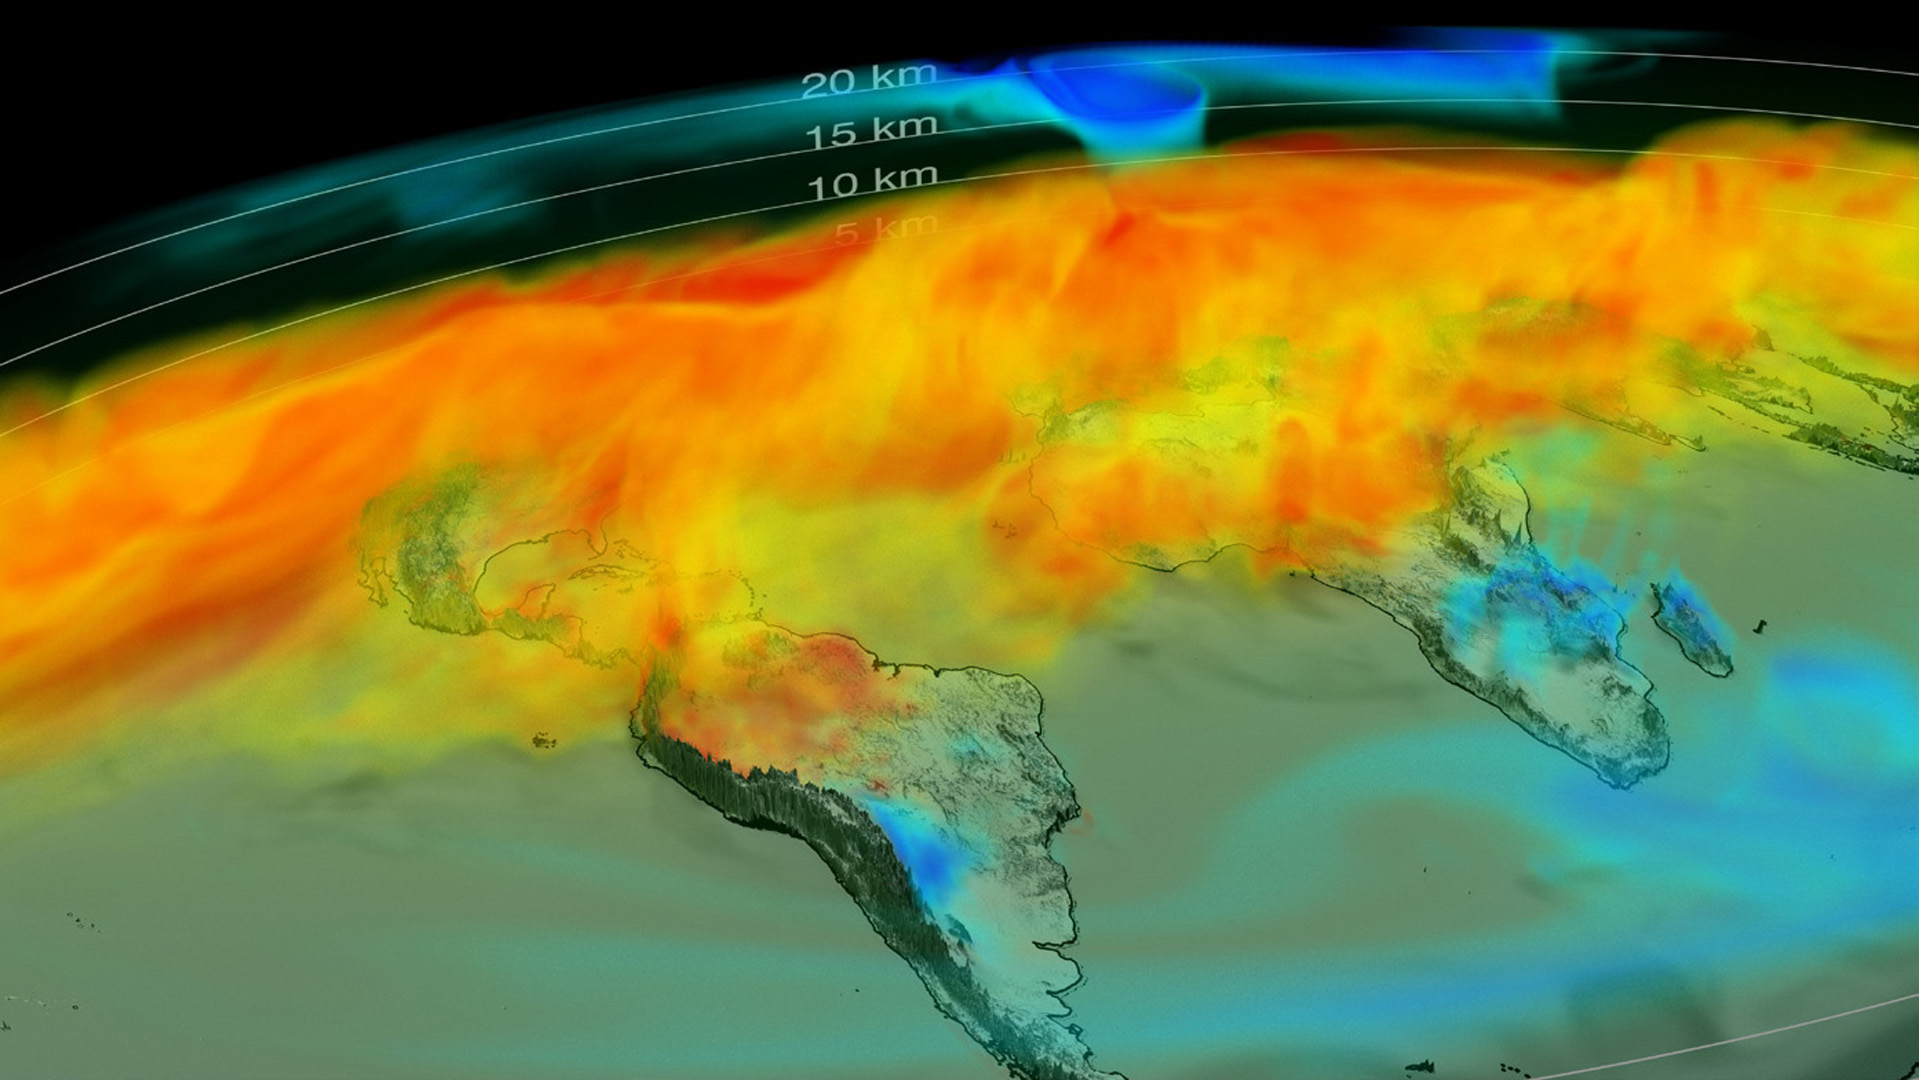
“Seasonal Changes in Carbon Dioxide” by Mitchell and Shirah
Conference:
- SIGGRAPH 2017 More animation videos from SIGGRAPH 2017:


SIGGRAPH Video Review:
Track:
- 03
Title:
- Seasonal Changes in Carbon Dioxide
Length:
- 1:22
Director(s):
Company / Institution / Agency:
- NASA Scientific Visualization Studio
Description:
Synopsis: Volumetric carbon dioxide concentrations vary from winter to summer. CO2 is high during northern winter due to reduced photosynthesis. During spring and summer, photosynthesis increases as plants grow, reducing CO2 levels. These data are based on a synthesis of Orbiting Carbon Observatory-2 satellite data and the Goddard Earth Observing System model.


