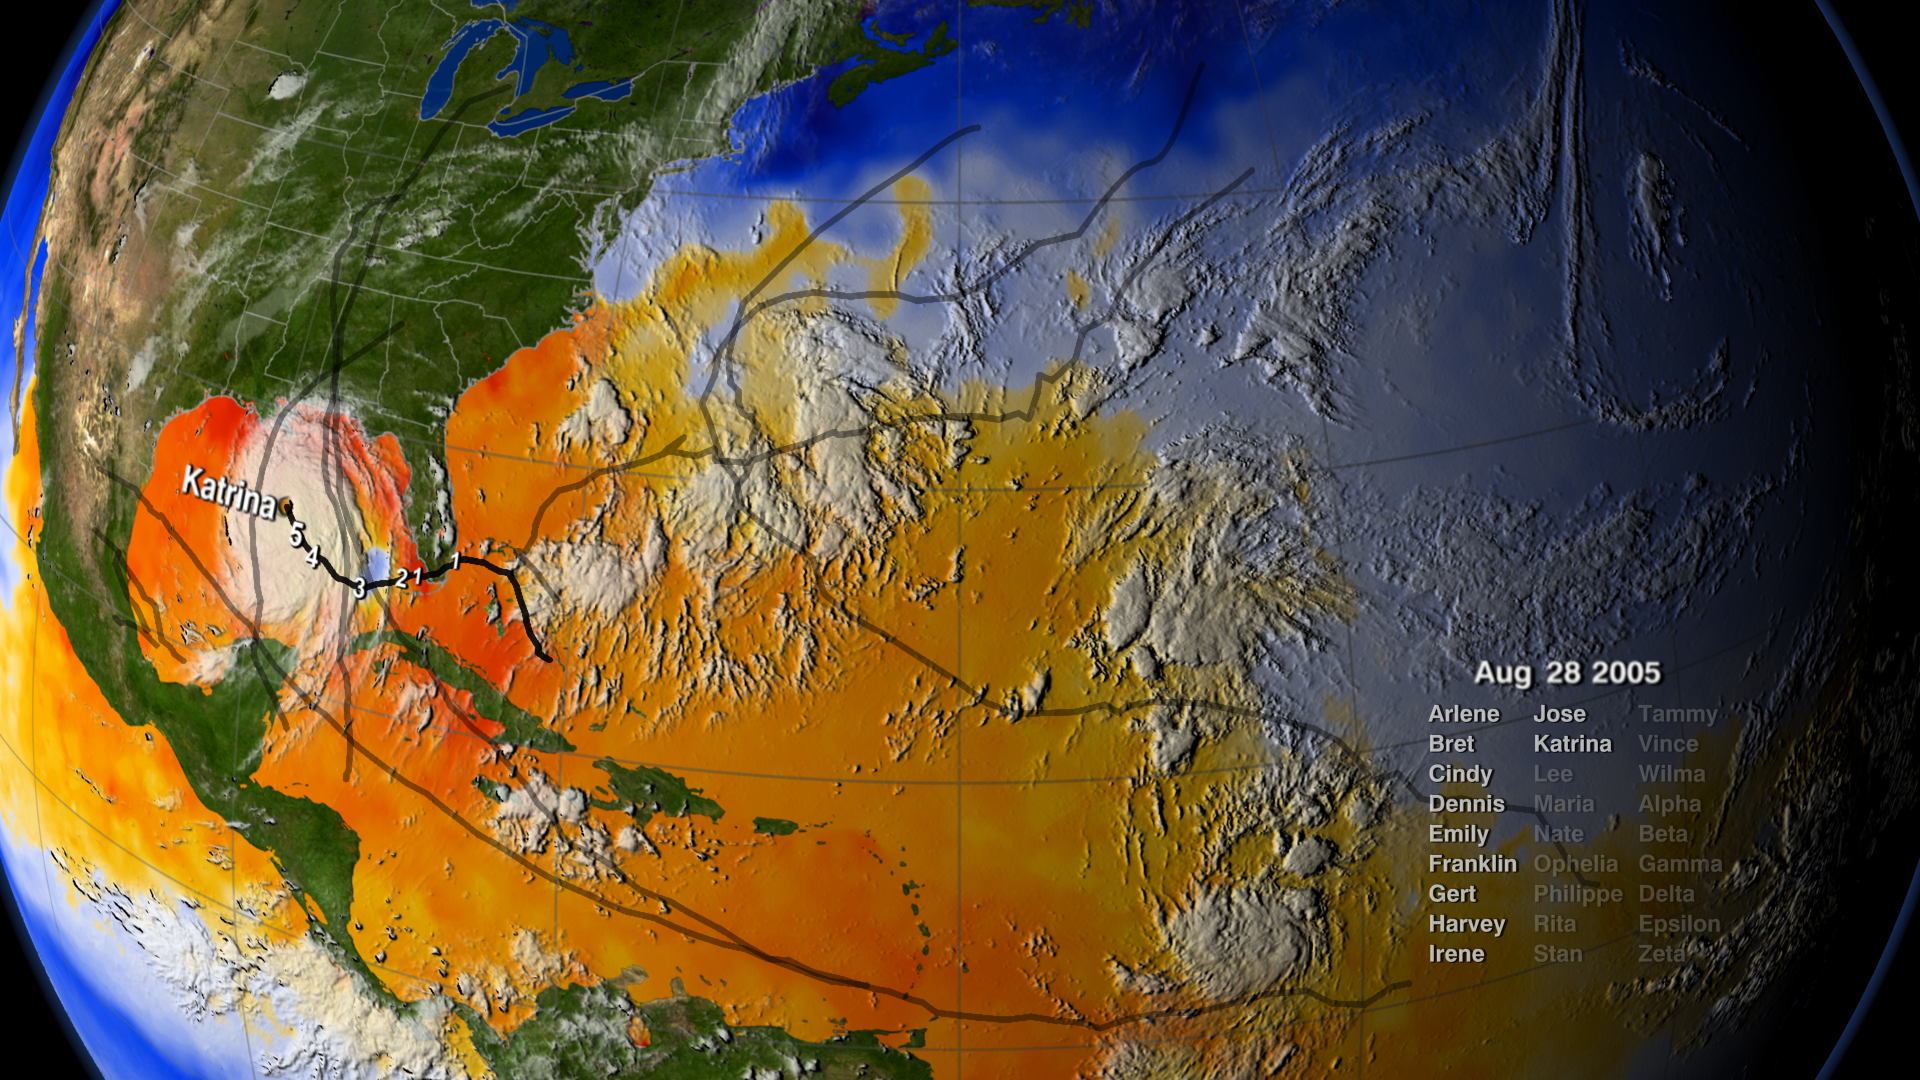
“27 Storms: Arlene to Zeta” by GST – NASA/Goddard Space Flight Center
Conference:
- SIGGRAPH 2007 More animation videos from SIGGRAPH 2007:


SIGGRAPH Video Review:
Track:
- 23
Title:
- 27 Storms: Arlene to Zeta
Director(s):
Company / Institution / Agency:
- GST – NASA/Goddard Space Flight Center
Description:
Many records were broken during the 2005 Atlantic hurricane season: most hurricanes ever, most Category 5 hurricanes, and most intense hurricane ever recorded in the Atlantic as measured by atmospheric pressure. This visualization shows all 27 named storms that formed in the 2005 Atlantic hurricane season and examines some of the conditions that made hurricane formation so favorable.
The animation begins by showing that regions of warm water favorable for storm develop-ment advance northward through the peak of hurricane season and then recede as the waters cool. These warm waters power the hurricanes. Measurements indicate that there was very little shearing wind activity in 2005 to impede storm formation.
Sea-surface temperatures, clouds, storm tracks, and hurricane category labels are shown as the hurricane season progresses. This visualization shows some of the actual data that NASA and NOAA satellites mea-sured in 2005 – data used to predict the paths and intensities of hurricanes. Satellite data play a vital role in helping us understand the land, ocean, and atmosphere systems that have such dramatic effects on our lives.
Hardware:
TECHNOLOGY
Custom data ingest, registration, and date-mapping shaders and MEL scripts.
HARDWARE
Dual CPU linux systems running Fedora Core 4 Dual CPU Macintosh running OS X 10.4
Software:
Linux: Maya, Renderman, Interactive Data Language (IDL)
OS X: Photoshop, After Effects
Additional Contributors:
Director: Greg Shirah
Producer: Dr. Horace Mitchell
Primary Animators: Greg Shirah, Alex Kekesi, Lori Perkins
Science Adviser: Dr. Jeff Halverson
Additional Contributors: Jesse Allen, Dr. Tom Bridgman, Dr. Jeff de La Beaujardiere, Joycelyn T. Jones, Marte Newcombe, Eric Sokolowsky, Cindy Starr, Vicky Weeks, James W. Williams
Editor: Stuart Snodgrass
Writer: Michael Starobin
Narrator: Michael Starobin
Audio: Mike Velle
Systems Support: Kevin Mahoney


