“Mapping, illuminating, and interacting with science” by Boyack, Klavans, Paley and Börner
Conference:
Title:
- Mapping, illuminating, and interacting with science
Session/Category Title: The Viz Biz
Presenter(s)/Author(s):
Abstract:
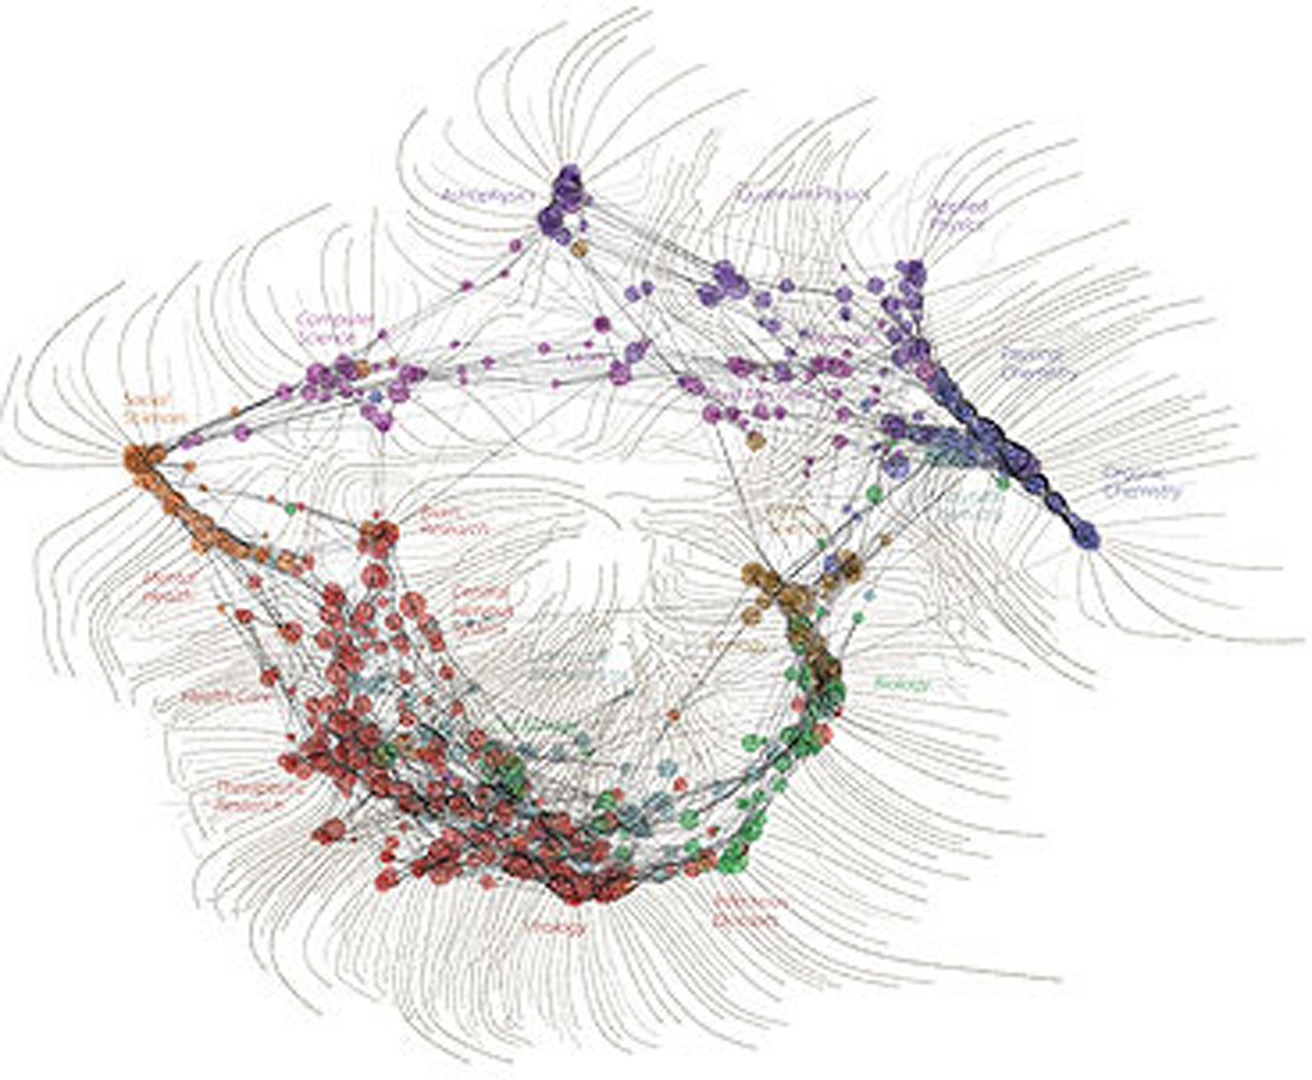
A world map and a science map that show 800,000 papers in 776 scientific paradigms can be interactively explored to understand the origin of scientific contributions and the impact of scientists.
References:
1. B?rner, K., C. Chen, K. W. Boyack (2003). Visualizing Knowledge Domains. Annual Review of Information Science & Technology. B. Cronin. Medford, NJ, Information Today, Inc./ASIST. 37: 179–255.
2. Paley, W. B. (2002). Illuminated Diagrams: Using Light and Print to Comparative Advantage. Accessed on 4-10-2007 at http://tinylink.com/?AtOWI0gYv5.
3. Shiffrin, R. M. and K. B?rner, Eds. (2004). Mapping Knowledge Domains, PNAS, 101 (Suppl. 1).


