
“An ontological bridge between information and scientific visualization” by Lechner and Feng
Conference:
Type(s):
Title:
- An ontological bridge between information and scientific visualization
Presenter(s)/Author(s):
Abstract:
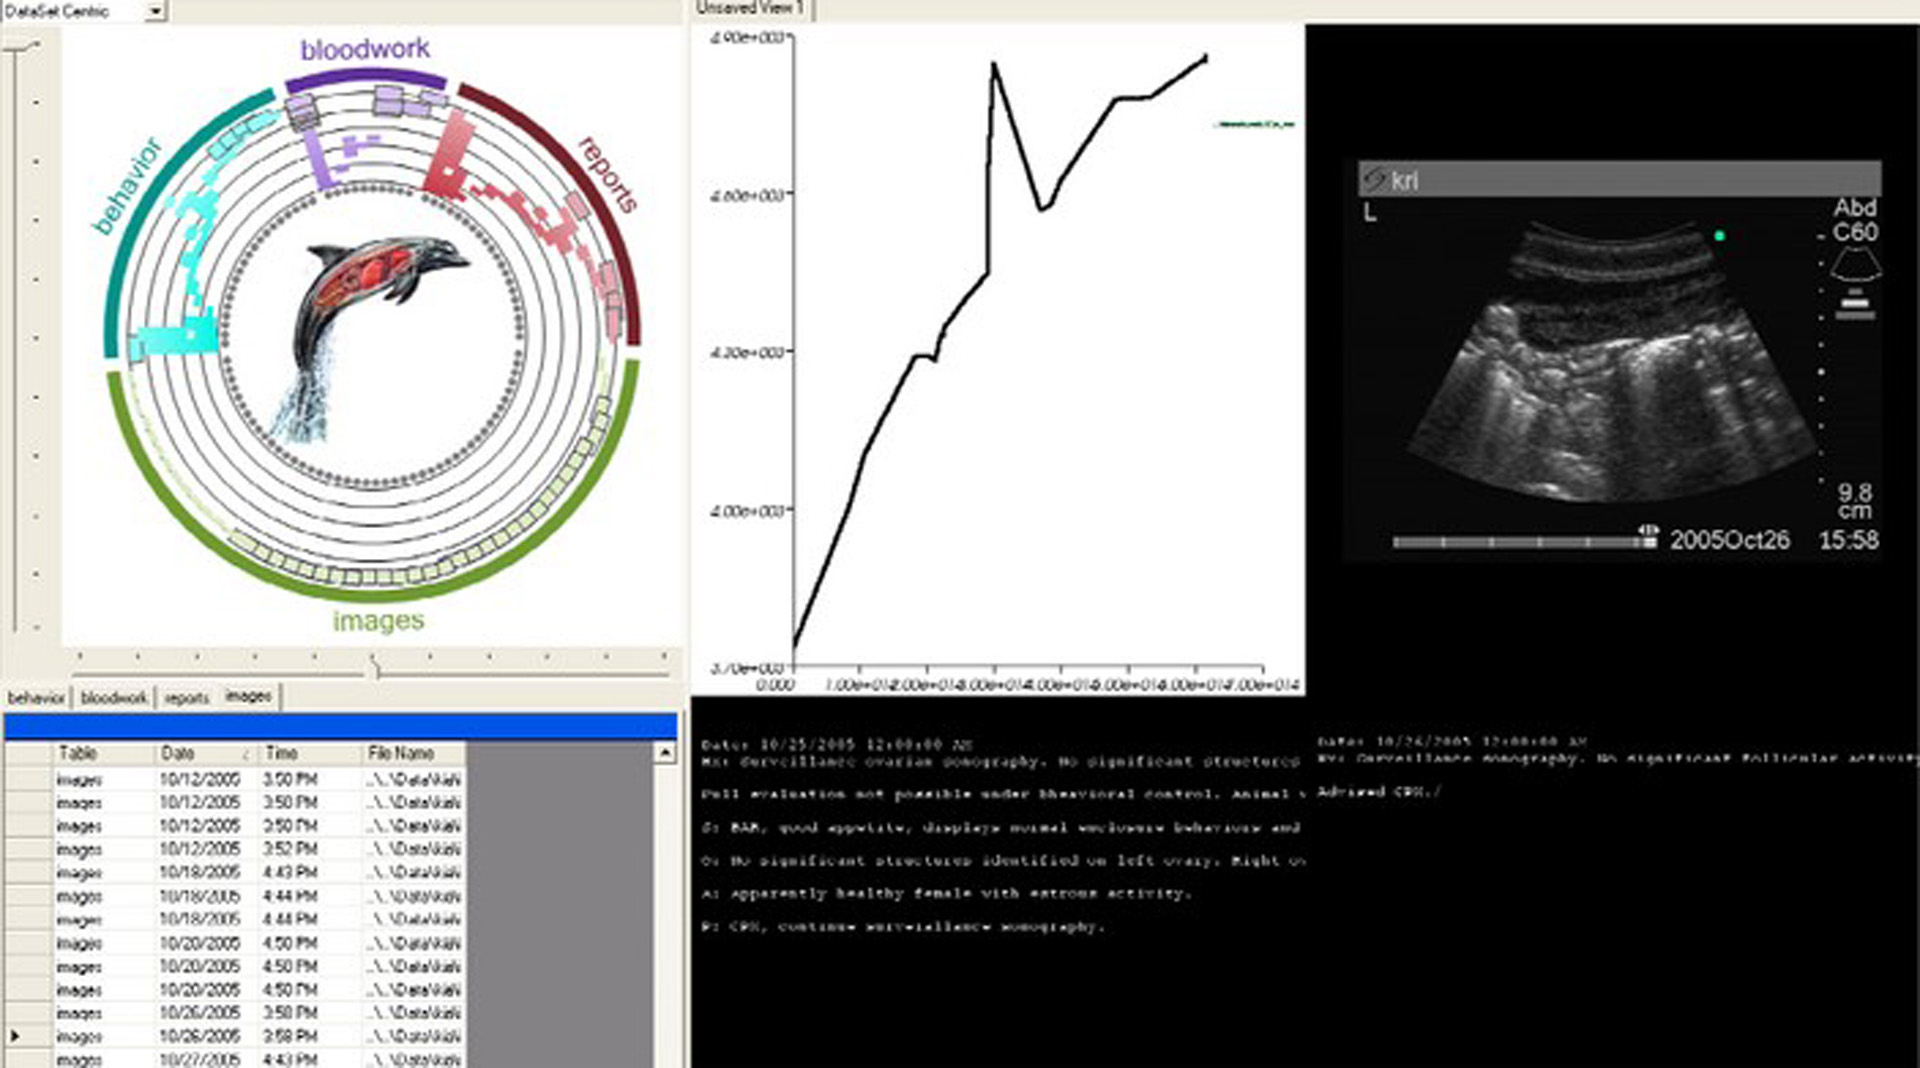
Traditional visualization methods often focus on a single data modality, addressing either spatial or abstract data, but rarely sup- porting both data types. However, many applications require analysis of a variety of data types to fuel decisions. The medical com- munity, for example, uses multimodal datasets such as imaging, bloodwork, medication history, and medical reports simultaneously in the decision-making process. Currently each type of data is ac- cessed and viewed separately, a process that can leave doctors with a fragmented perspective of their patients’ situation. Our system addresses the challenge of merging multiple visualization paradigms into an integrated solution, recently cited as a core research problem in visualization [2004]. Another problem facing the visualization community is how to make results both repeatable and accessible. Generally, visual- ization methods store their viewing parameters implicitly, mak- ing it difficult to share or repeat a given technique. Our environ- ment tracks which visualization methods are used, the data sources, and the parameter mappings for each viewing context. This metadata is stored as header information and can be reloaded to recreate the original visualization context. An internal ontology establishes mappings between data and visualization methods to facili- tate workflow and user interaction.
References:
1. Gennari, J. H., Musen, M. A., Fergerson, R. W., Grosso, W. E., Crubézy, M., Eriksson, H., Noy, N. F., and Tu, S. W. 2003. The evolution of protégé: an environment for knowledge-based systems development. Int. J. Hum.-Comput. Stud. 58, 1, 89–123.
2. Johnson, C. 2004. Top scientific visualization research problems. IEEE Computer Graphics and Applications 24, 4, 13–17.
3. Livnat, Y., Agutter, J., Moon, S., and Foresti, S. 2005. Visual correlation for situational awareness. In INFOVIS ’05: Proceedings of the 2005 IEEE Symposium on Information Visualization, IEEE Computer Society, Washington, DC, USA, 95–102.