“sensingChair” by Tan
Conference:
Experience Type(s):
E-Tech Type(s):
Title:
- sensingChair
Entry Number: 22
Organizer(s)/Presenter(s):
Collaborator(s):
Description:
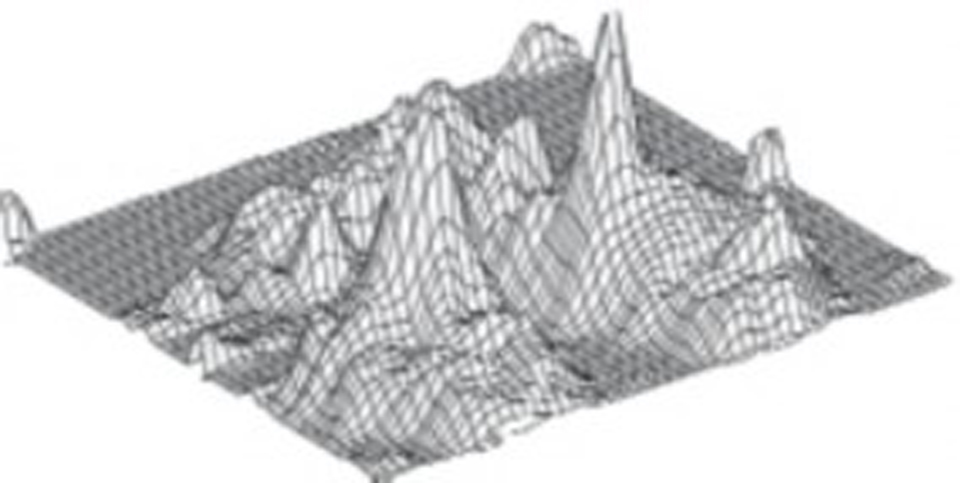
- Visualization of pressure map. As a person moves in the chair, the changing pressure distribution is visualized as terrain with picture, plain terrain profile, and input for a dynamic image.
- Sitting posture classification. A PCA-based static posture classification system labels an occupant’s sitting posture in real time. The output of the classification system is used to select an image that represents someone sitting in a chair with the corresponding posture.
- Chair-driven computer games. The sensingChair is used as an intuitive interface that allows its user to engage in computer games by leaning and shifting weight in the chair. Information derived from pressure readings (for example, center of force) is used to control several PC Electronic Arts games.
The sensingChair introduces a seat that feels its occupant through a layer of “artificial skin.” As a new input device, it opens up new opportunities for human-computer interactions. In an automobile, for example, a sensingChair can detect whether the seat is occupied and estimate the weight and size of its occupant. This information can be used to automatically control the car’s airbag deployment force. In a teleconference scenario, a sensingChair allows users to zoom in on the remote speaker by leaning forward or pan the remote camera by shifting weight to the left or right. In an office environment, a sensingChair can be a posture coach that monitors the sitting postures of its occupants and detects bad habits such as slouching. For interactive graphic displays, a sensingChair allows one to control certain aspects of a graphic display through body movements.
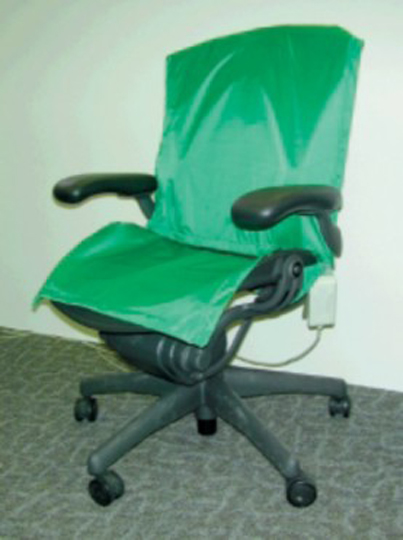
Pressure sensing in the sensingChair is made possible with a commercially available pressure distribution measurement system. Two sensor sheets, placed inside green protective covers, are surface-mounted on the seat and the back rest of an office chair (Figure 1). The data generated by these sheets, in the form of two 42-by-48 8-bit arrays, can be spliced and visualized as a 2D or 3D pressure-distribution map. For example, Figure 2 is a 3D display of the pressure distribution associated with the posture “sitting upright.” The front and back halves of the pressure map correspond to the pressure in the seat and the back rest of the chair, respectively.
The sensing Chair is presented in three scenarios:


