
“VTK-m: Visualization for the Exascale era and Beyond” by Bolstad, Moreland, Rogers, Pugmire, Lo, et al. …
Conference:
Type(s):
Title:
- VTK-m: Visualization for the Exascale era and Beyond
Session/Category Title:
- Byte-Size Geometry; Mathematical Techniques
Presenter(s)/Author(s):
- Mark Bolstad
- Kenneth Moreland
- David Honegger Rogers
- David Pugmire
- Li-Ta Lo
- Berk Geveci
- Hank Childs
- Silvio Rizzi
Interest Area:
- New Technologies and Research / Education
Abstract:
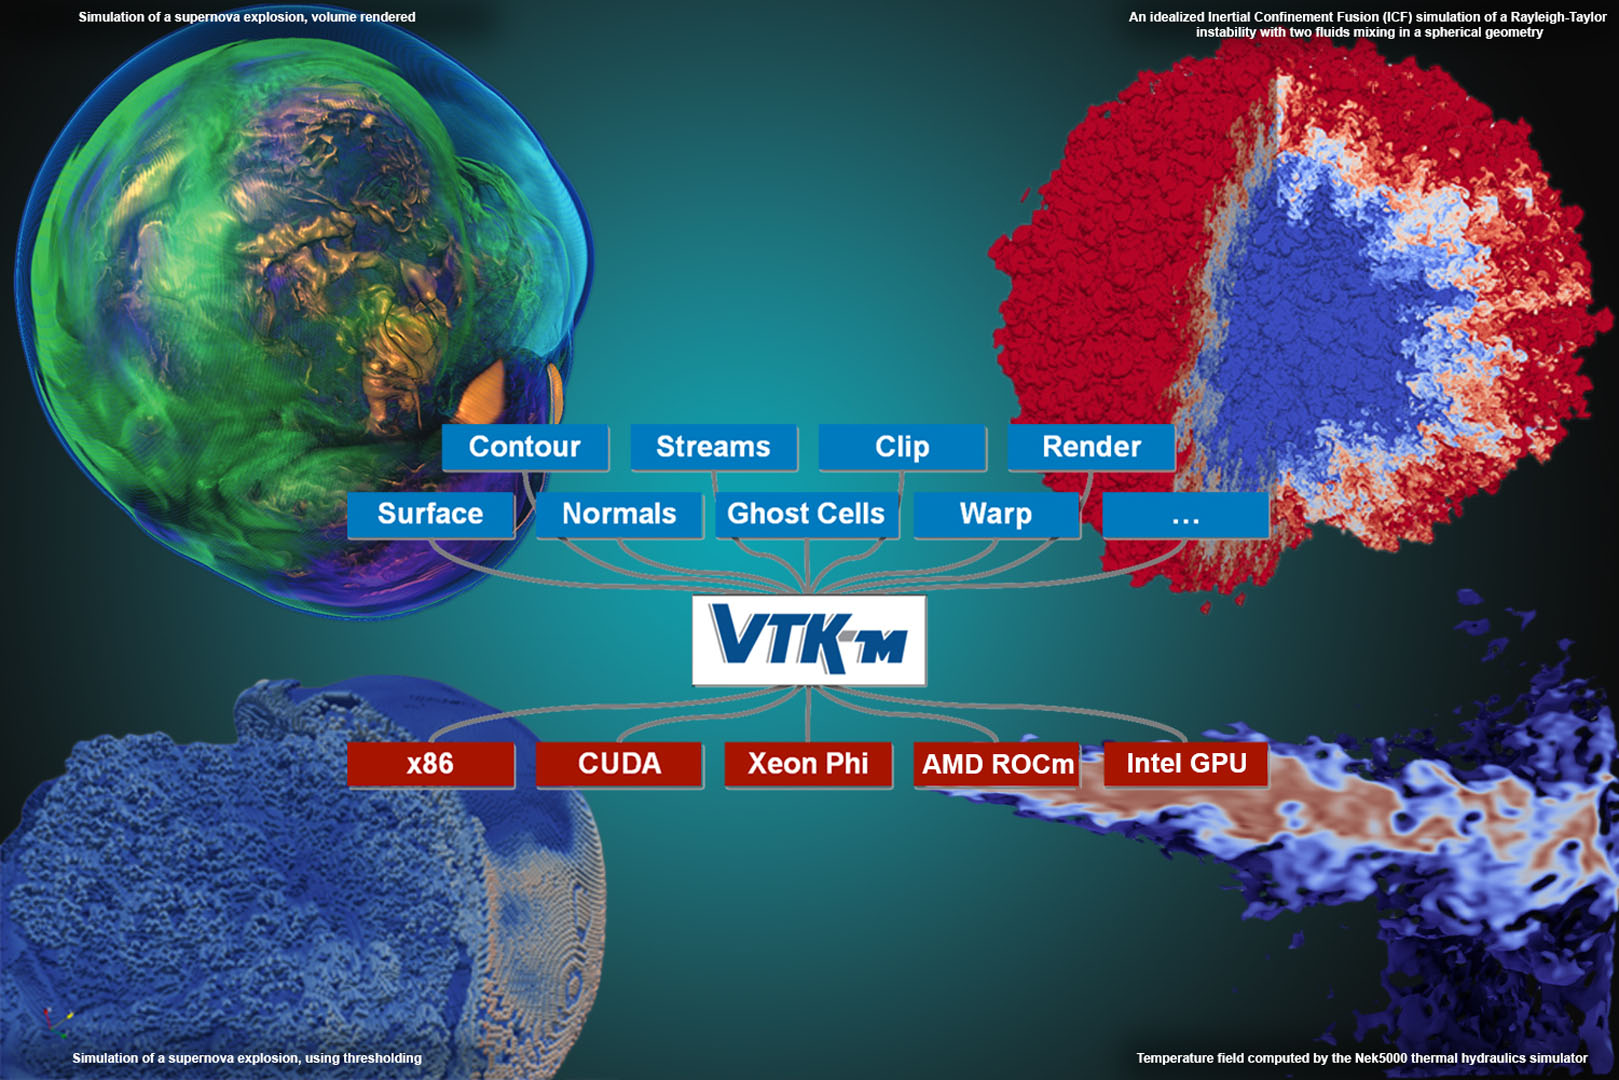
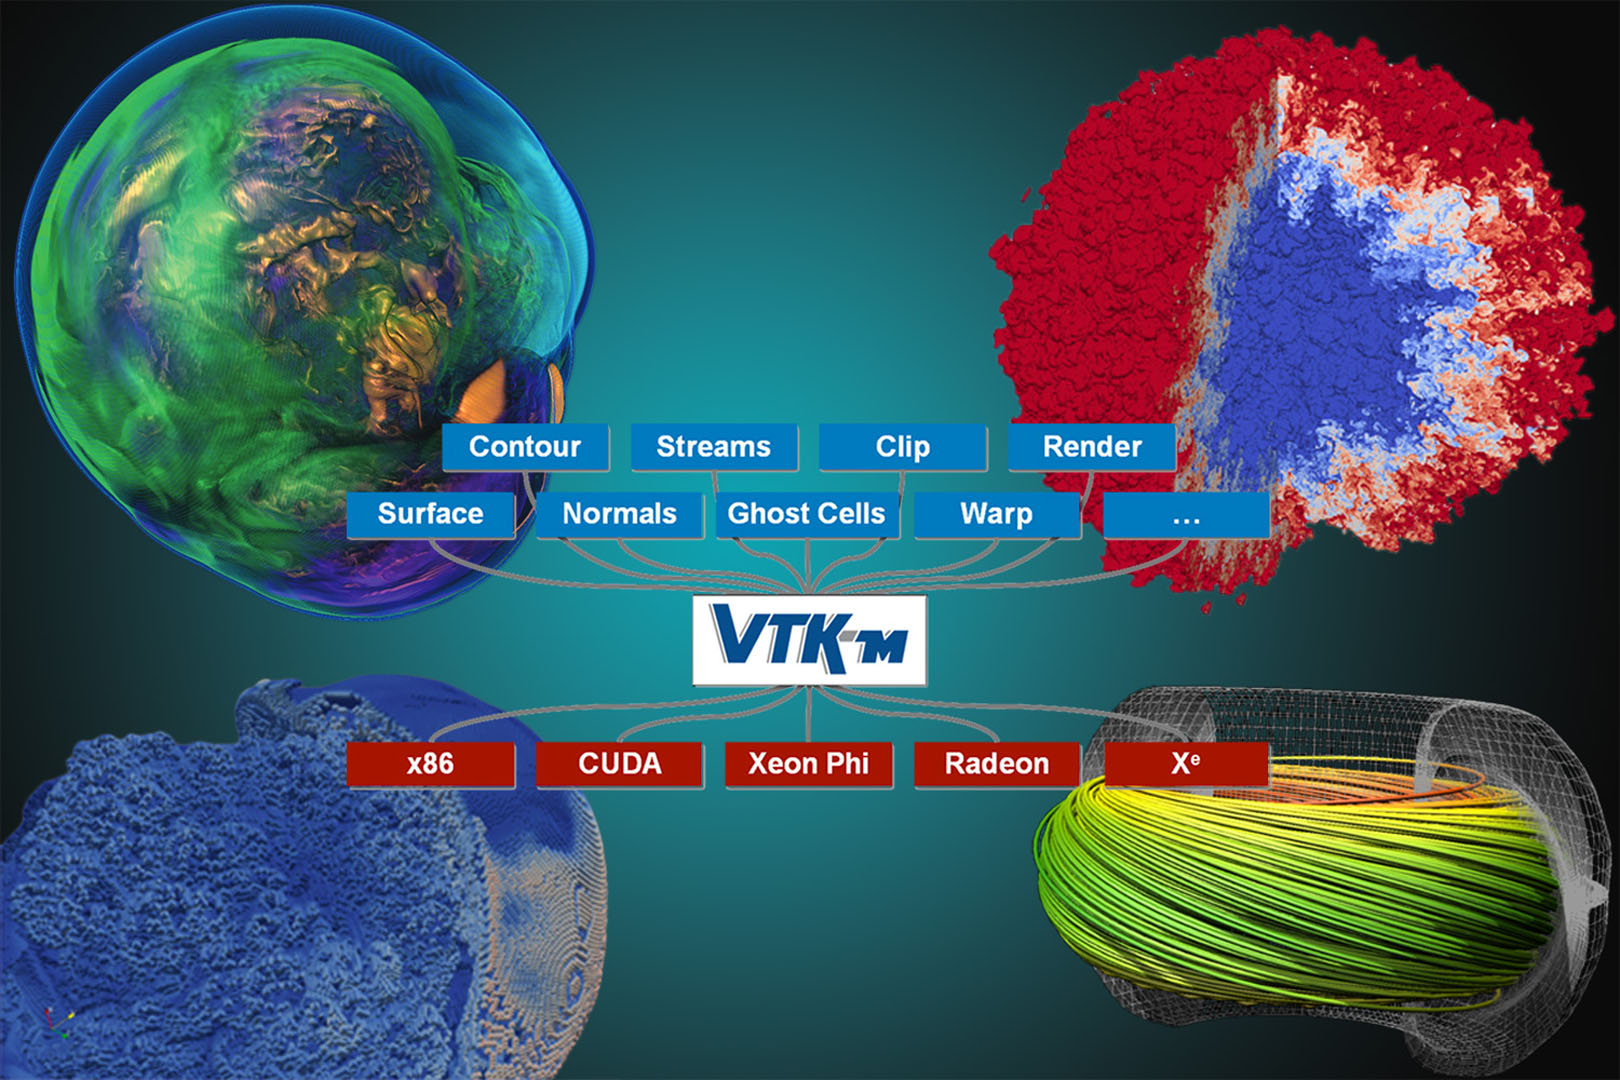
A recent trend in modern high-performance computing is the increasing use of hybrid architectures, where the vast majority of performance comes from accelerators. Modern accelerators are based on Graphics Processing Units (GPU) that contain many low power cores that in their aggregate provides an extremely high computation rate. Current and future CPU processors are requiring more explicit parallelism as each successive version of the hardware packs in more cores, and technologies like hyperthreading and vector operations require even more parallel processing to leverage each core’s full potential. As an example, the Frontier supercomputer installed at Oak Ridge National Laboratories recently hit a record breaking 1.1 exaflops1 on the LINPACK HPC benchmark [Shoemaker 2022]. The system contains 37632 AMD MI250x GPUs which requires more than half a billion threads to keep the system fully utilized [Khizeran 2022]. VTK-m is a toolkit of scientific visualization algorithms for these emerging processor architectures. VTK-m supports the fine-grained concurrency for data analysis and visualization algorithms required to drive extreme scale computing by providing abstract models for data and execution that can be applied to a variety of algorithms across many different processor architectures.
References:
[1] Sean Ahern. 2011. Scientific Discovery at the Exascale: Report from the DOE ASCR 2011 Workshop on Exascale Data Management, Analysis, and Visualization. http://science.energy.gov/ /media/ascr/pdf/program -documents/docs/Exascale-ASCR-Analysis.pdf
[2] Nahren Khizeran. 2022. Hewlett Packard Enterprise ushers in new era with world’s first and fastest exascale supercomputer “Frontier” for the U.S. Department of Energy’s Oak Ridge National Laboratory. https://www.hpe.com/us/en/newsroom/press-release/2022/05/hewlett-packard-enterprise-ushers-in-new-era-with-worlds-first-and-fastest-exascale-supercomputer-frontier-for-the-us-department-of-energys-oak-ridge-national-laboratory.html
[3] Li-ta Lo, Christopher Sewell, and James Ahrens. 2012. PISTON: A Portable Cross-Platform Framework for Data-Parallel Visualization Operators. Procedeeings Eurographics Symposium Parallel Graphics and Visualization (EGPGV) (2012), 11–20.
[4] Jeremy S. Meredith, Sean Ahern, Dave Pugmire, and Robert Sisneros. 2012. EAVL: The Extreme-scale Analysis and Visualization Library. Eurographics Symposium on Parallel Graphics and Visualization (2012).
[5] Kenneth Moreland, Brad King, Robert Maynard, and Kwan-Liu Ma. 2012. Flexible Analysis Software for Emerging Architectures. Proc. SC’12 Companion: High Performance Computing, Networking Storage and Analysis (2012), 821–826.
[6] Kenneth Moreland, Robert Maynard, David Pugmire, Abhishek Yenpure, Allison Vacanti, Matthew Larsen, and Hank Childs. 2021. Minimizing Development Costs for Efficient Many-Core Visualization Using MCD3. Parallel Comput. (2021).
[7] Sara Shoemaker. 2022. Frontier supercomputer debuts as world’s fastest, breaking exascale barrier. https://www.ornl.gov/news/frontier-supercomputer-debuts-worlds-fastest-breaking-exascale-barrier
Additional Images:
-
- 2023 Talks: Bolstad_VTK-m: Visualization for th Exascale era and Beyond
ACM Digital Library Publication:
Overview Page:
Submit a story:
If you would like to submit a story about this presentation, please contact us: historyarchives@siggraph.org