
“Aire – Visualize Air Quality” by Torres and Campbell
Conference:
Experience Type(s):
Title:
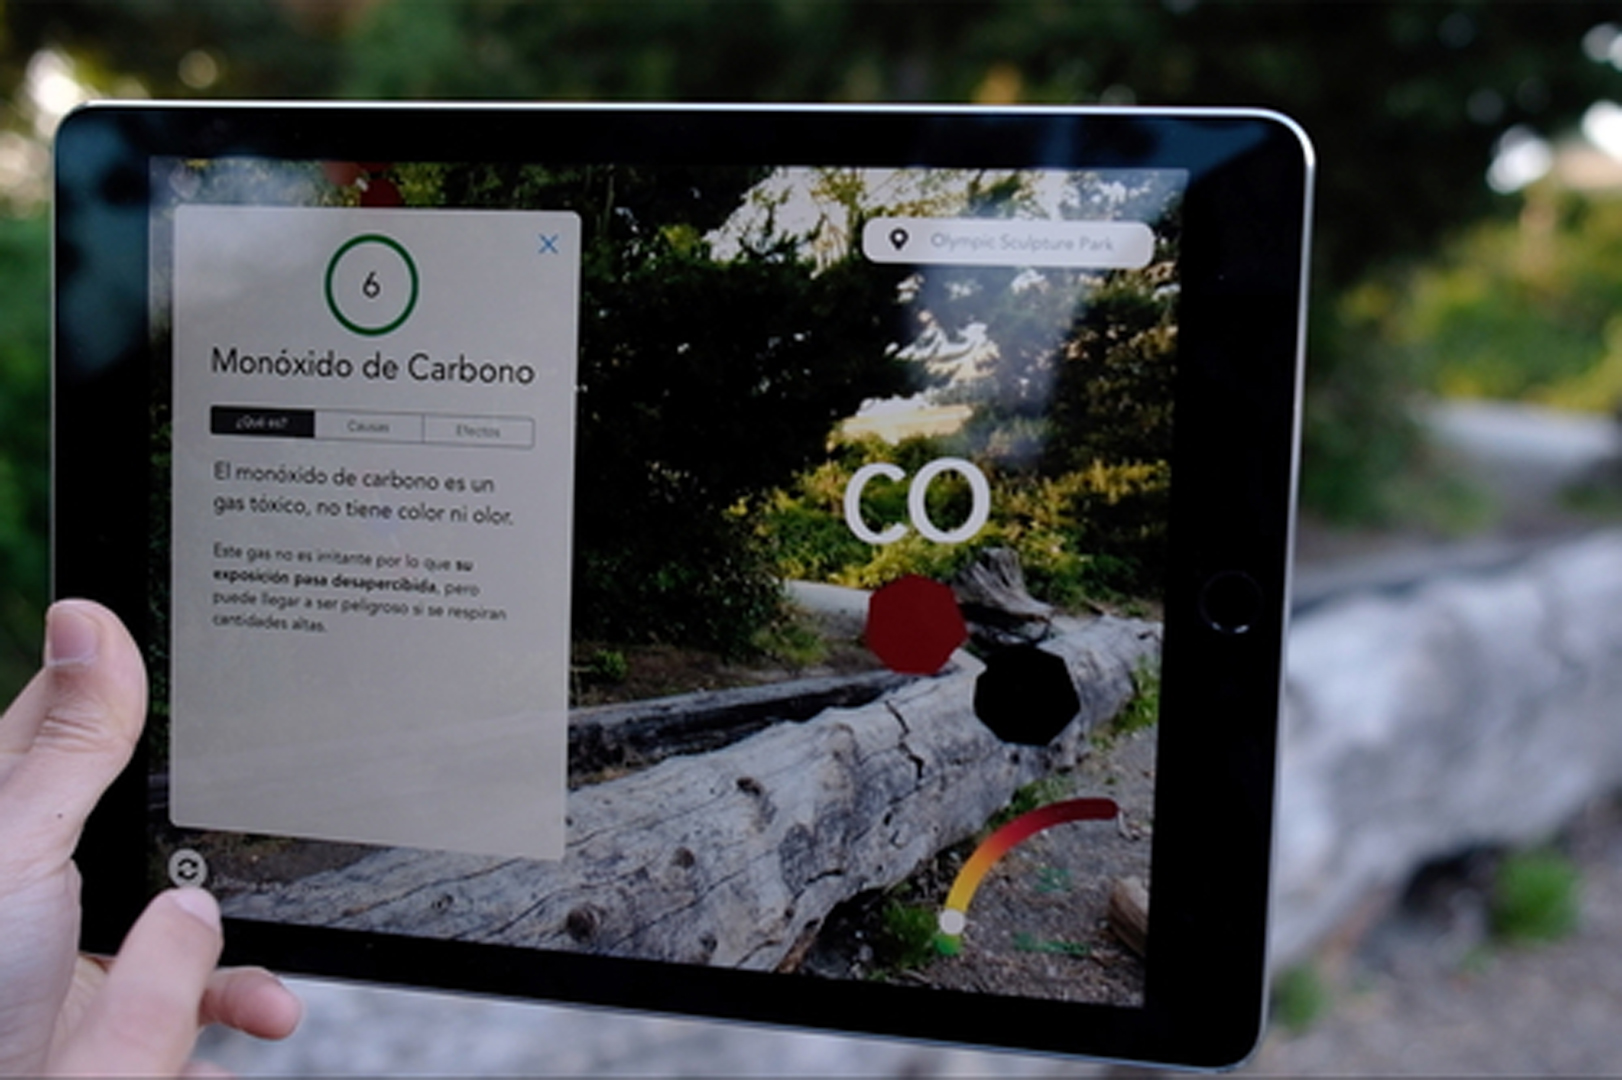
- Aire - Visualize Air Quality
Developer(s):
Project Affiliation:
- Quimera Verde
Description:
Visualize air pollution around you and learn about which pollutants exist in your surroundings, how they are generated, and their effects on your health and the environment. Immerse yourself in the air quality from your location to anywhere in the world.
ACM Digital Library Publication:
Overview Page:
Submit a story:
If you would like to submit a story about this experience or presentation, please contact us: historyarchives@siggraph.org