“1991 Stereo Slide Set”, 1991
Title:
- 1991 Stereo Slide Set
Year:
- 1991
Conference:
Description:
SIGGRAPH ’91 Stereoscopic Slide Set Credits
Edited by Eric Bosch
SIGGRAPH ’91 Slide Sets Chair
and Diana Tuggle
SIGGRAPH Visual Image Editor
The stereoscopic slide set has 78 slides, two each of 39 images. One slide of each image is printed here in black and white to facilitate locating information about the images. The full color 35mm slide set can be ordered from: ACM order department, P.O. Box 64145, Baltimore, MD 21264; 1-800-342-6626. The ACM order number for the SIGGRAPH ’91 stereoscopic slide set is 915912. The cost is $44 for members; $55 for non-members.
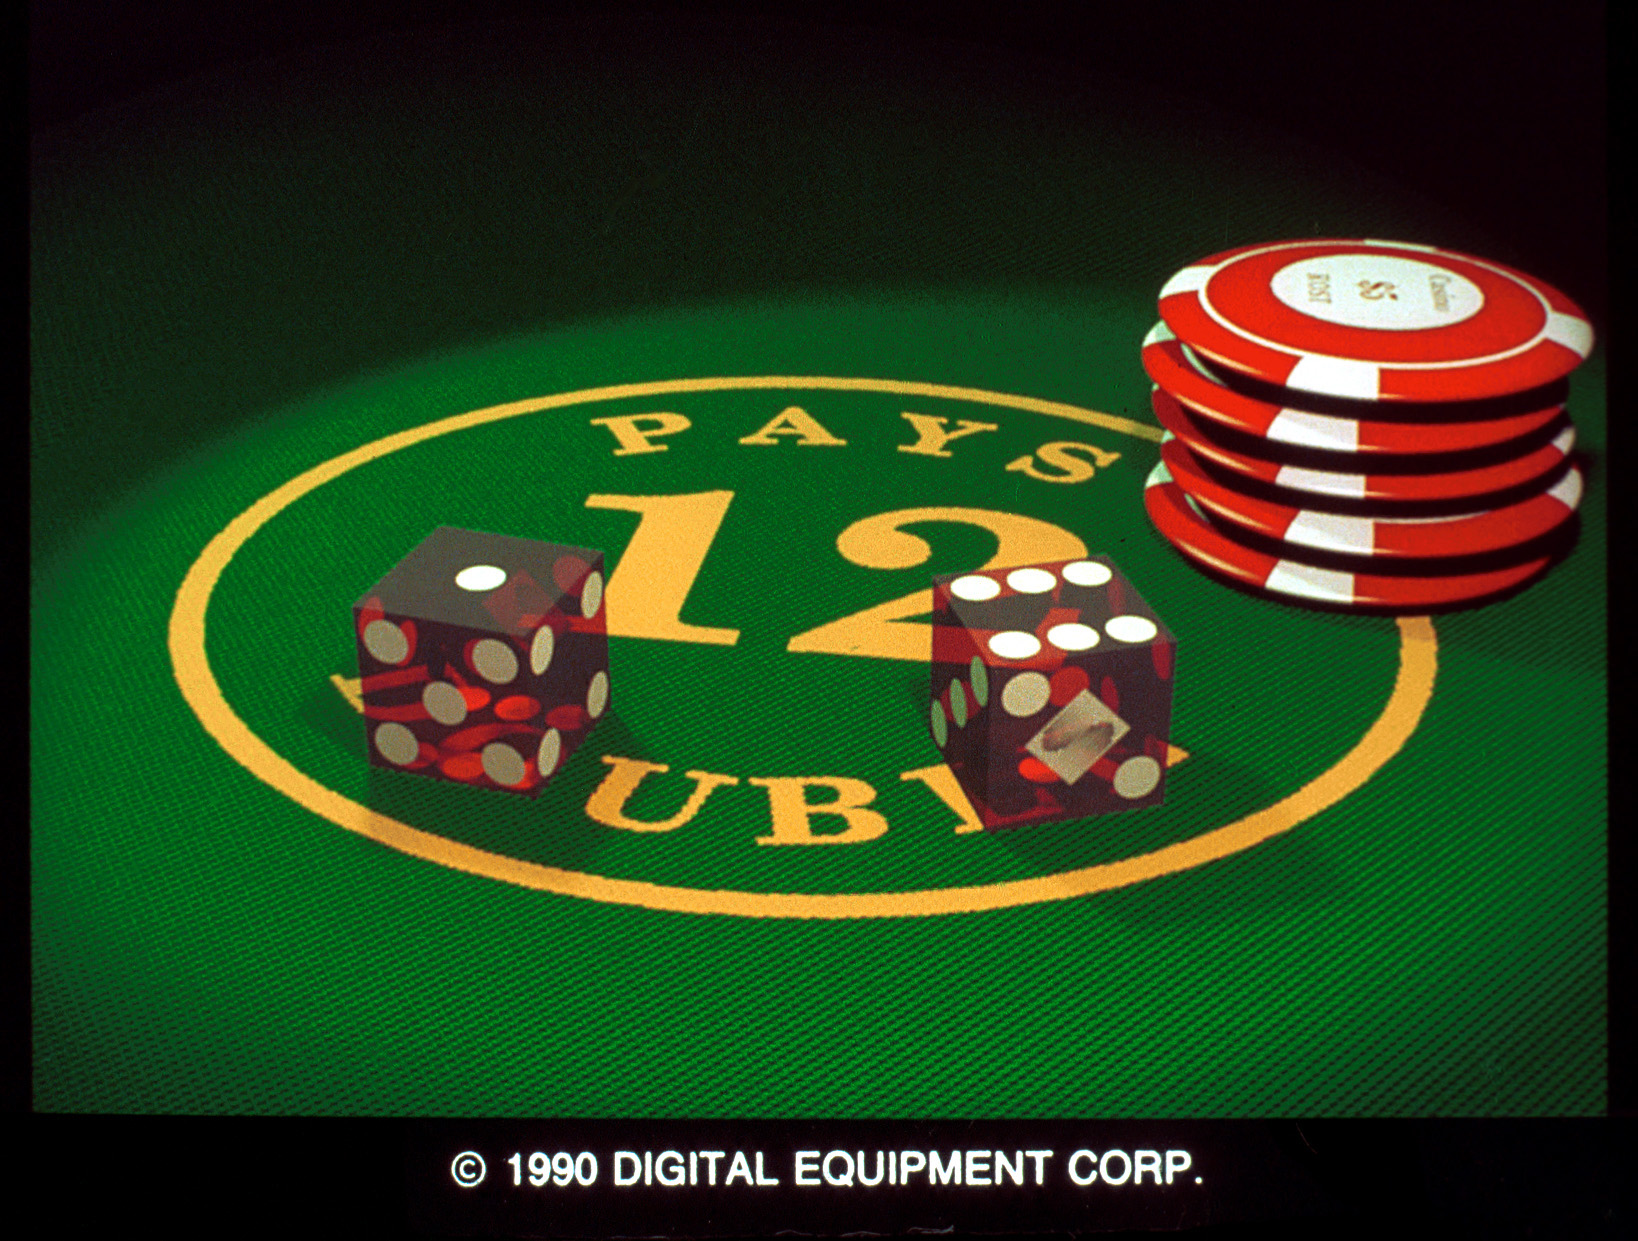
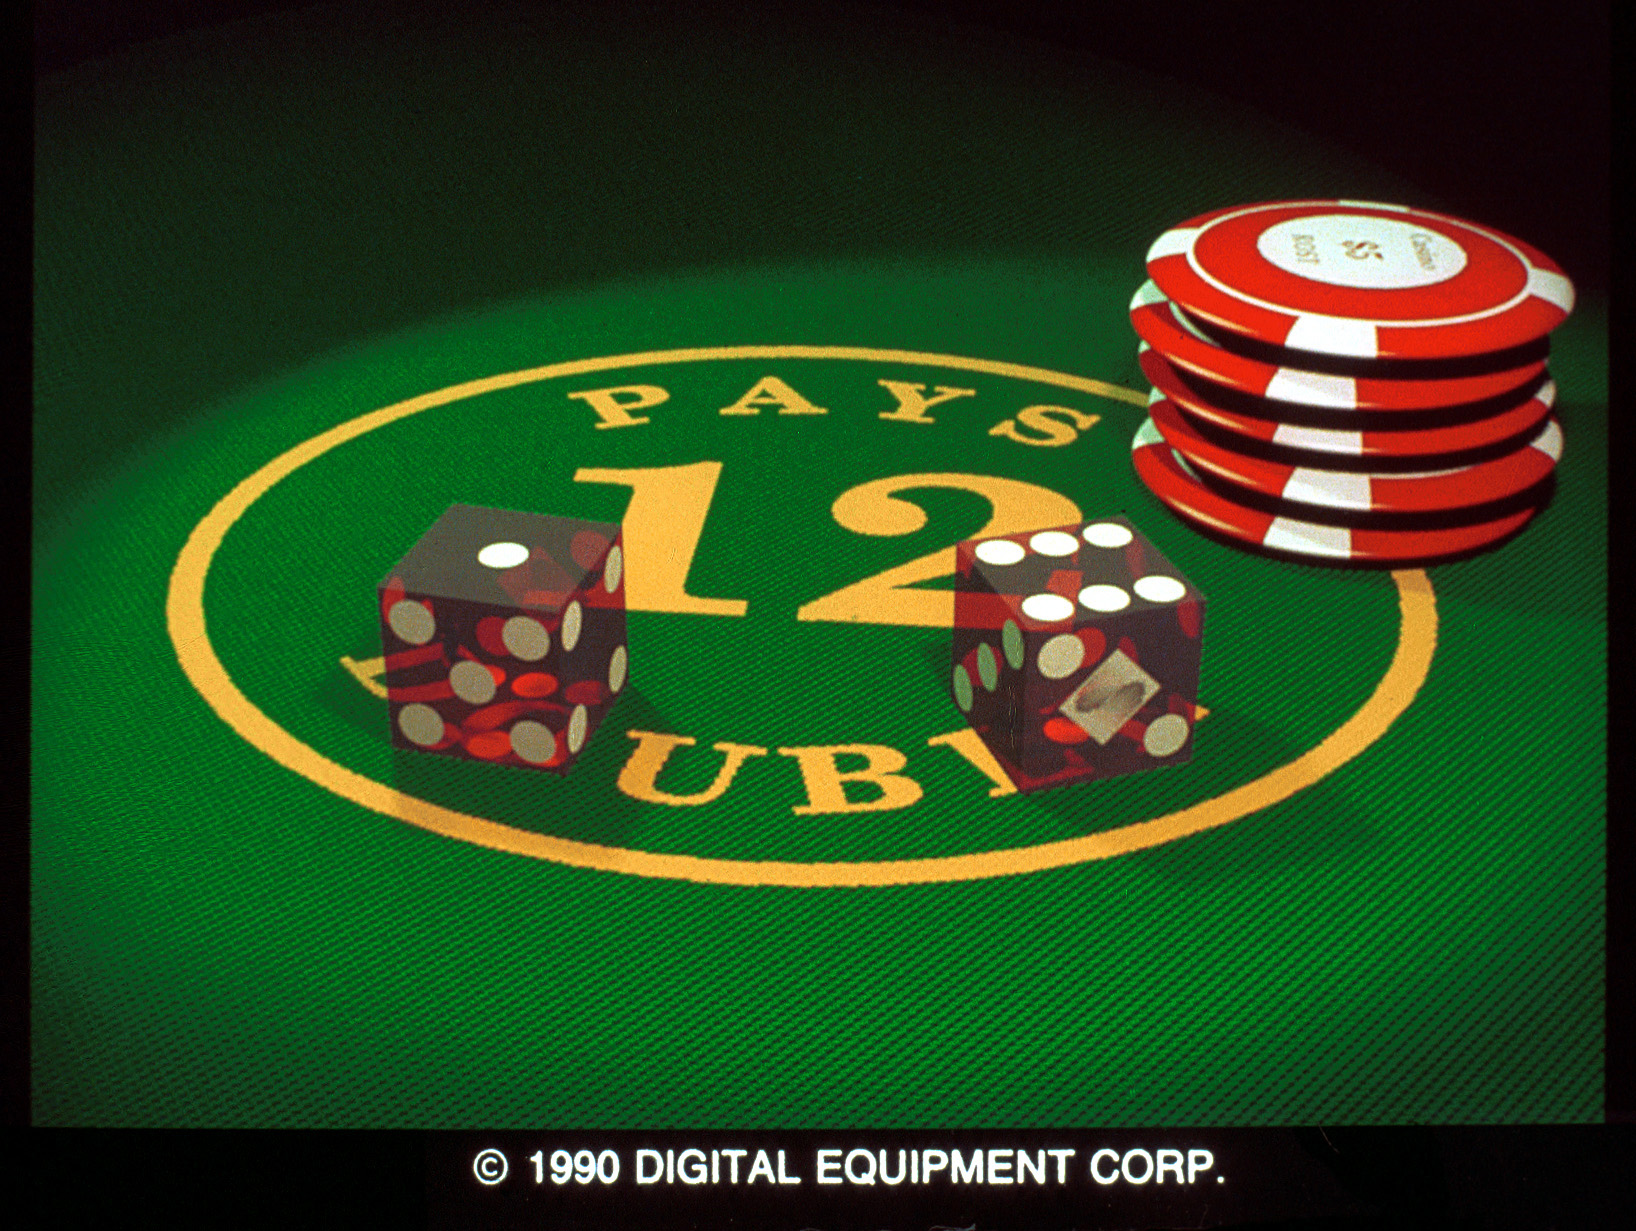
1 &2. Flush-Spot Dice (Stereo-scopic Version) by Randi J. Rost. This stereo pair demonstrates some of the capabilities of the ZZ-buffer algorithm. It contains only 14 polygons and five ellipsoids. The six faces of each die contribute 12 of the polygons; a large texture-mapped polygon is used to represent a portion of the surface of the craps table, and a small polygon rests on the top ellipsoid in order to have a flat surface for texturing the ”Casino – $5 – Rost” logo. Each side of a die is textured using a bitmap that modulates both color and opacity. Antialiasing and shadows with real penumbrae are supported through the use of stochastic sampling. They were created on a DECstation 5000/2000 and Matrix QCR- Z film recorder using a ZZ-buffer algorithm. Contact: Randi J. Rost, Digital Equipment Corp., 100 Hamilton Ave., Palo Alto, CA 94301; (415) 853-6721.
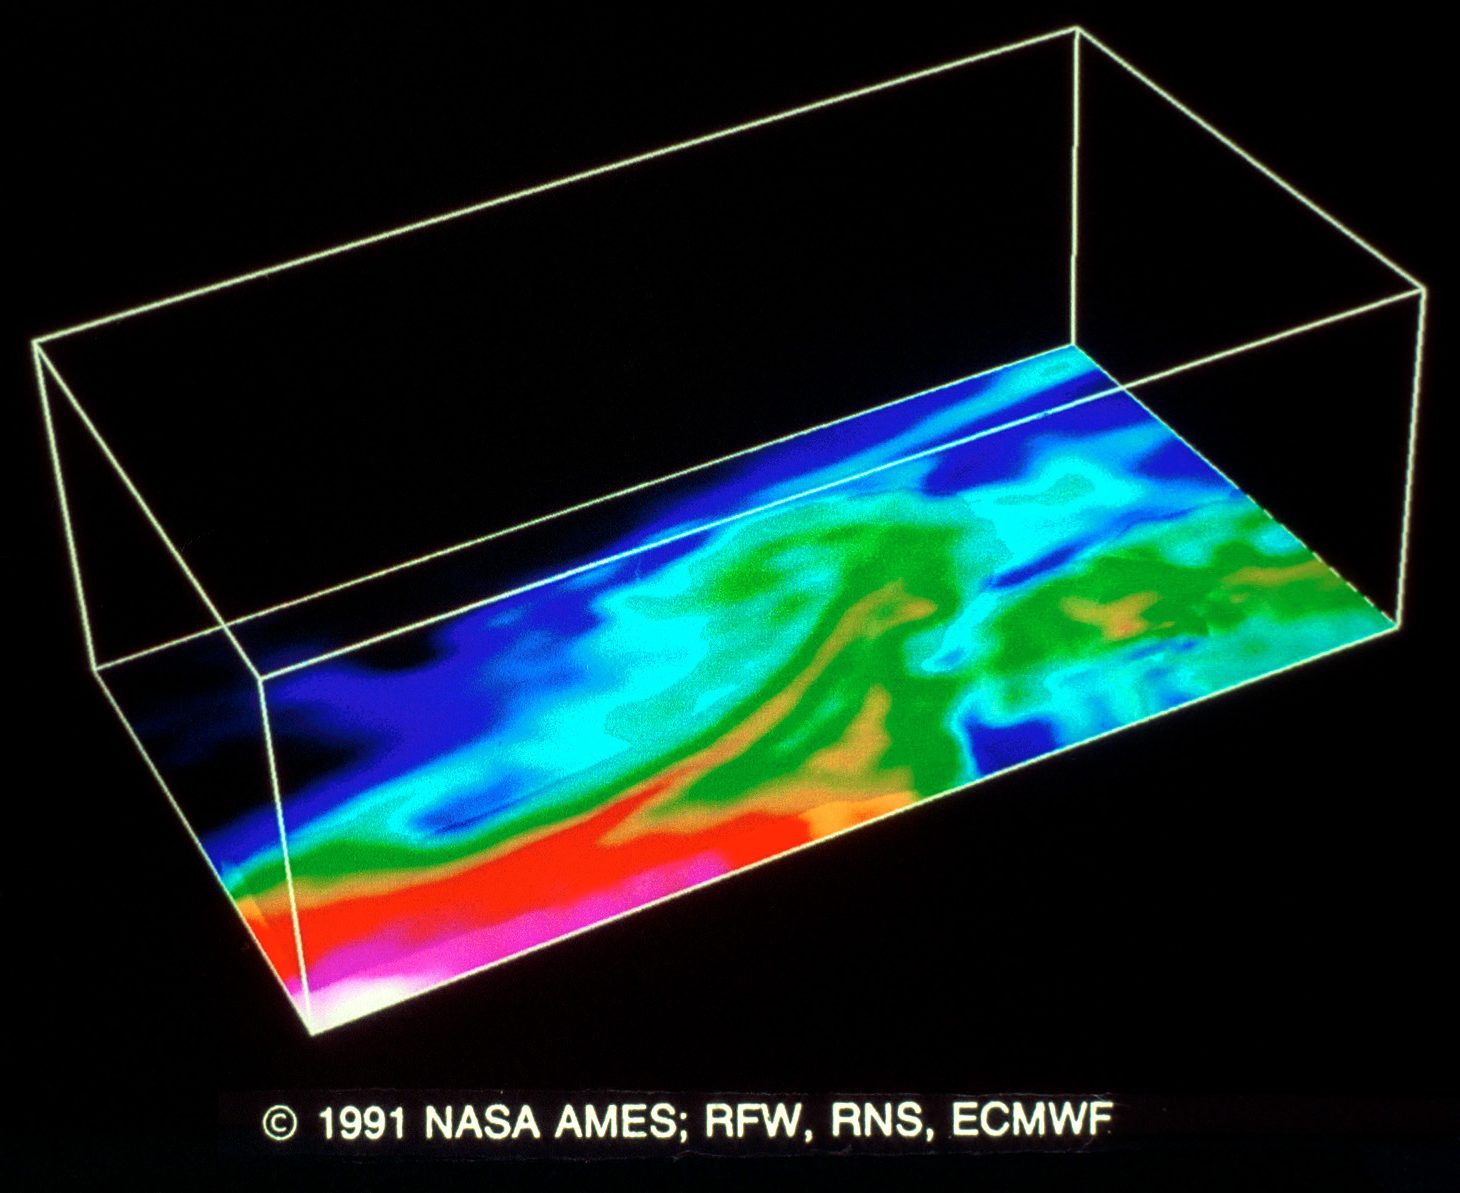
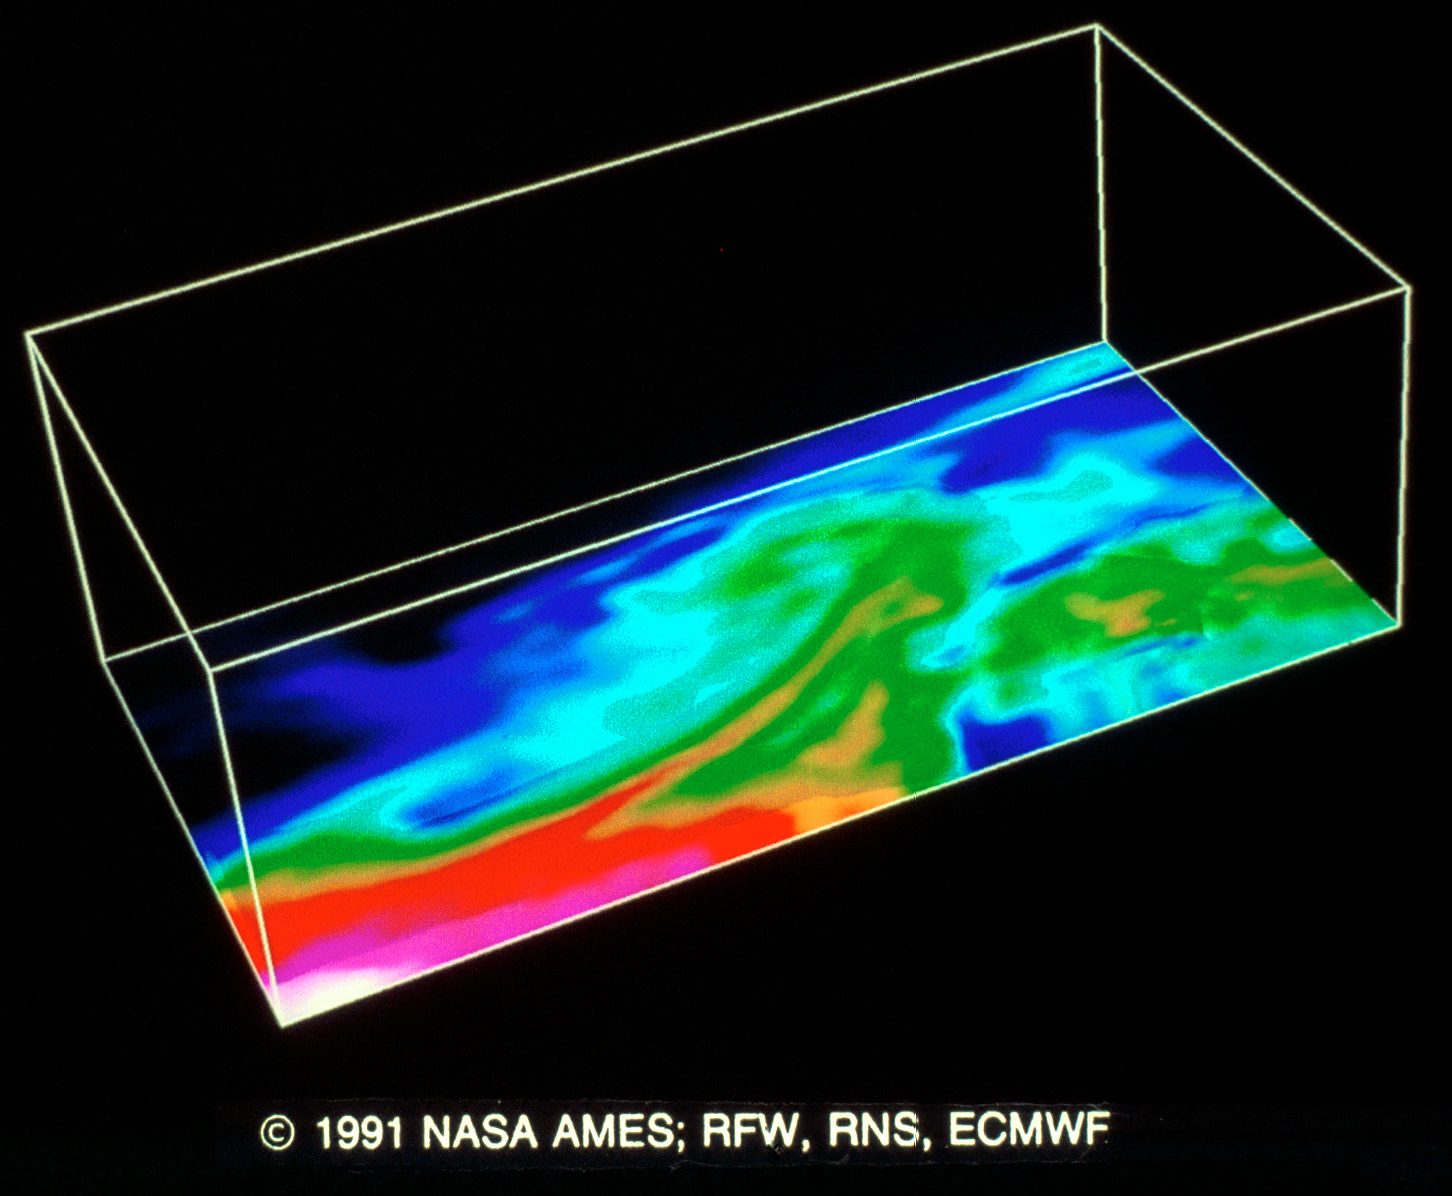
3&4. Water Vapor Field of a Winter Storm by Philip C. Chen, Vee Collet. This stereo pair shows a water vapor field of a winter storm over the Atlantic ocean in February 1988. The data were obtained by numerical simulation. They were created on a SGI 320VGX using Flow Analysis Software Took Kit. Contact: Vee Collet, Sterling Software at NASA Ames, MS 258-2, Moffett Field, CA 94035; ( 415) 604-4450.
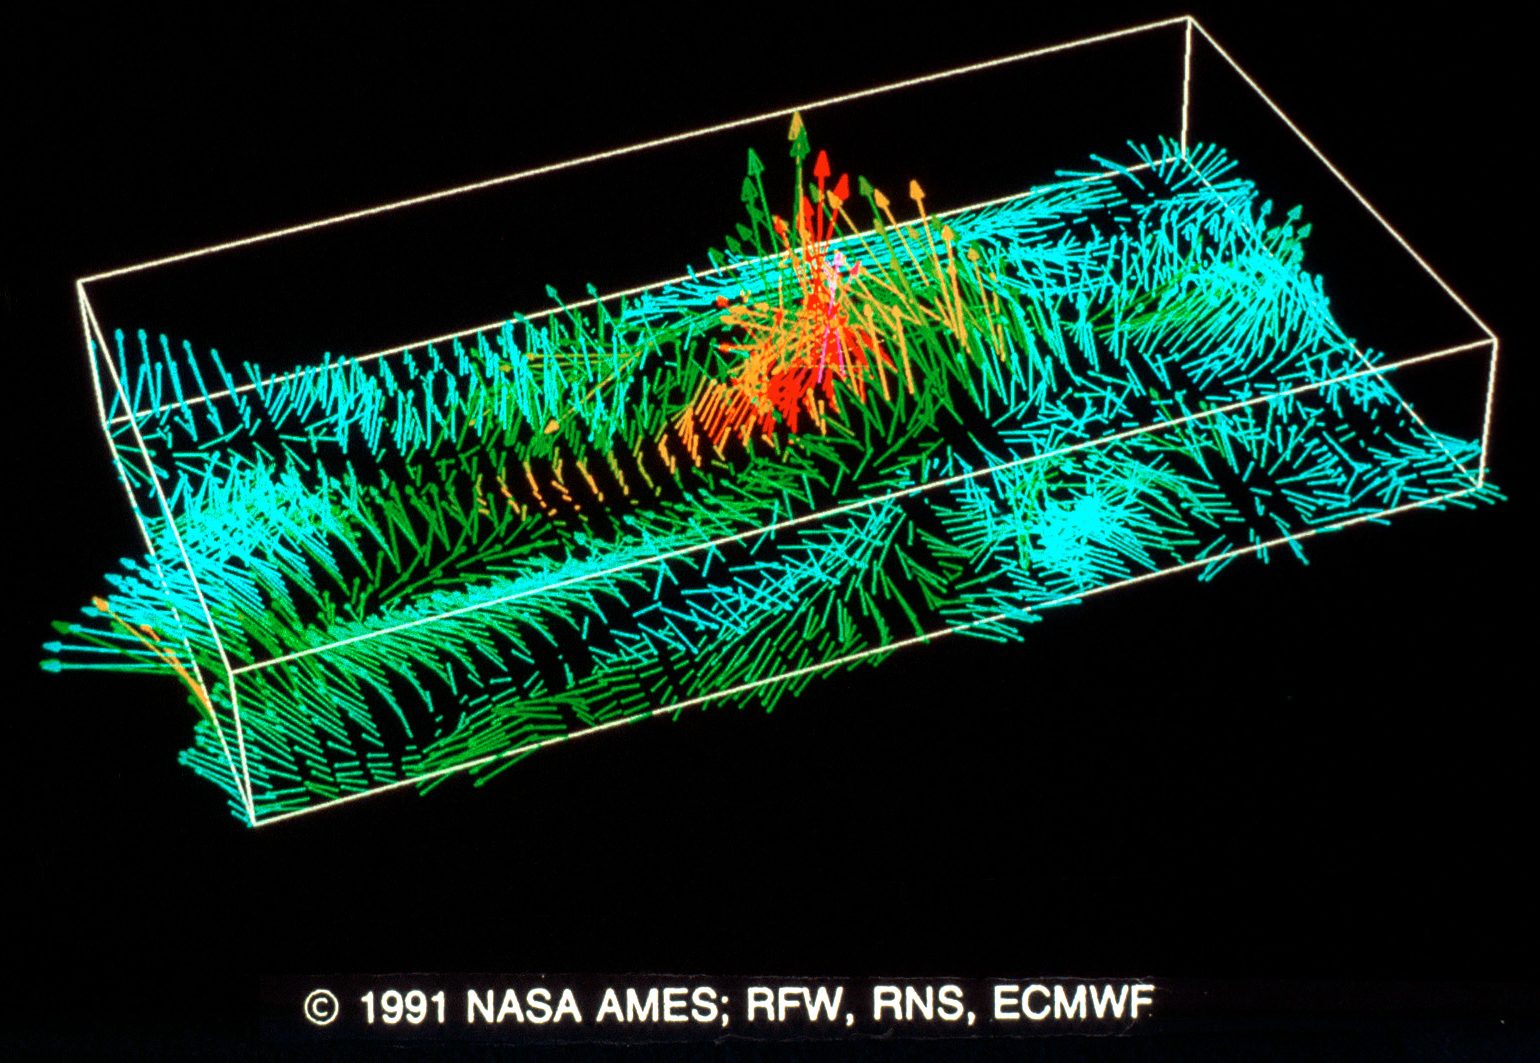
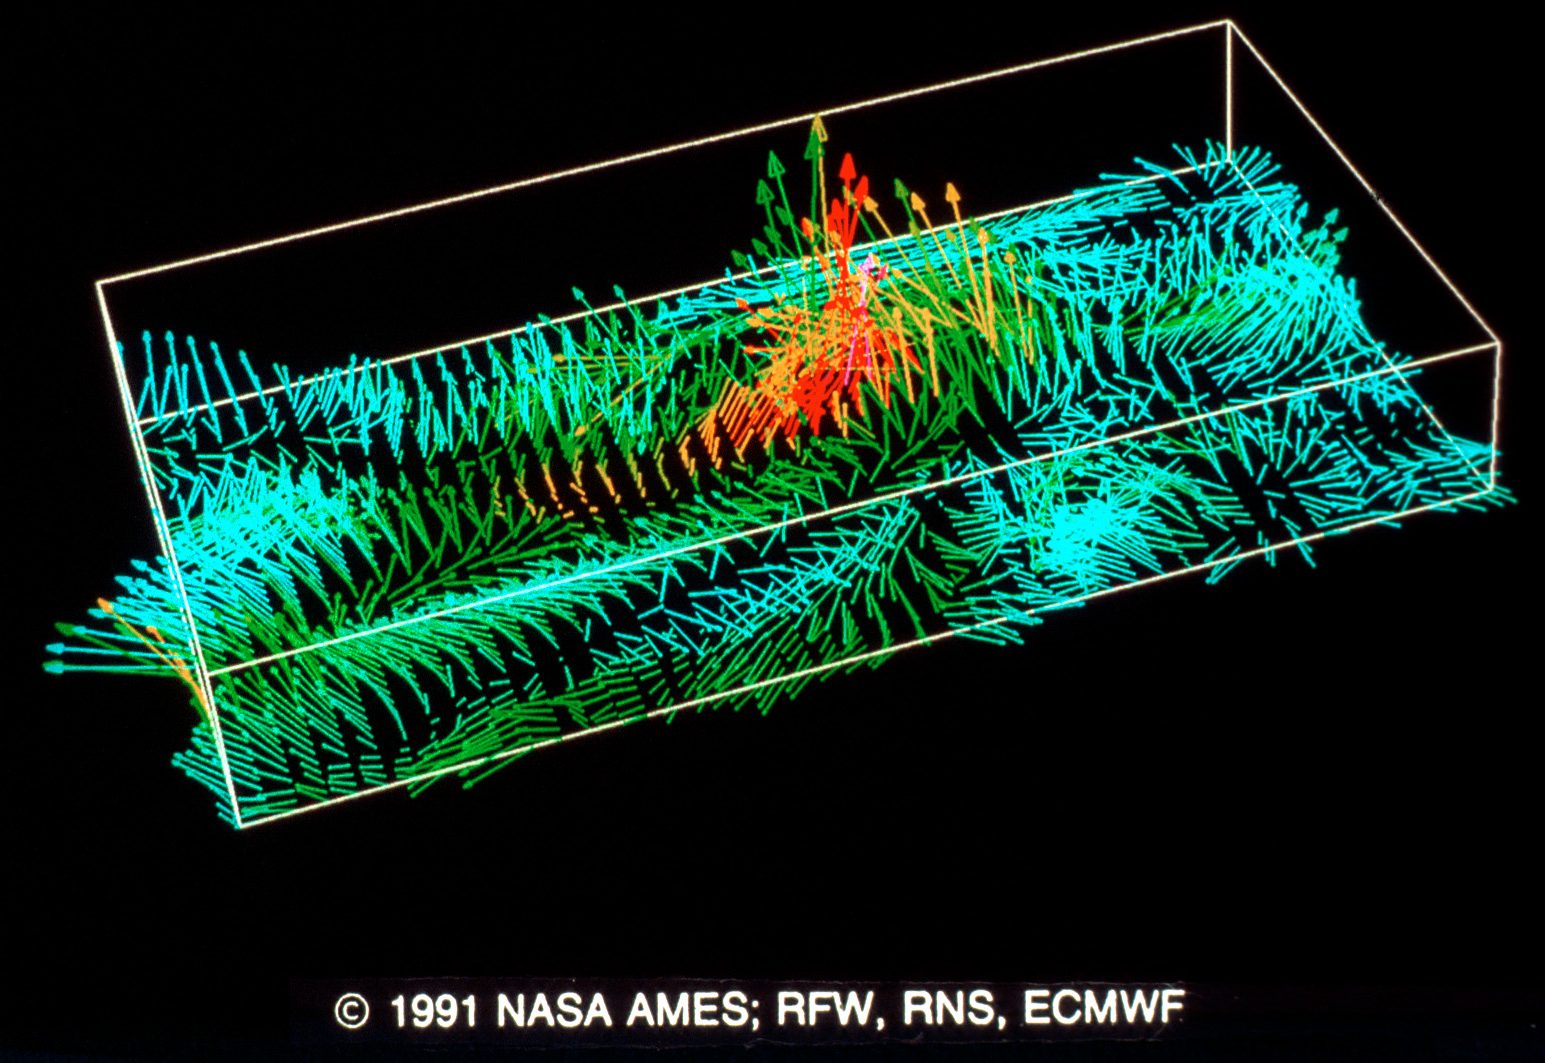
5&6. Velocity Vector Field of a Winter Storm by Philip C. Chen, Vee Collet. This stereo pair illustrates a velocity vector field of a winter storm over the Atlantic ocean in February 1988. The data were obtained by numerical simulation. They were created on a SGI 320VGX using Flow Analysis Software Took Kit. Contact: Vee Collet, Sterling Software at NASA Ames, MS 258-2, Moffett Field, CA 94035; (415) 604-4450.
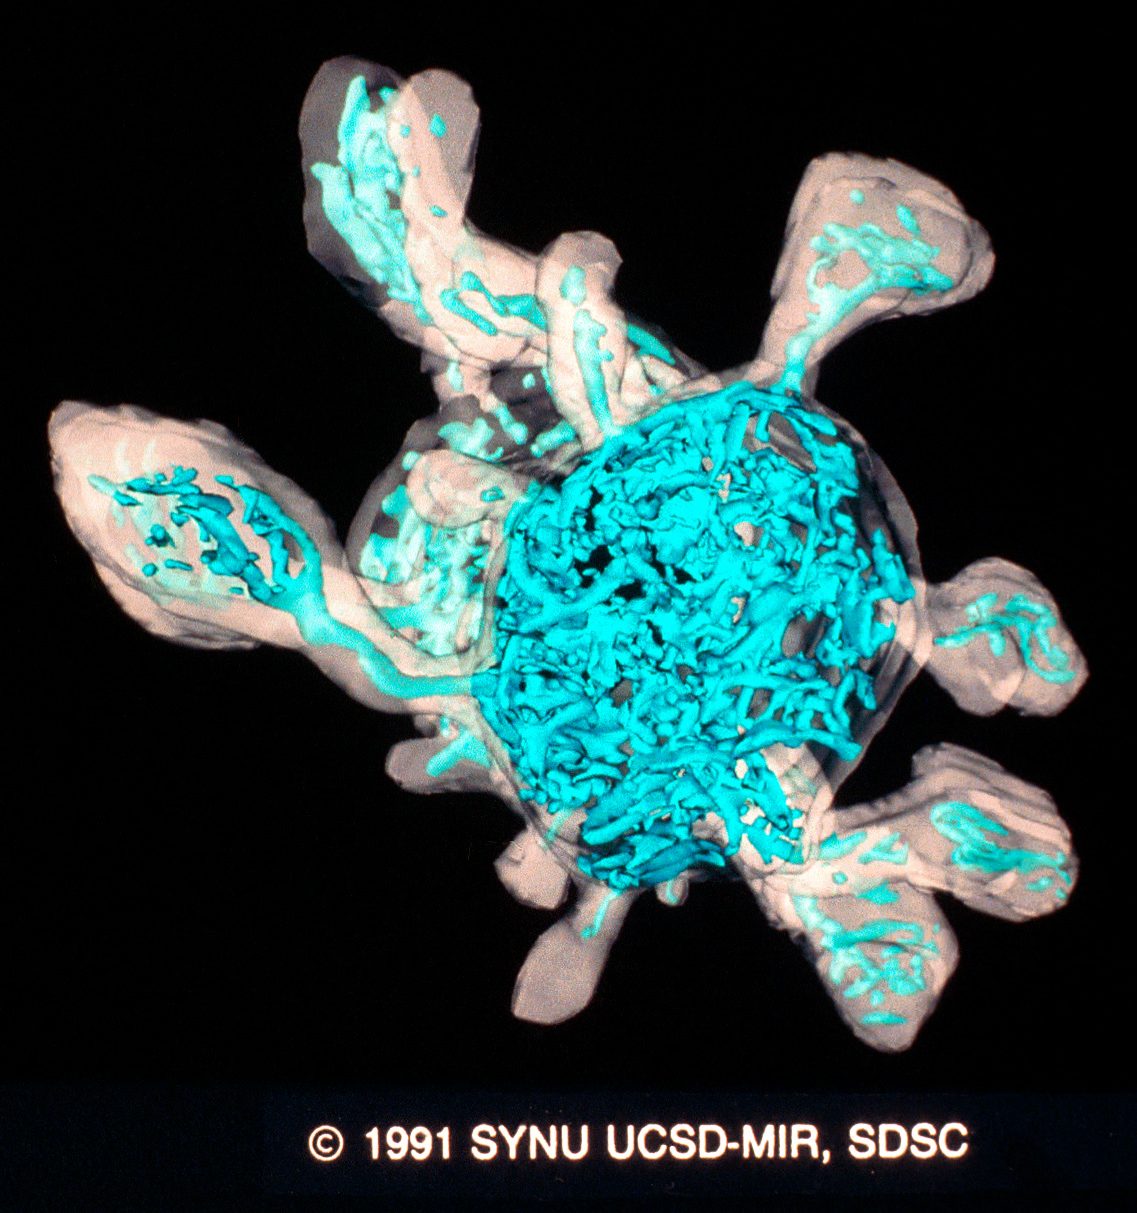
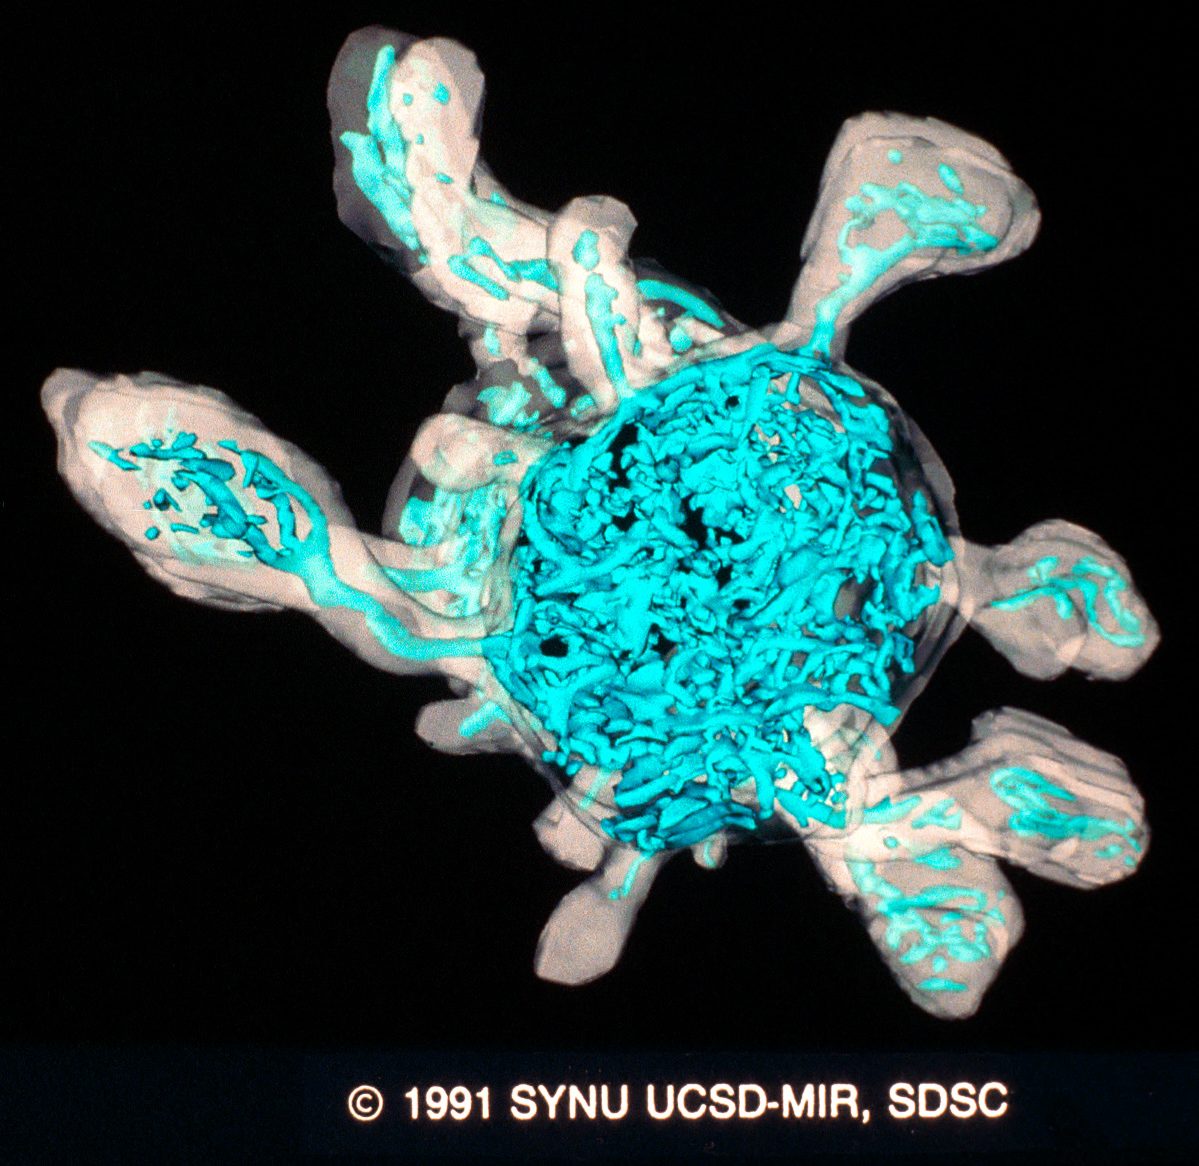
7&8. Intracellular Membrane System of Purkinje Neuron by David F. Hessler, David T. Scheeff, Maryann E. Martone, Ying Zhang, Steven J. Young, Mark H. Ellisman. This stereo pair is of the intracellular membrane system (blue) of a 2.5 micron thick slice of a Purkinje- neuron dendrite. The images were created on a Cray YMP, SGI 4D/210 VGX and IBM compatible PC using SYNU (synthetic universes renderer) and HVEM-3D. Contact: David F. Hessler, Department of Neurosciences, M-008, University of California at San Diego, La Jolla, CA 92093-0608; (619) 534-1392.
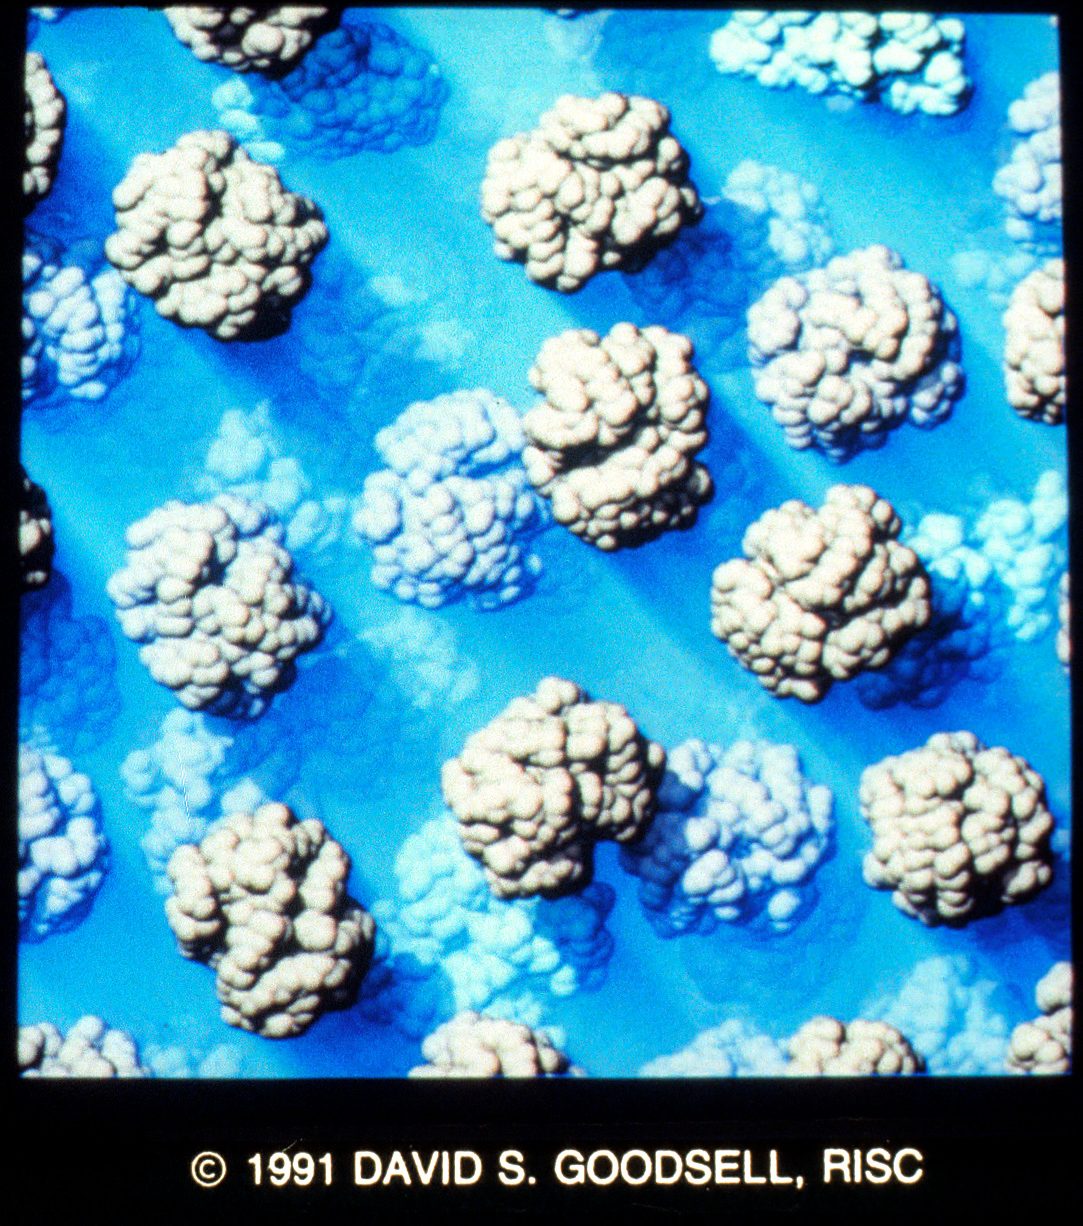
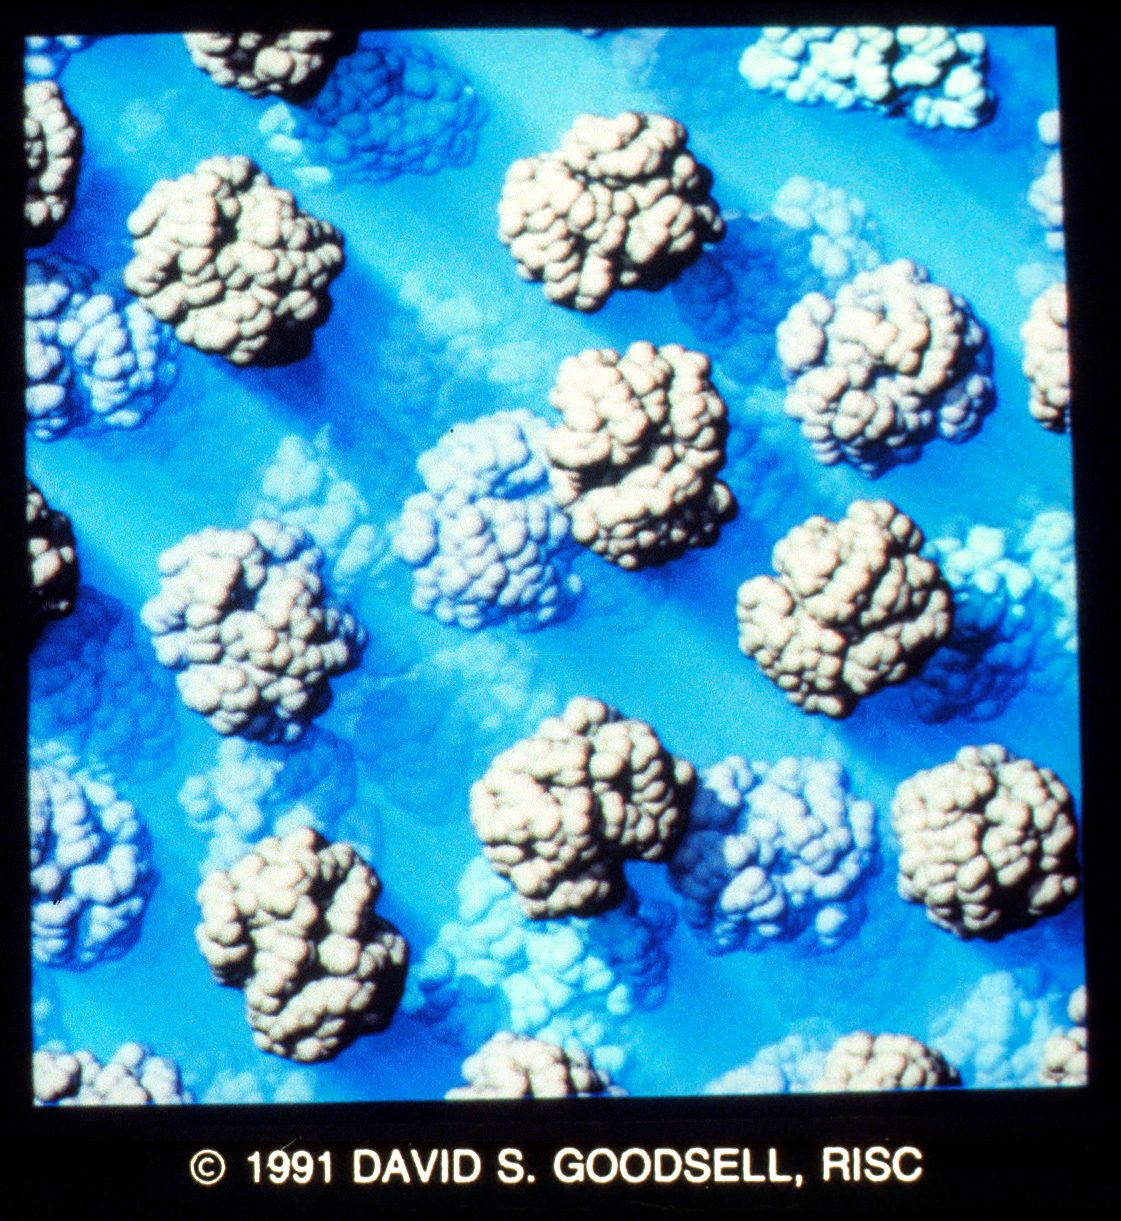
9&10. Inside a Red Blood Cell by David S. Goodsell. A 400 A window inside a red blood cell shows the dense packing of hemoglobin molecules. The images combine volumetric and procedural objects, with self consistent cast shadows. They were created on a Convex C240 using in-house volume rendering software. Contact: David S. Goodsell, Research Institute of Scripps Clinic, 10666 N. Torrey Pines Road MB5, La Jolla, CA 92037; (619) 554-4392.
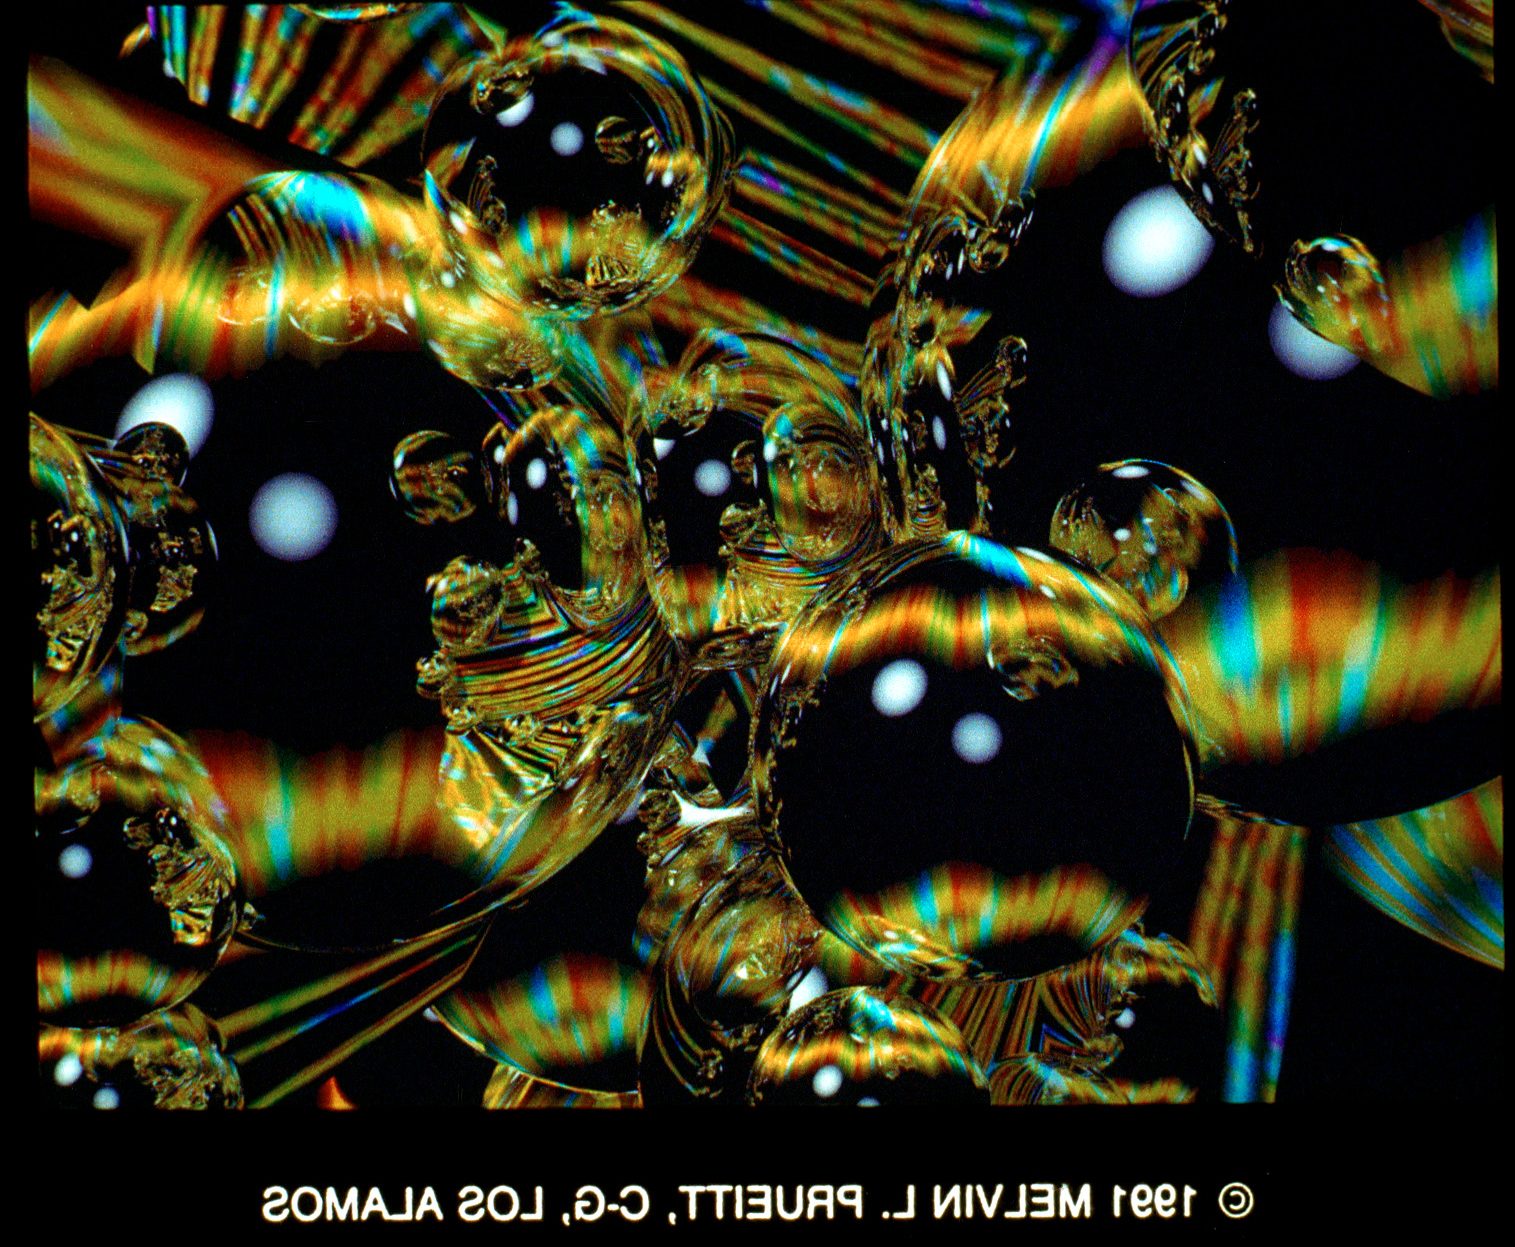
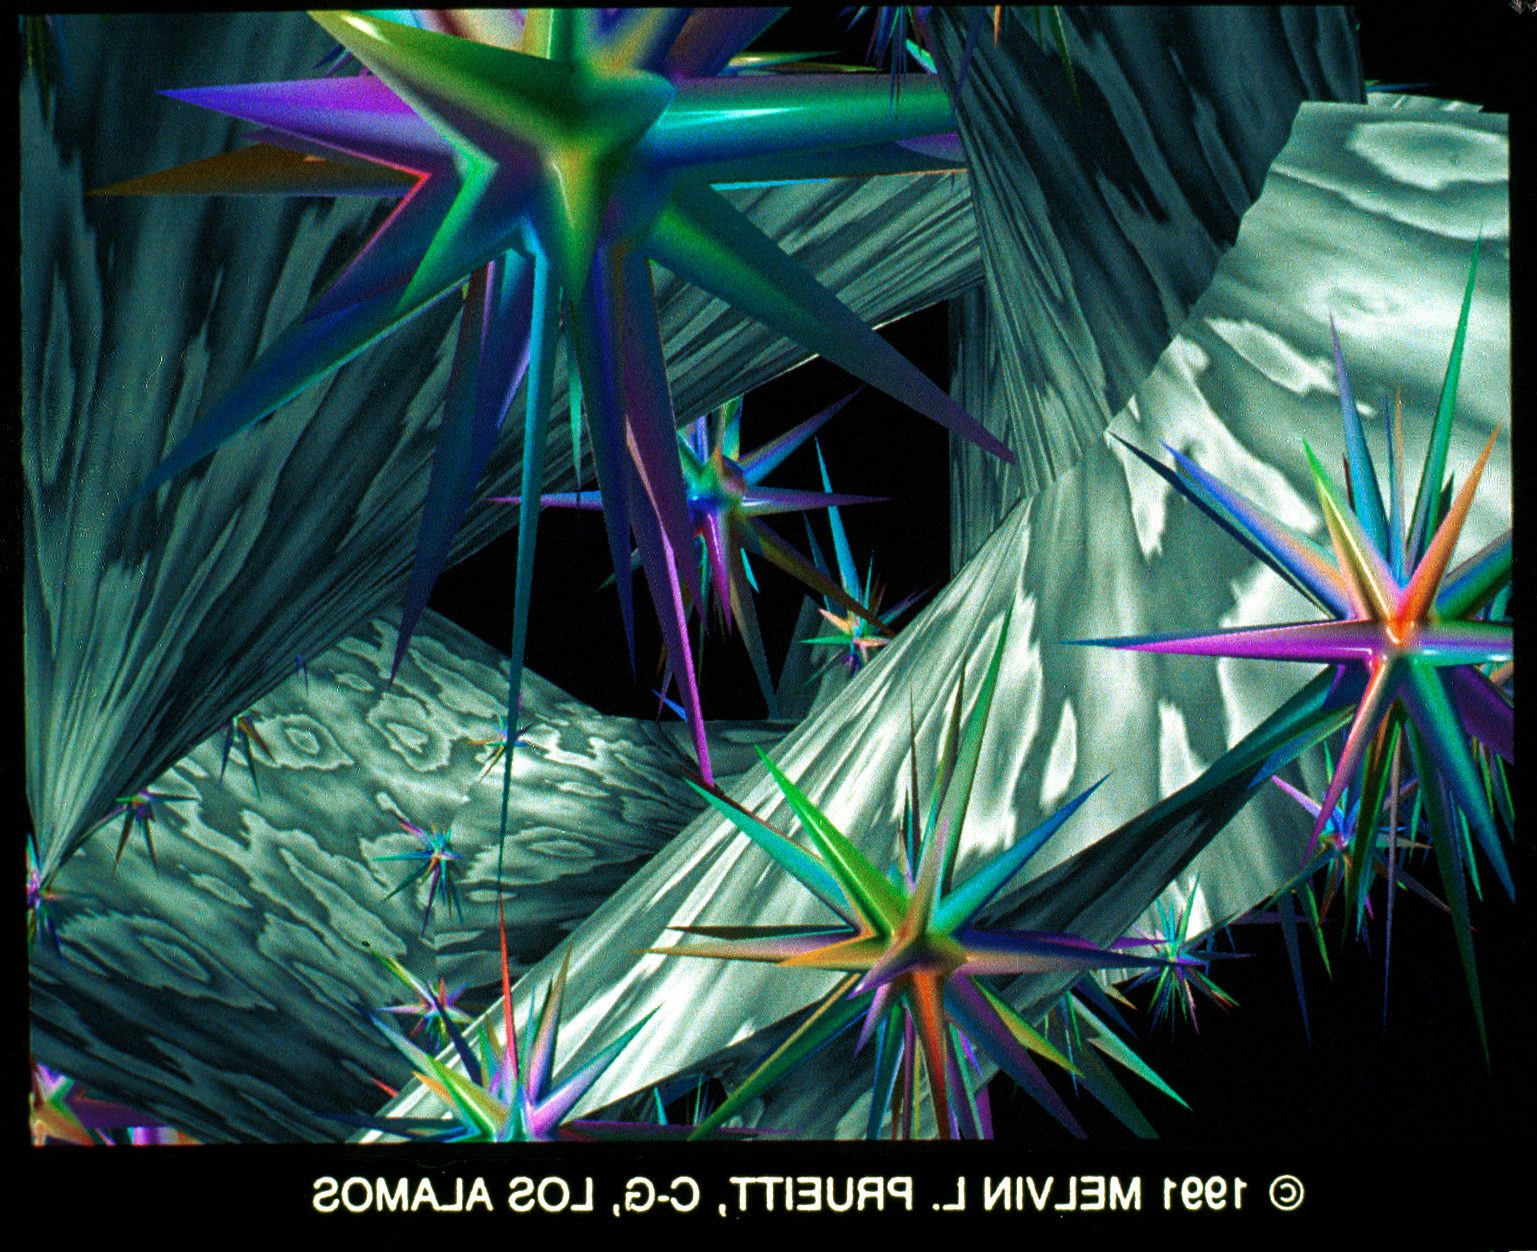
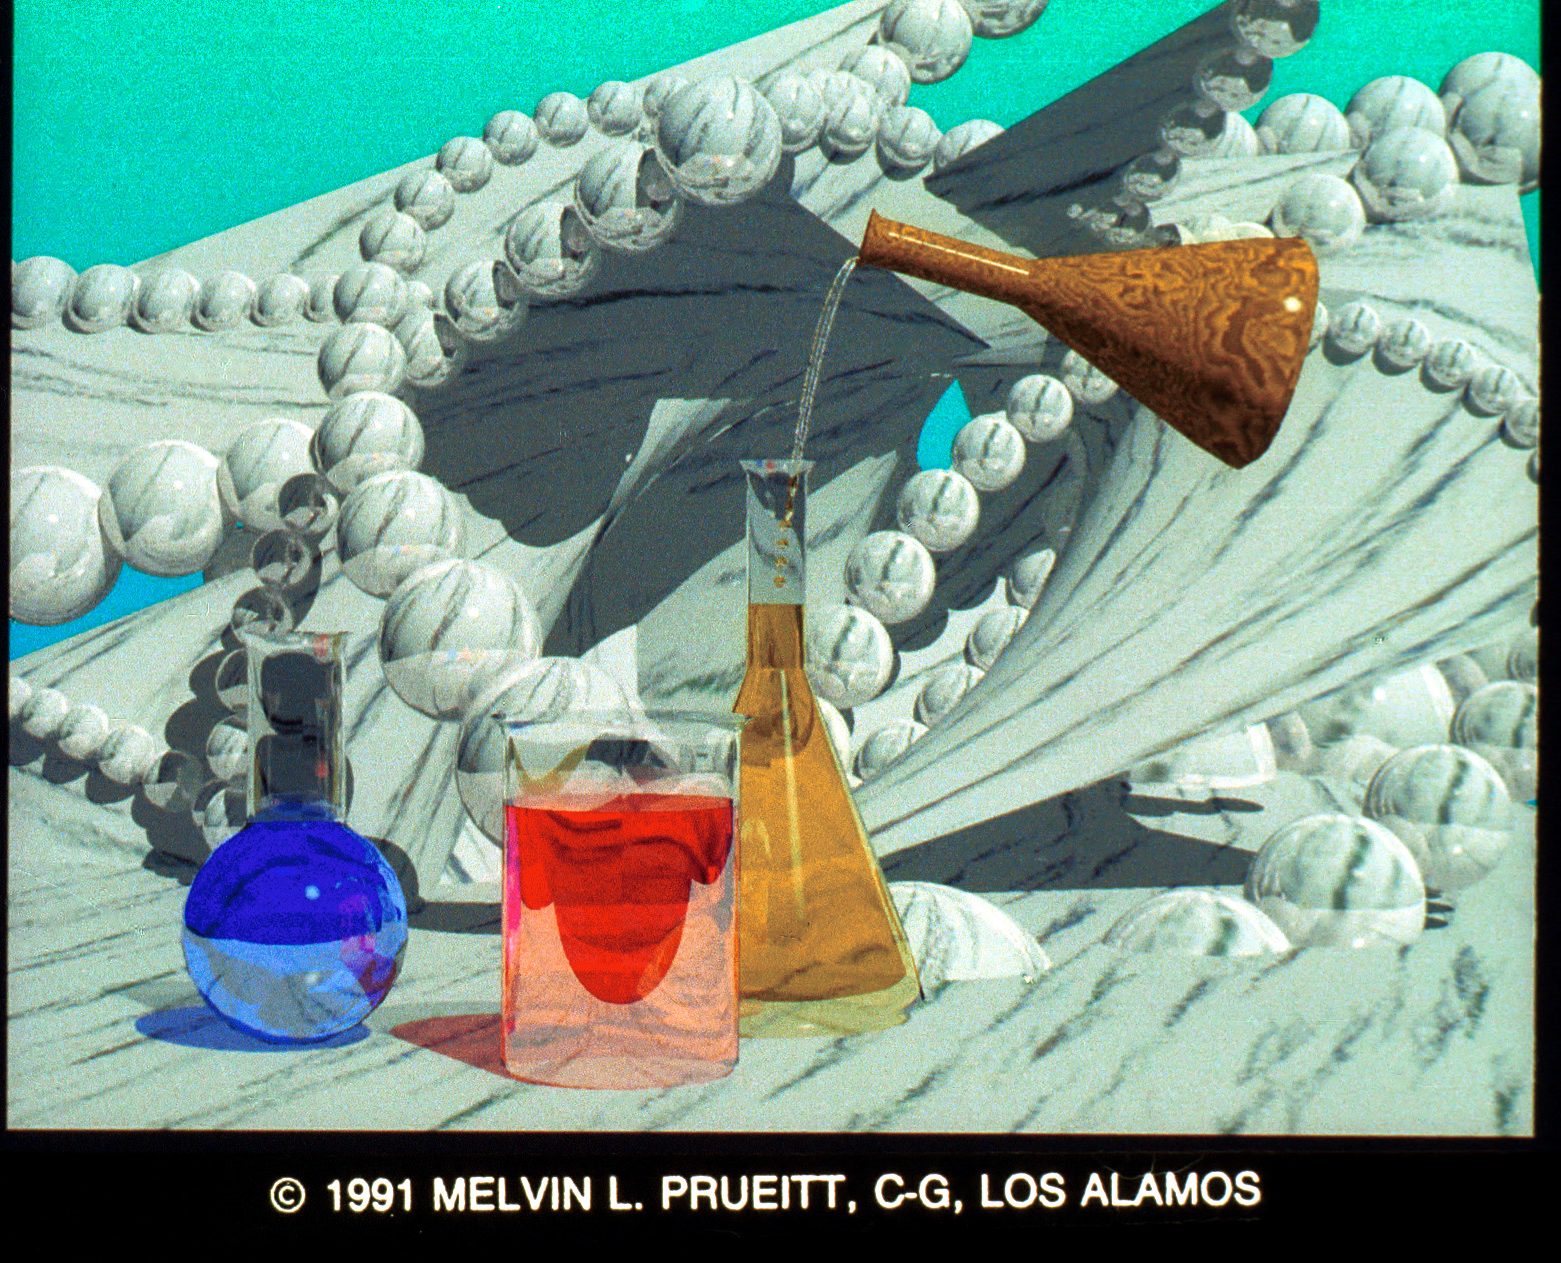
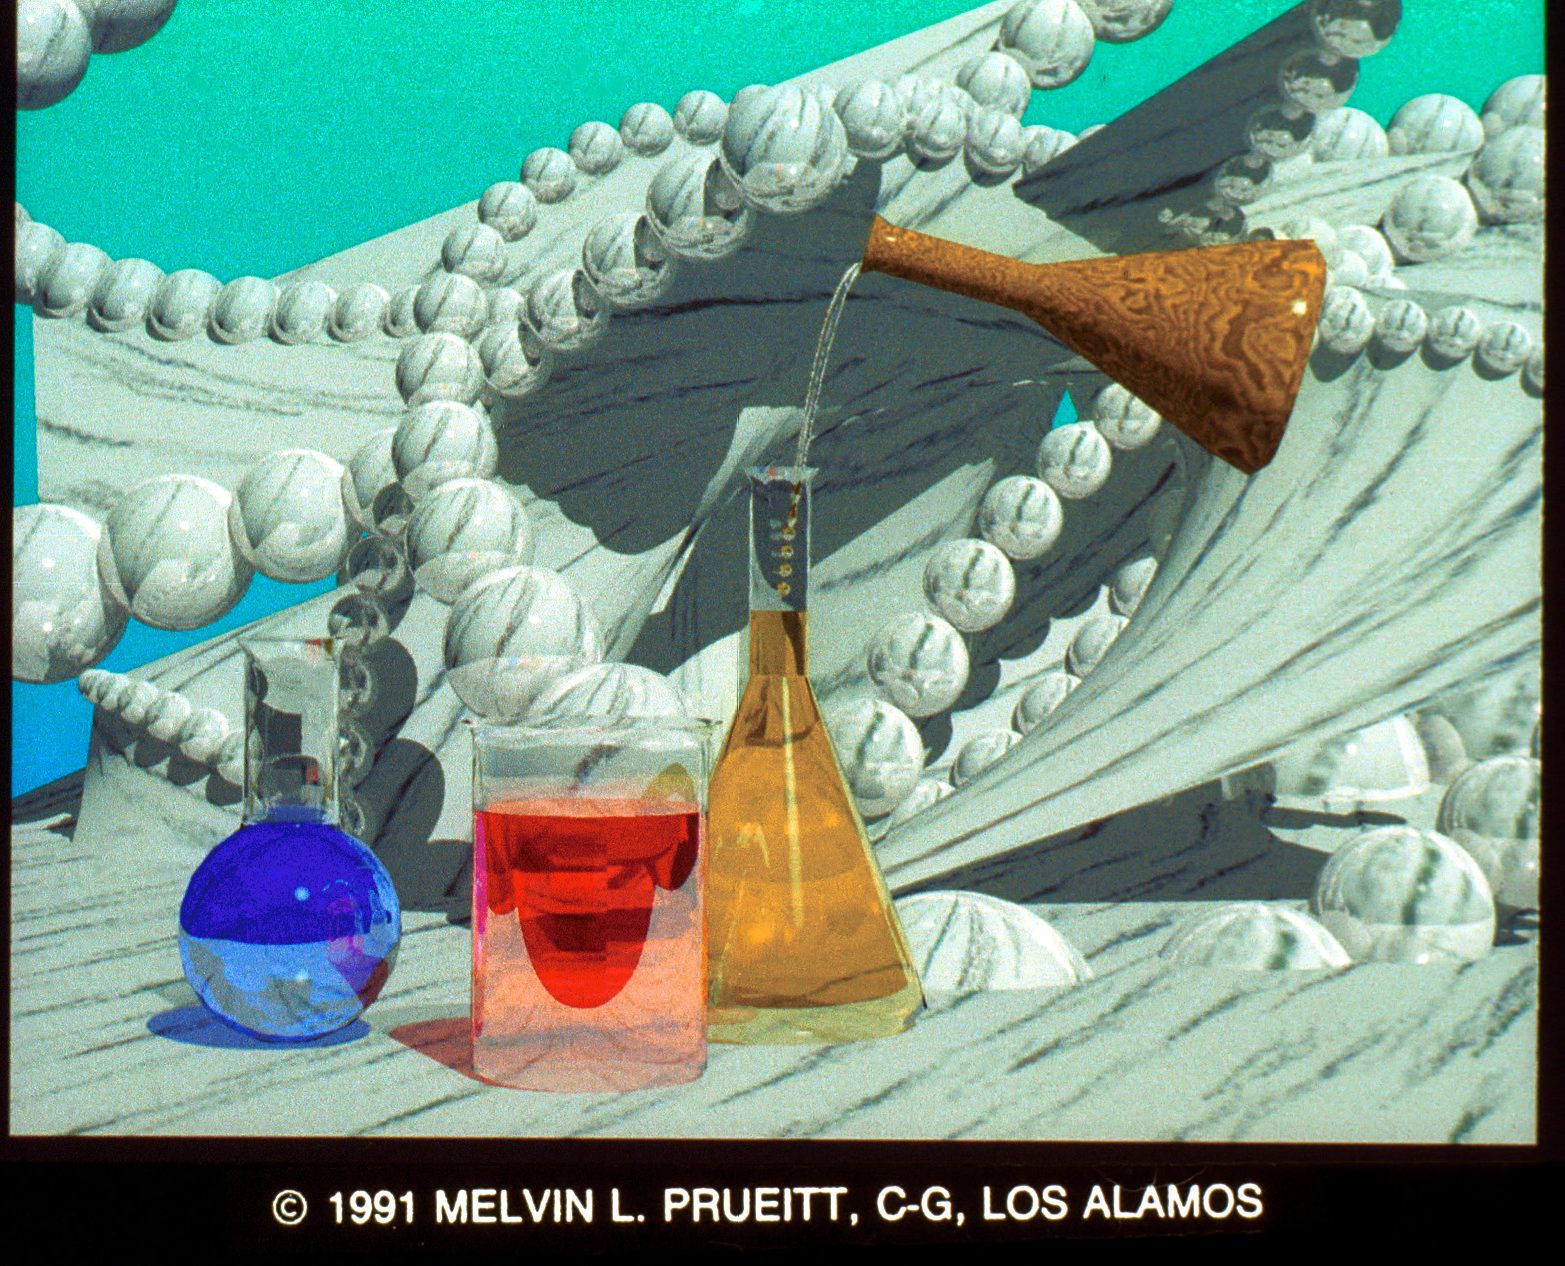
11&12. Chemistry by Melvin L. Prueitt. This stereo pair illustrates ray tracing, texture mapping and refraction. Falling liquid follows proper gravitational trajectory. They were created on a Cray YMP and Dicomed film recorder using SCOPE, the author’s own program. Contact: Melvin L. Prueitt, C-6 Computer Graphics, MS-B272, Los Alamos National Laboratory, Los Alamos, NM 87545; (505) 667-4452.
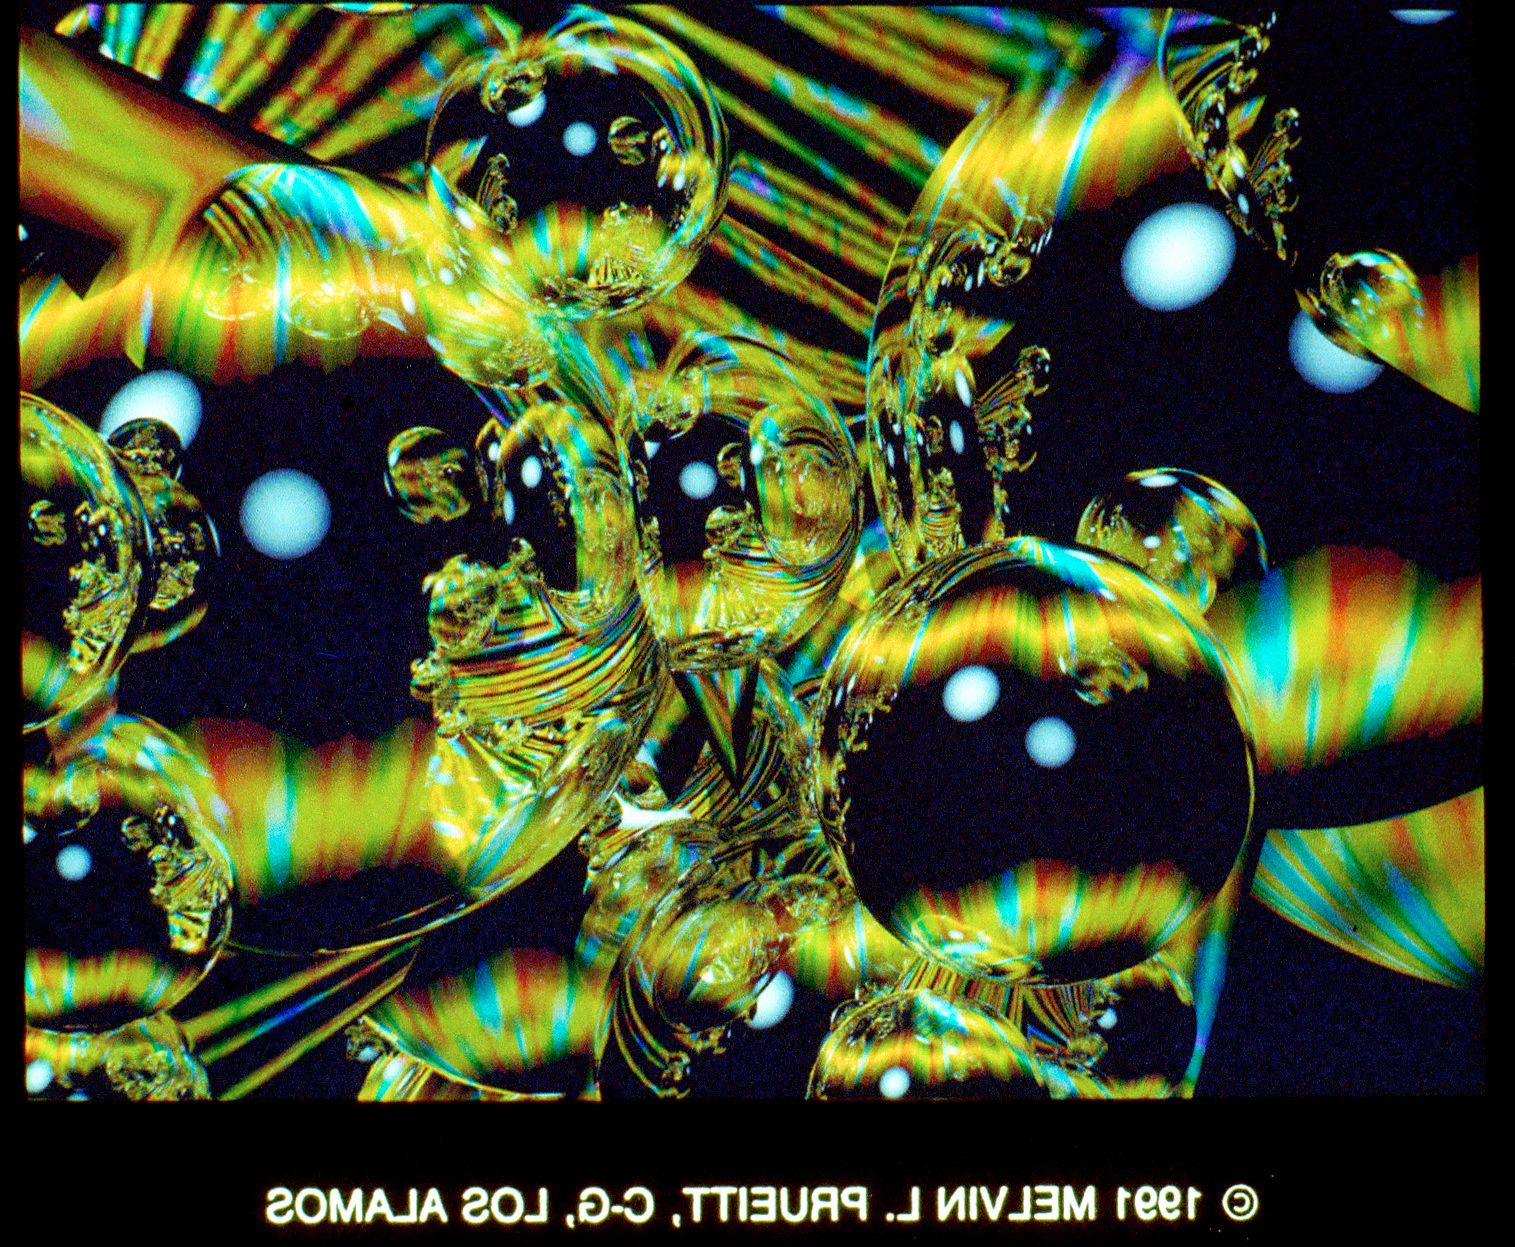
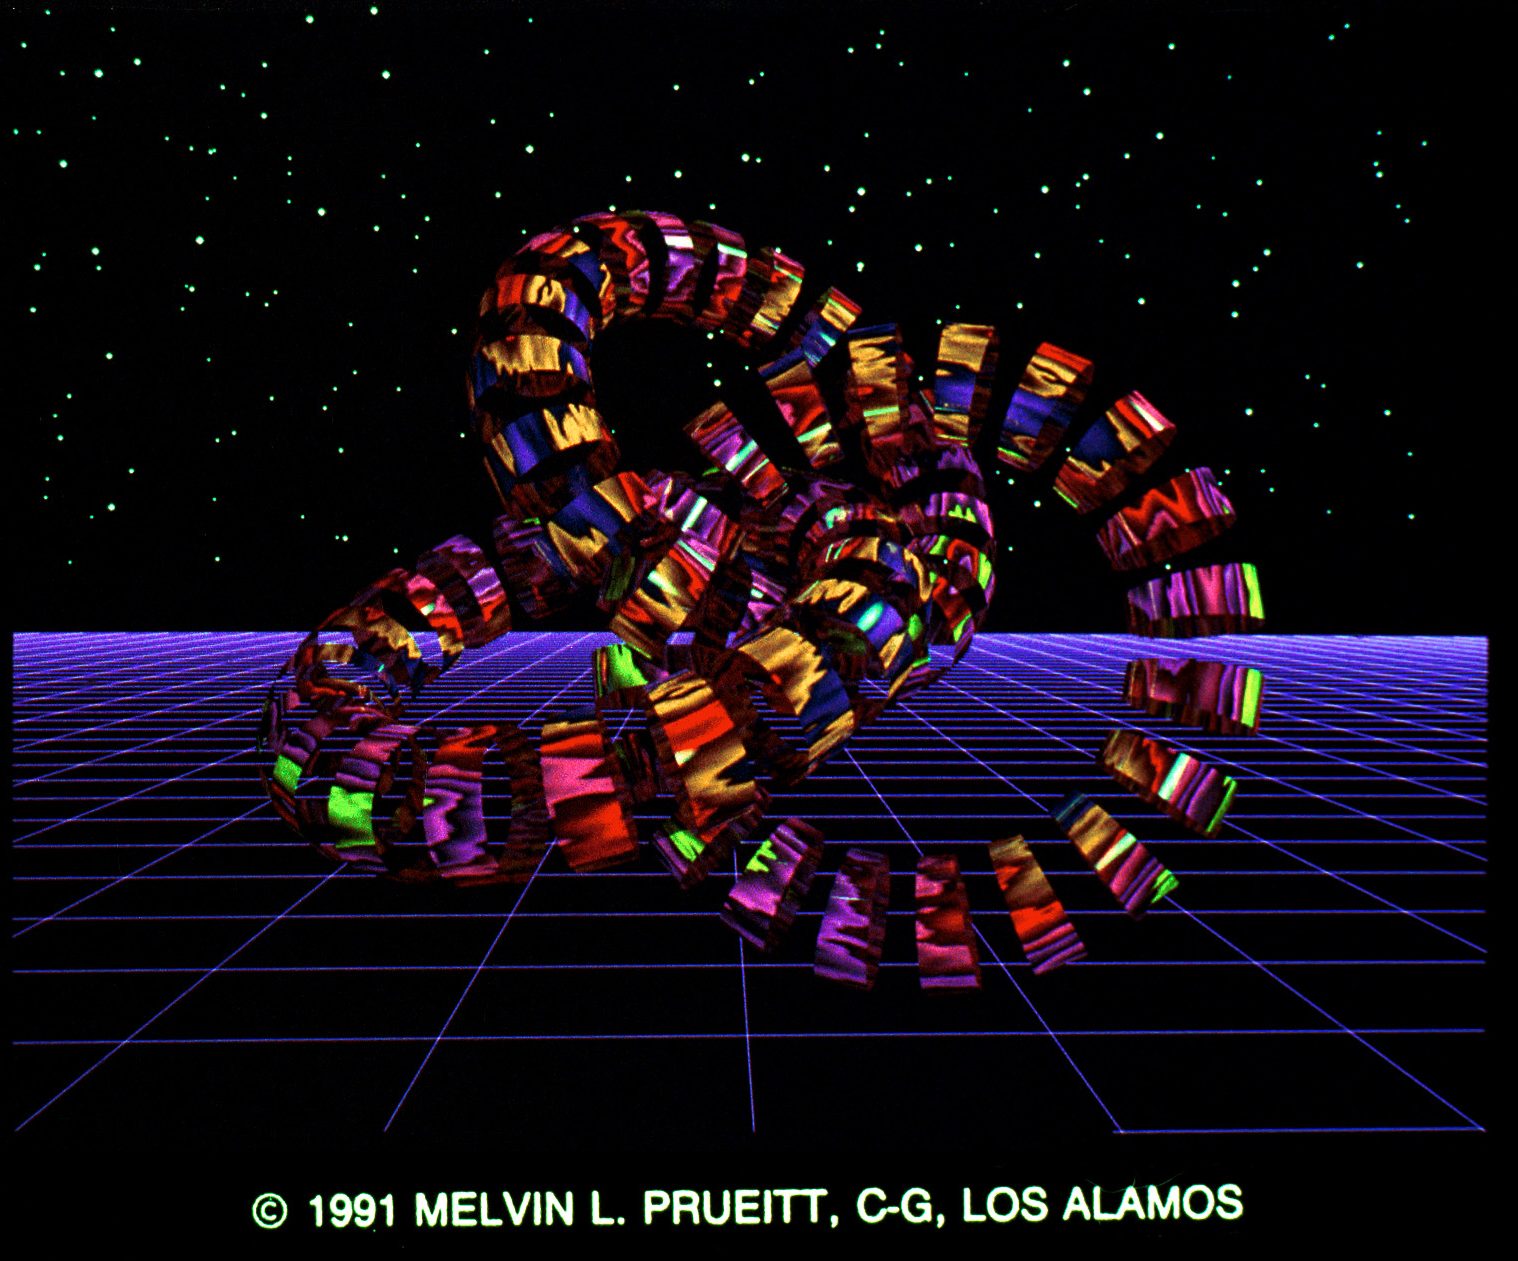
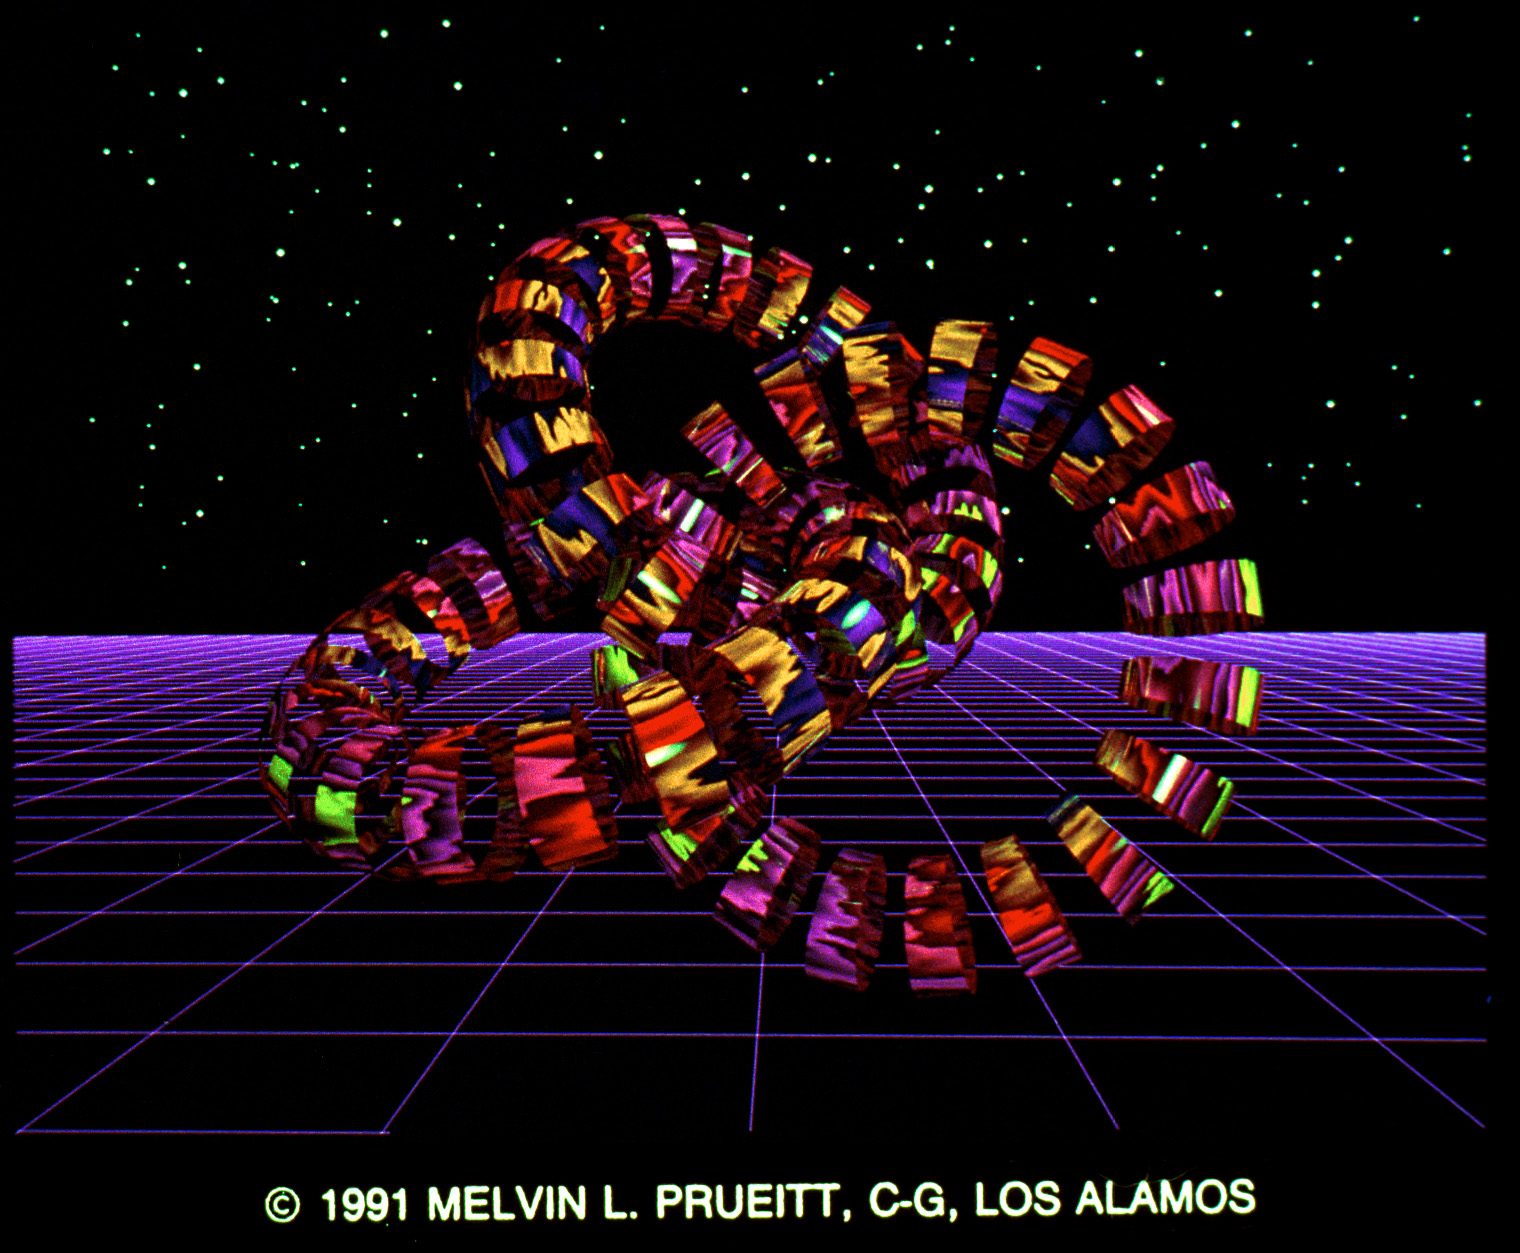
13&14. Quantum Space, Energy, and Time by Melvin L. Prueitt. This stereo pair illustrates ray tracing and texture mapping. They were created on a Cray YMP and Dicomed film recorder using SCOPE, the author’s own program. Contact: Melvin L. Prueitt, C-6 Computer Graphics, MS-B272, Los Alamos National Laboratory, Los Alamos, NM 87545; (505) 667-4452.
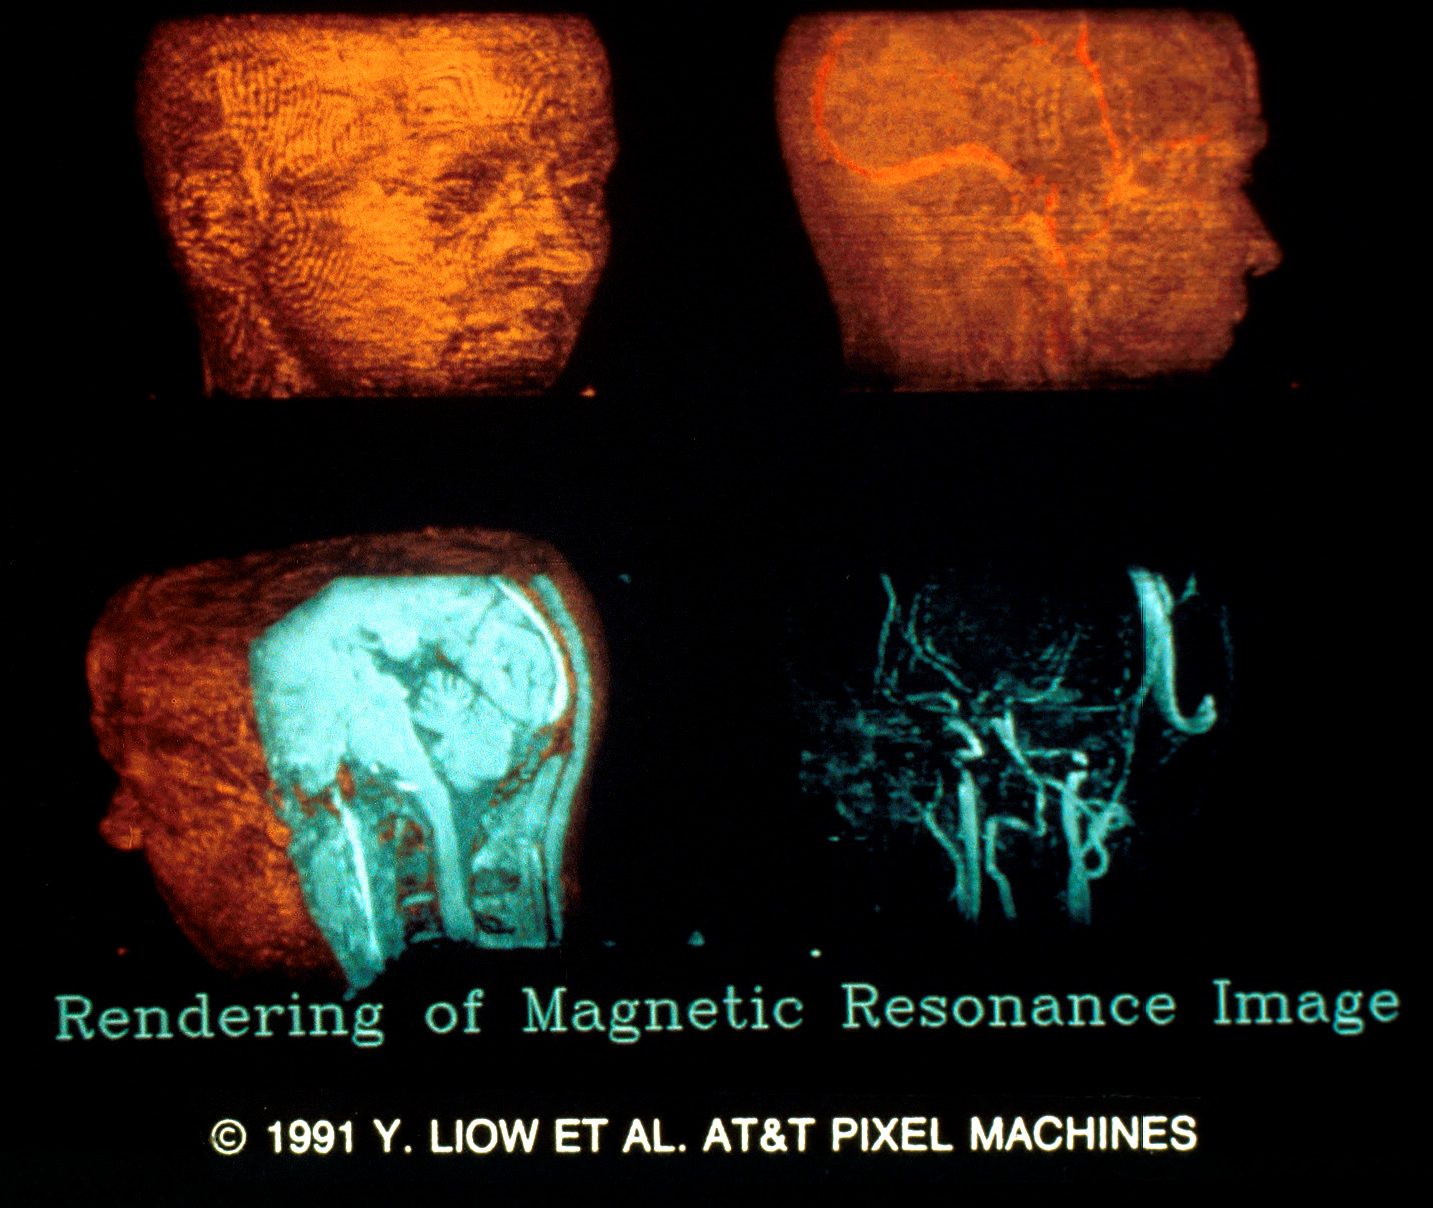
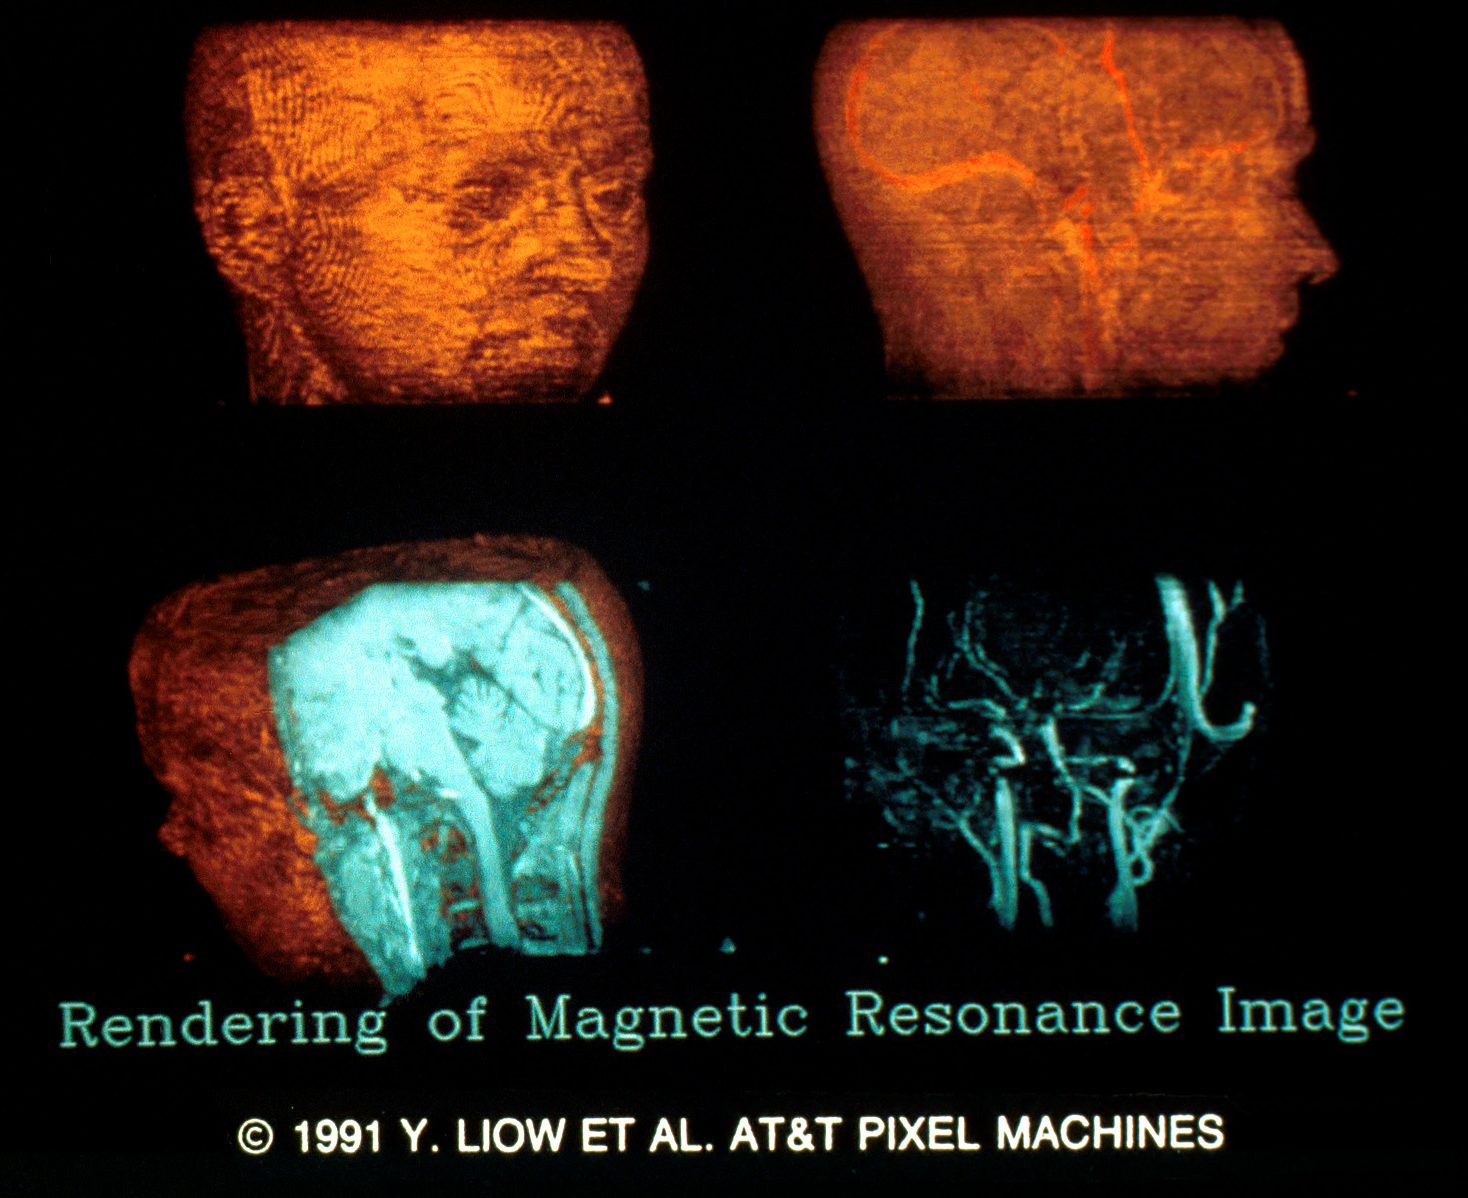
15&16. Rendering of MR Image by Y.T. Liow, M.R. Civanlar, S. Dzik. The volumes consisting of 164 magnetic resonance images of a human head are rendered using the back-to-front projection approach with varying opacities, cutplanes and maximal intensity projection techniques. Different surfaces, tissues and blood vessels can be visualized in each case. The stereo pair was created on an AT&T Pixel Machine #964 using IMG!ib image library created by the authors. Contact: Y.T. Liow, AT&T Pixel Machines, Crawfords Comer Road, Holmdel, NJ 07733; (908) 949-1224.
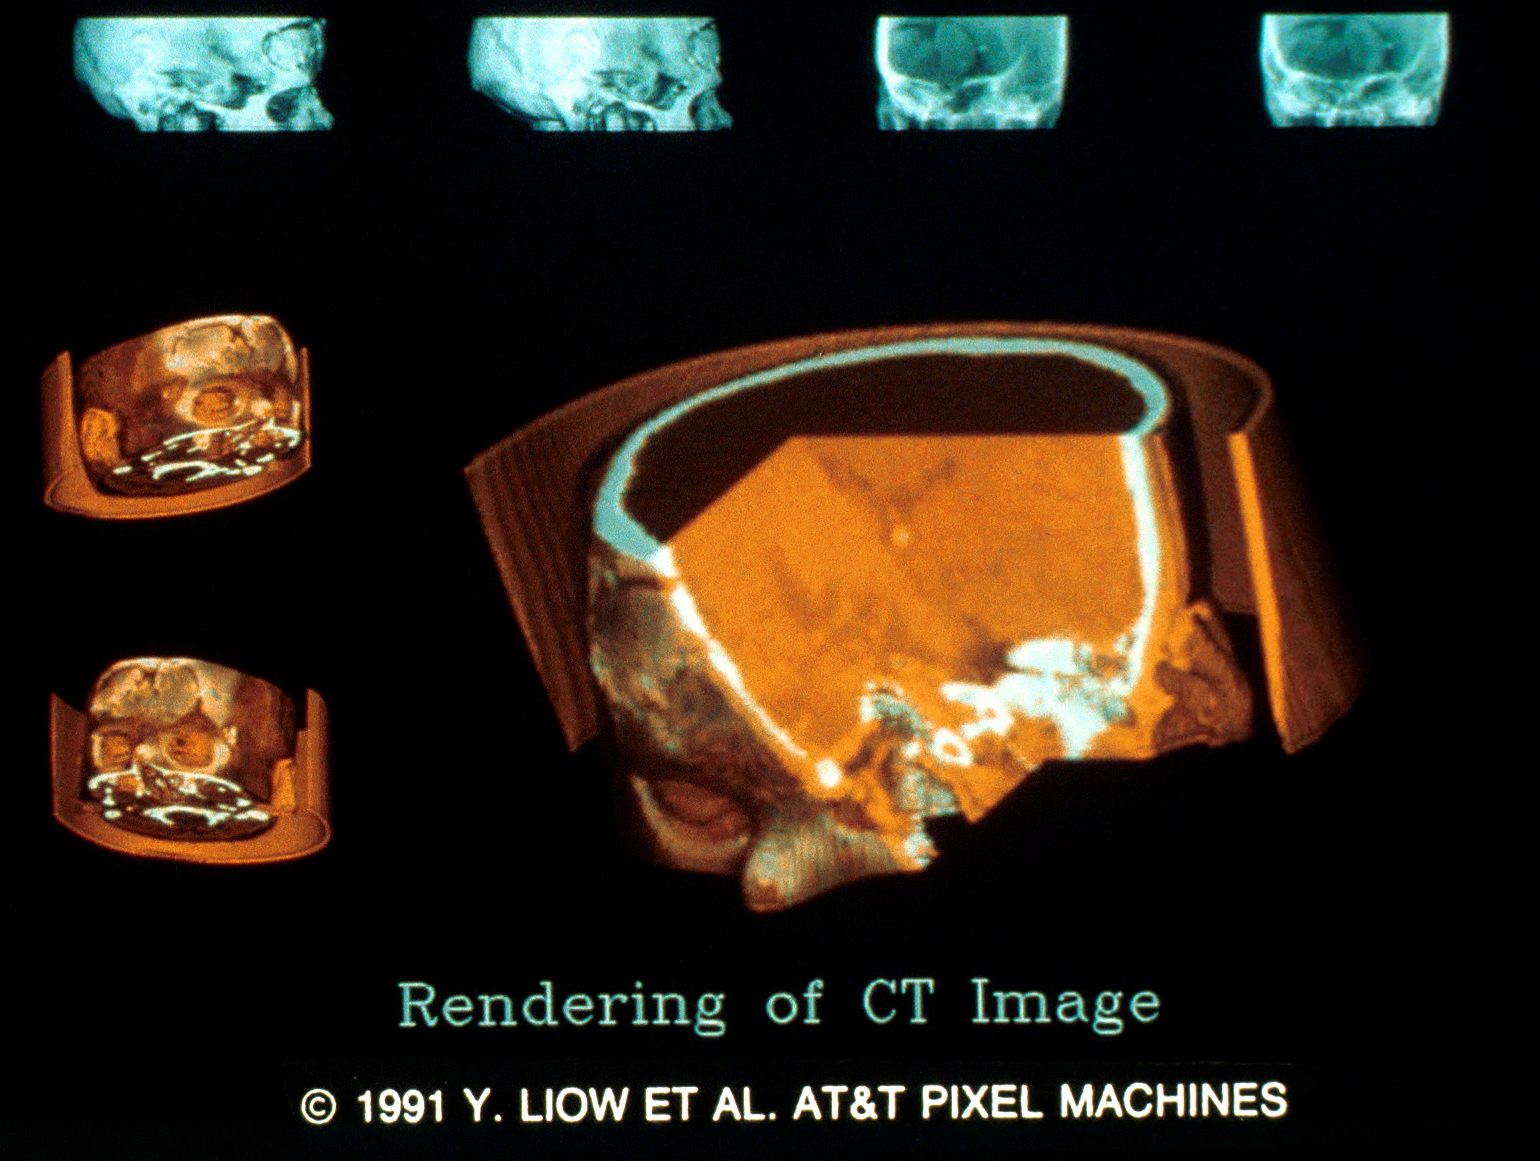
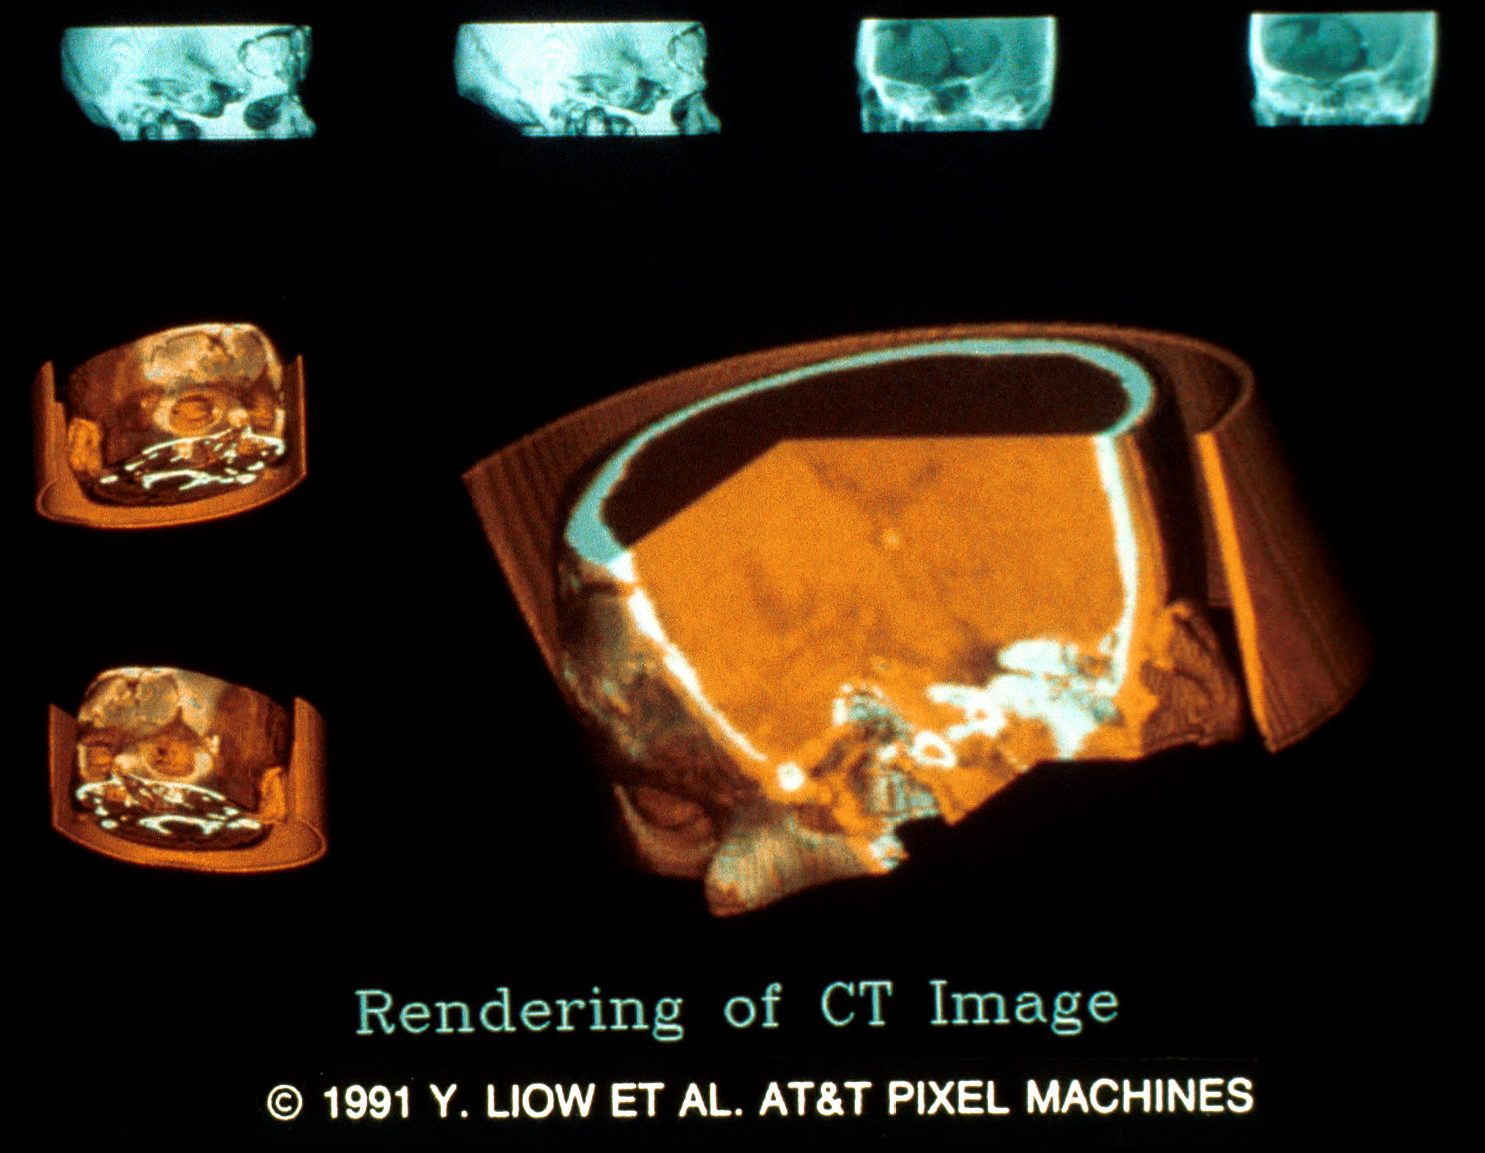
17&18. Rendering of CT Image by Y.T. Liow, M.R. Civanlar, S. Dzik. The volumes consisting of 96 CT images of a human head are rendered using the back-to-front projection approach with varying opacities, cutplanes and additive projection techniques. Different surfaces and tissues can be clearly visualized in each case. The stereo pair was created on an AT&T Pixel Machine #964 using IM Glib image library created by the authors. Contact: Y.T. Liow, AT&T Pixel Machines, Crawfords Comer Road, Holmdel, NJ 07733; (908) 949-1224.
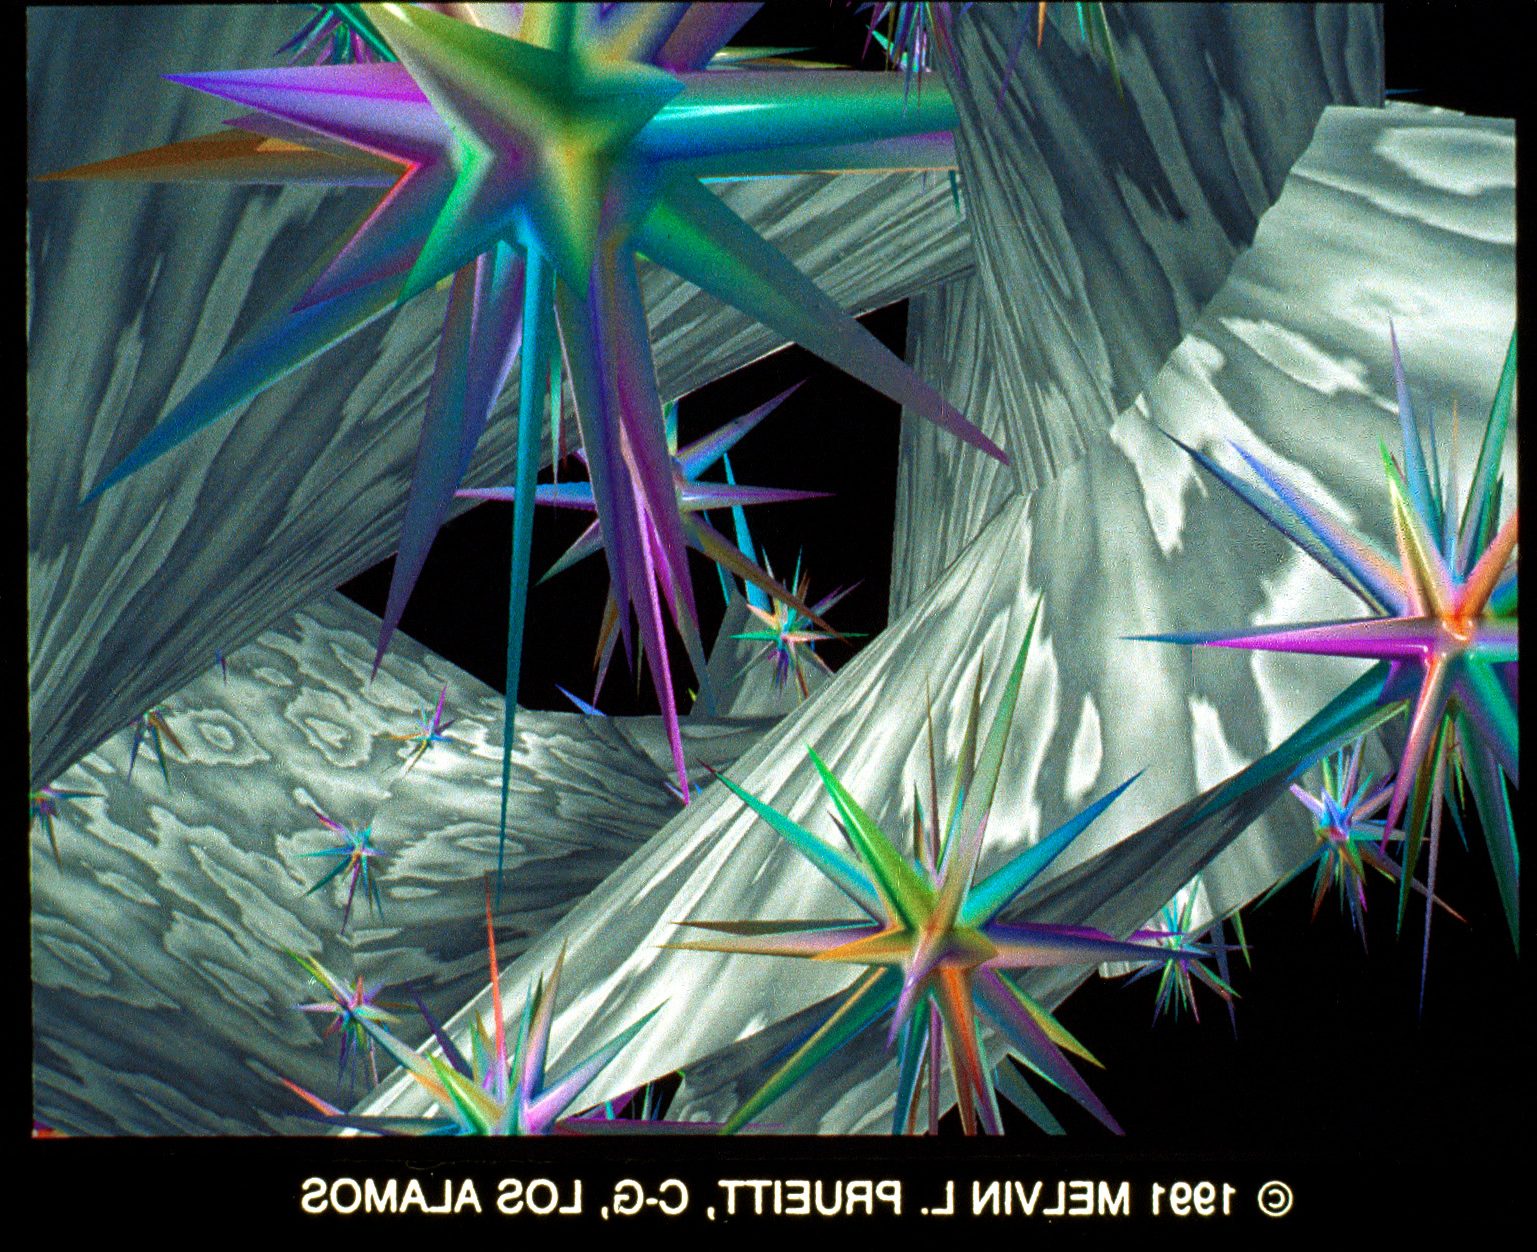
19&20. Logic Spaces by Melvin L. Prueitt. This stereo pair shows ray tracing and texture mapping. They were created on a Cray YMP and Dicomed film recorder using SCOPE, the author’s own program. Contact: Melvin L. Prueitt, C-6 Computer Graphics, MS-B272, Los Alamos National Laboratory, Los Alamos, NM 87545; (505) 667- 4452.
21&22. Guarded Portal by Melvin L. Prueitt. This stereo pair illustrates texture mapping. They were created on a Cray YMP and Dicomed film recorder using SCOPE, the author’s own program. Contact: Melvin L. Prueitt, C-6 Computer Graphics, MS-B272, Los Alamos National Laboratory, Los Alamos, NM 87545; (505) 667-4452.
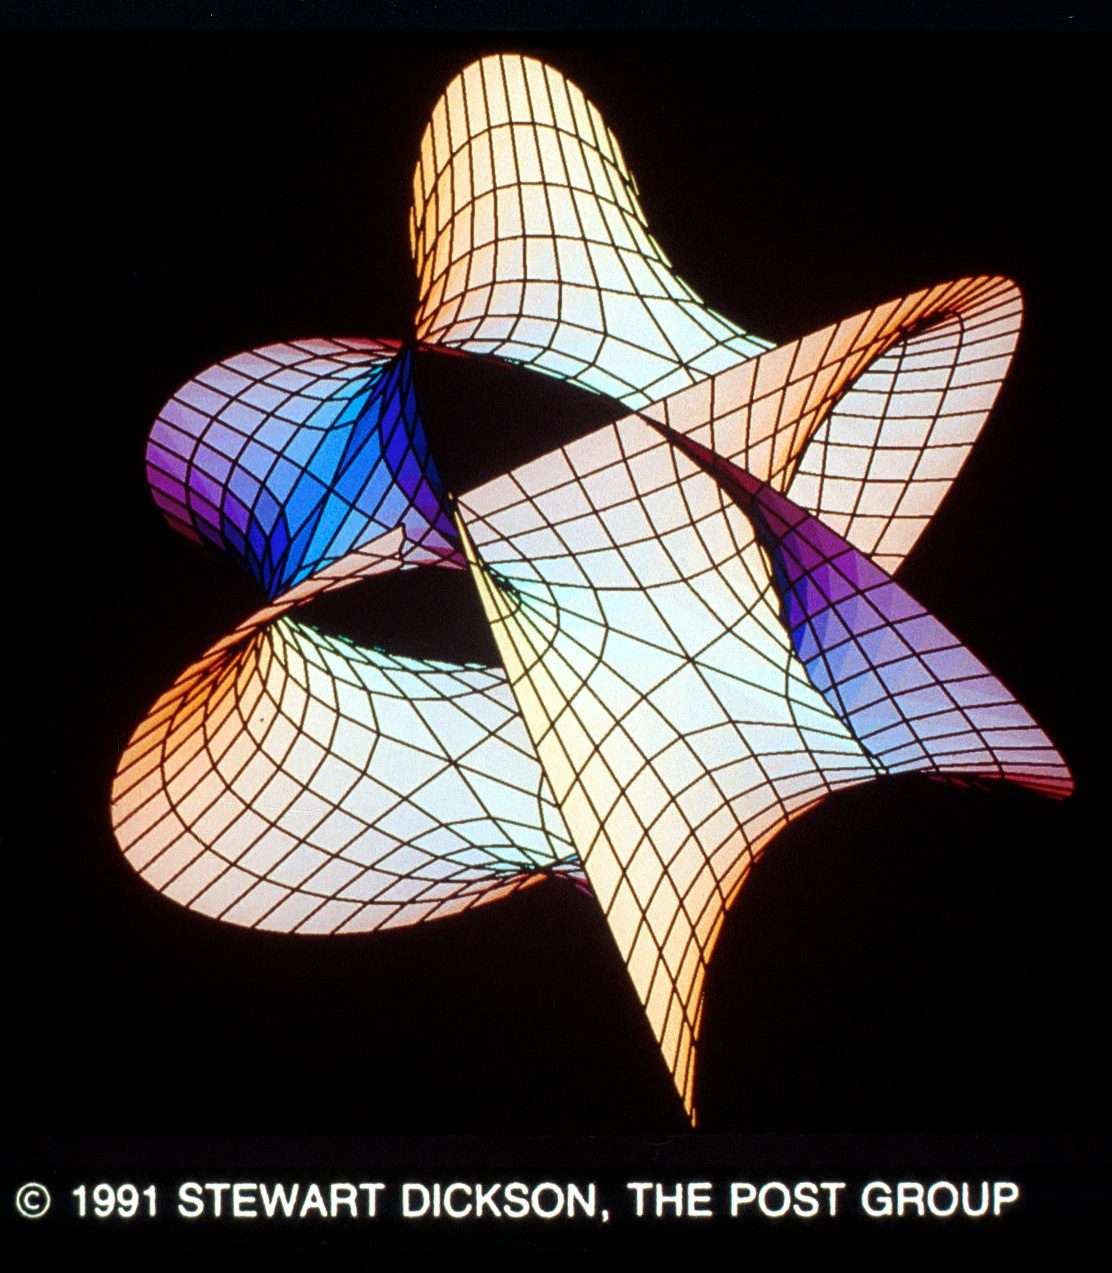
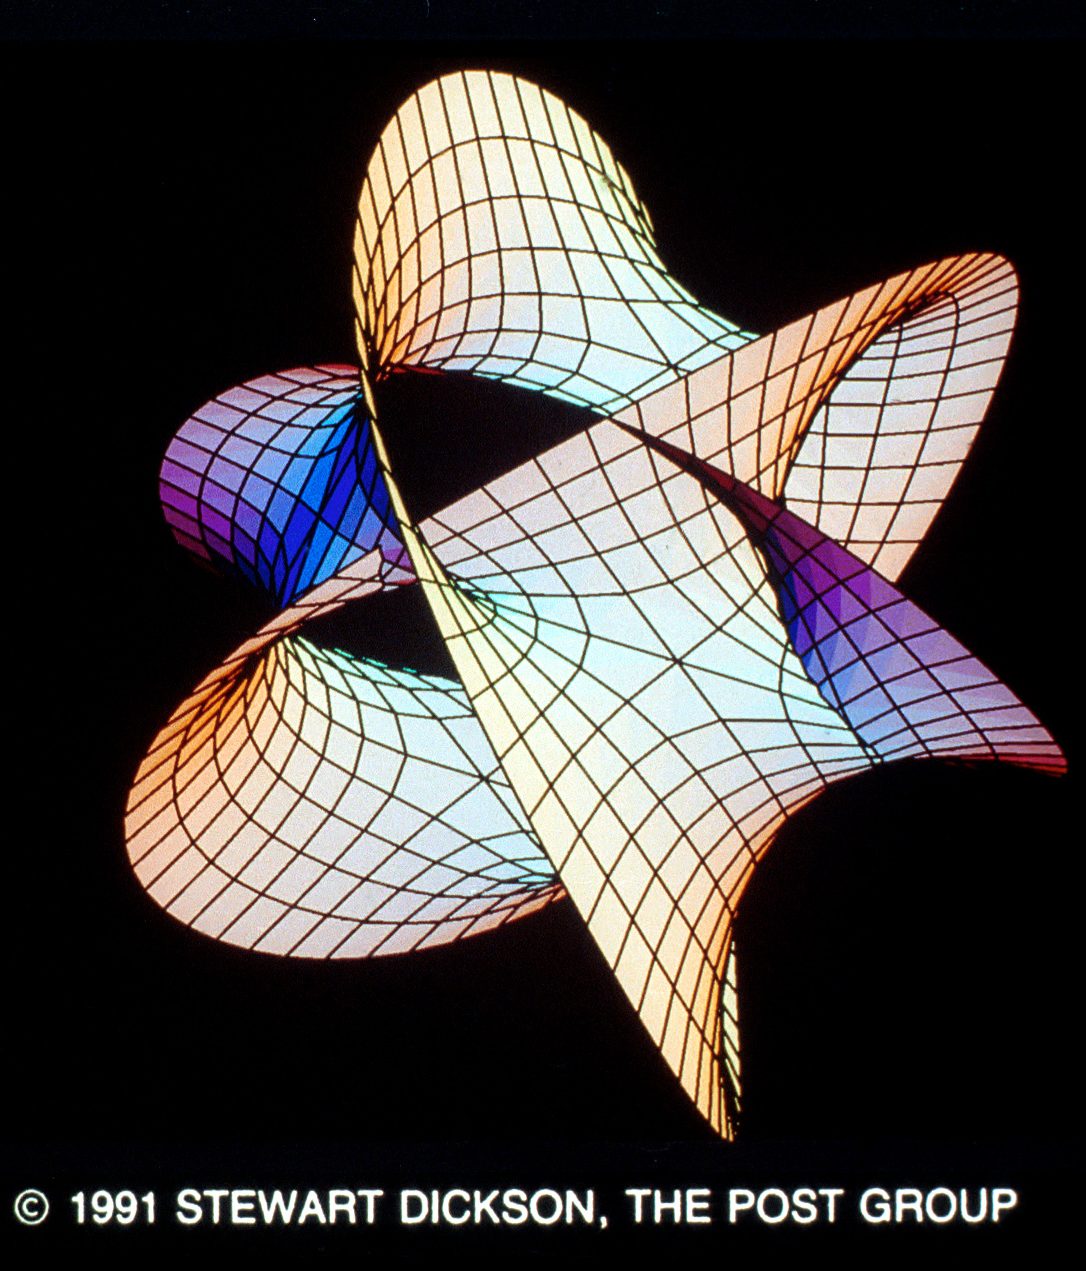
23&24. Fermat’s Last Theorem, N = 3 by Andrew Annson (Indiana University), Stewart Dickson. Fermat’s Final Theorem (as yet unproven): z7 + z2 = 1 contains no rational points on the unit square for n > 2. Complex projective varieties determined by (xn + y” = z”), n = 3 projected into 3-space. They were created on a SGI 4D/25 and Solitaire image recorder using Mathematica. Contact: Stewart Dickson, The Post Group Digital Center, 6335 Homewood Avenue, Los Angeles, CA 90028; (213) 462-2300 x832.
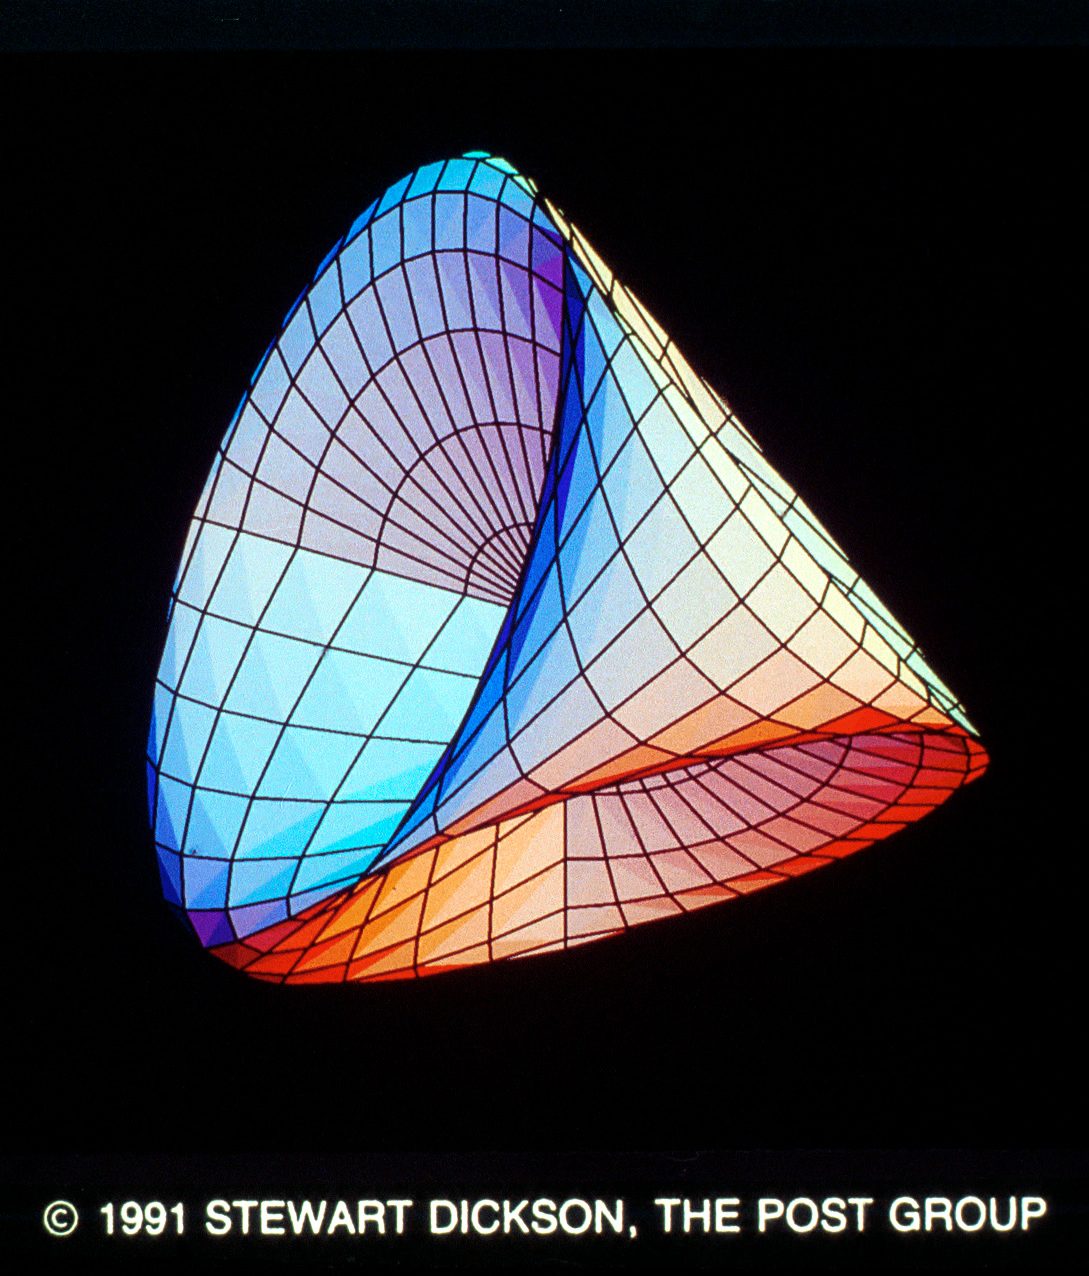
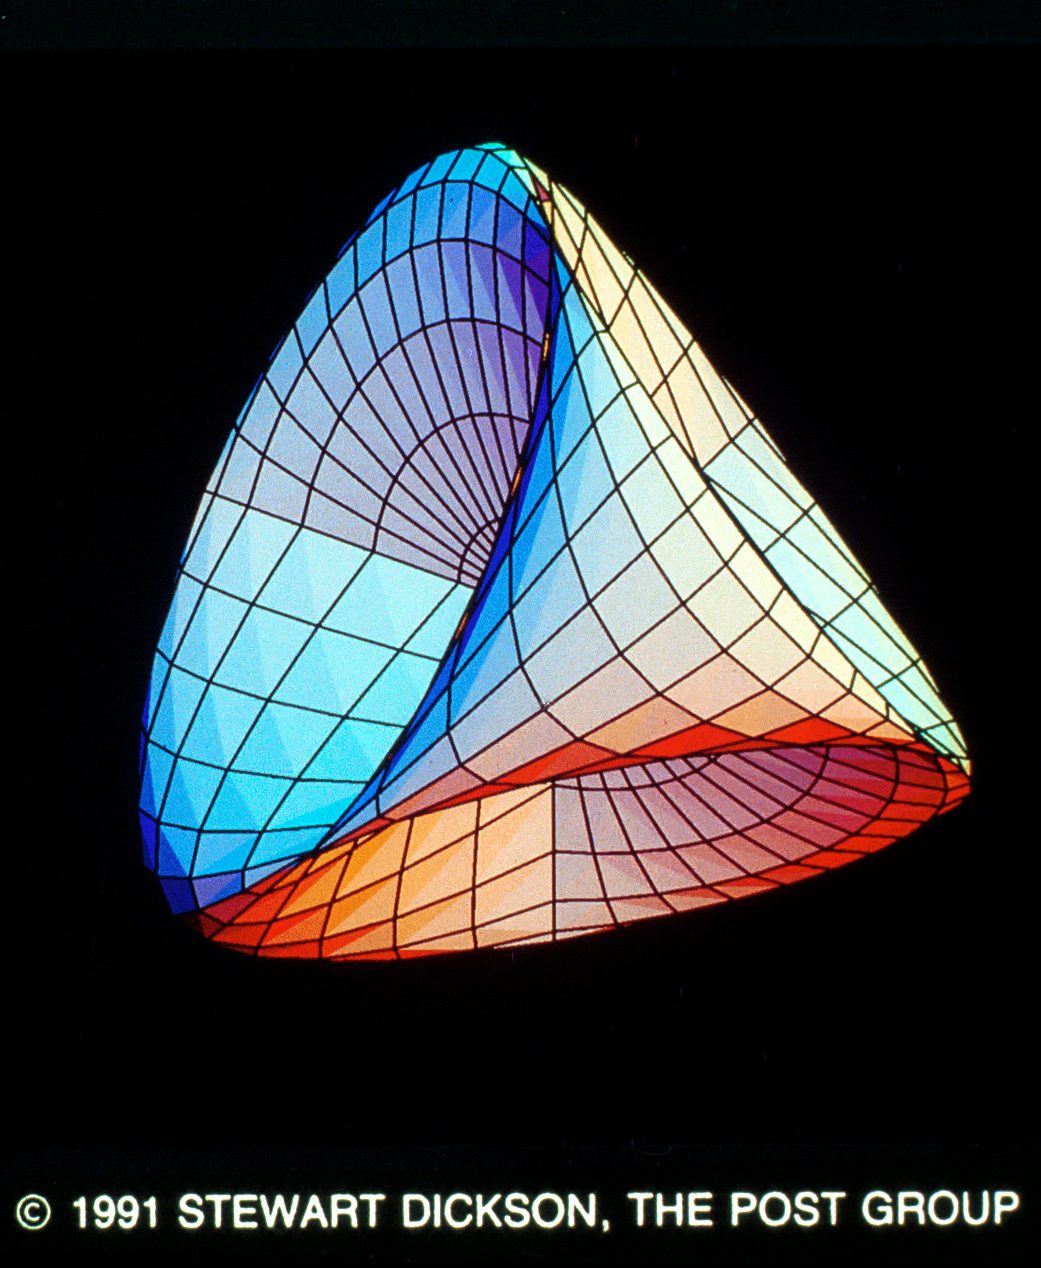
25&26. Steiner’s Quartic Surface by Stewart Dickson. Steiner’s Quartic Surface: y2z 2 + z 2×2 + x2y2 + xyz = 0. It is topologically equivalent to a sphere with four crosscaps, a non-orientable surface (like the Klein bottle). Parameter- ization was found using Mathematica on a SGI 4D/25 and Solitaire image recorder. Contact: Stewart Dickson, The Post Group-Digital Center, 6335 Homewood Avenue, Los Angeles, CA 90028; (213) 462-2300 x832.
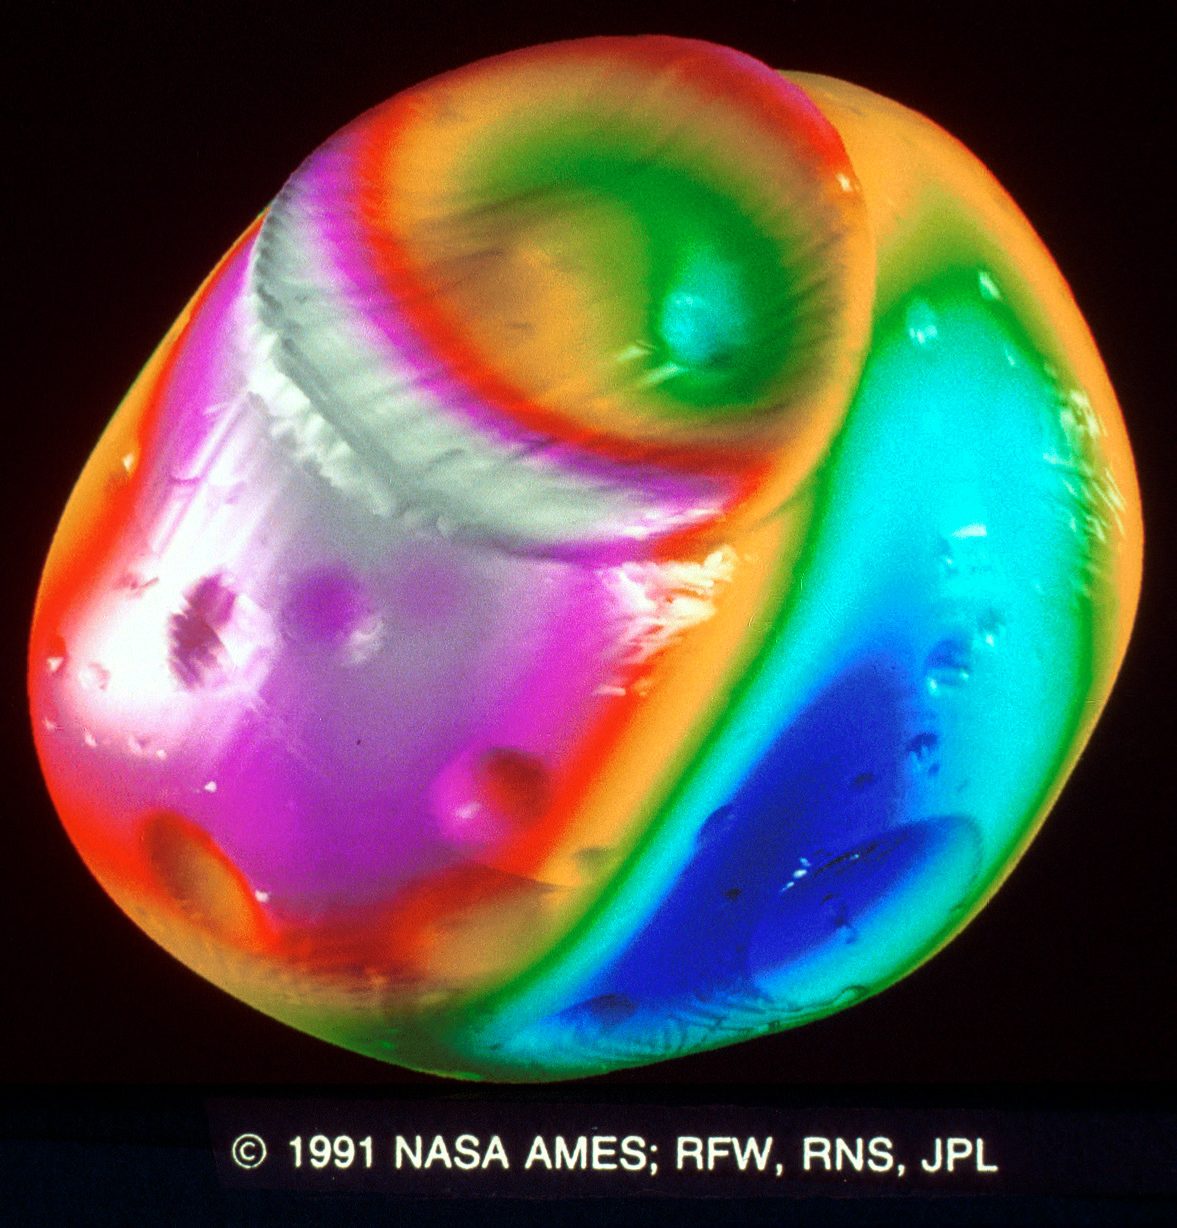
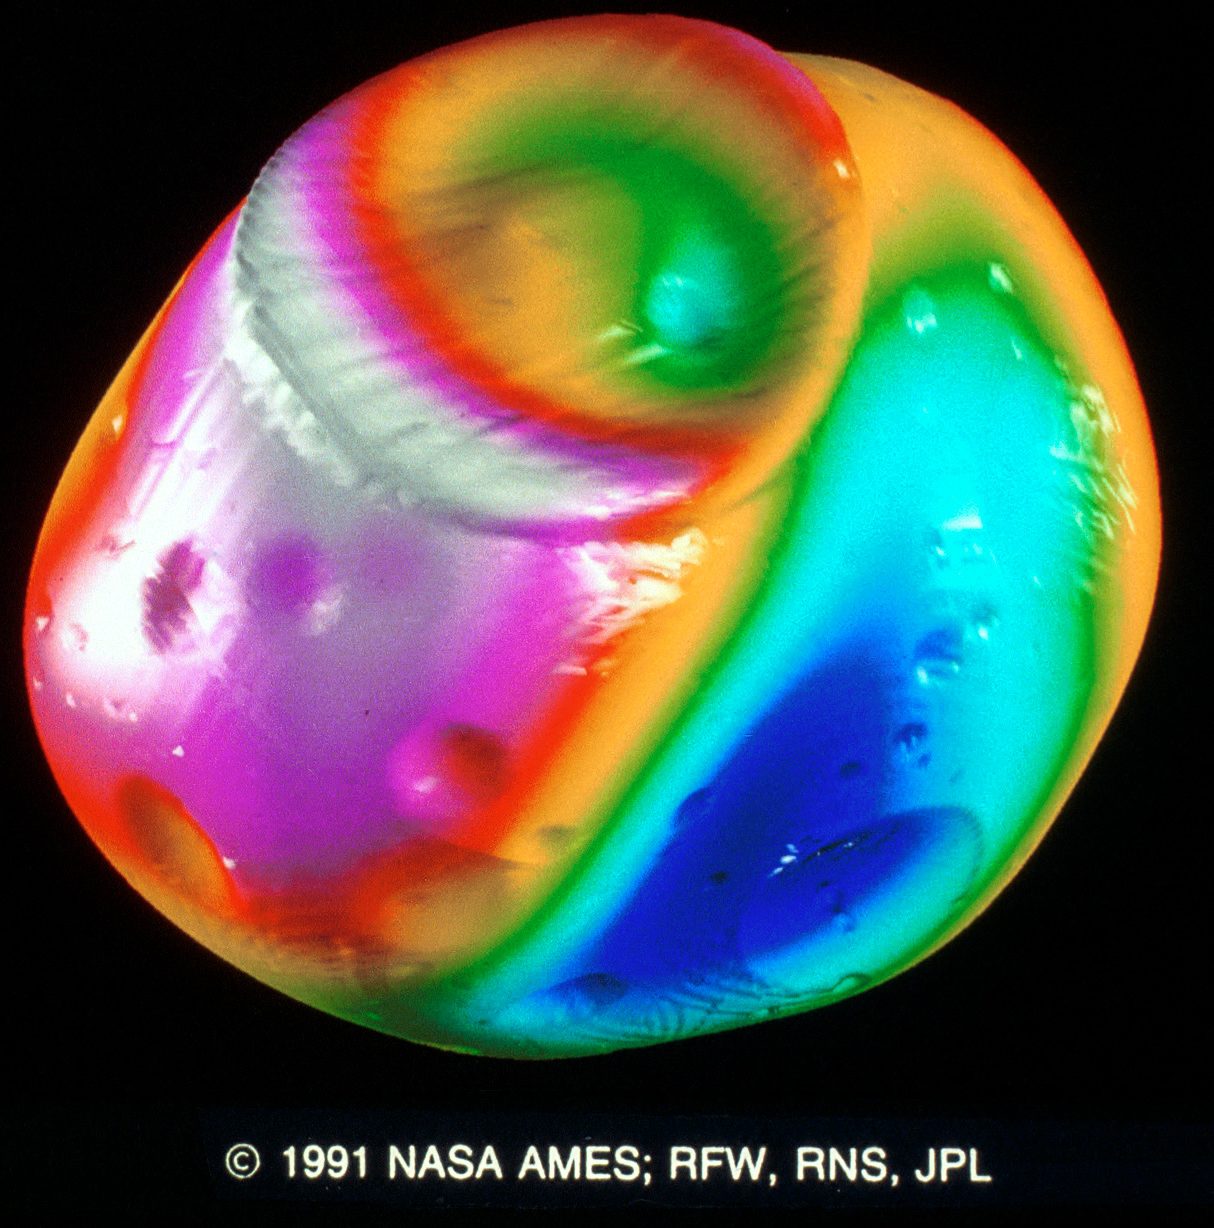
27&28. Phobos Topography Color Coded Version by Philip C. Chen, Vee Collet, Tseng-Chan (JPL), Mike Wang (JPL), Thomas C. Duxbury (JPL). This stereo pair shows the topography of Phobos – a satellite of Mars. Data was obtained from processing Viking Mission data. Colors represent distance from center of mass (blue is low, white is high). The images were created on a SGI 320-VGX using Flow Analysis Software Tool Kit. Contact: Vee Collet, Sterling Software at NASA Ames, MS 258-2, Moffett Field, CA 94035; (415) 604-4450.
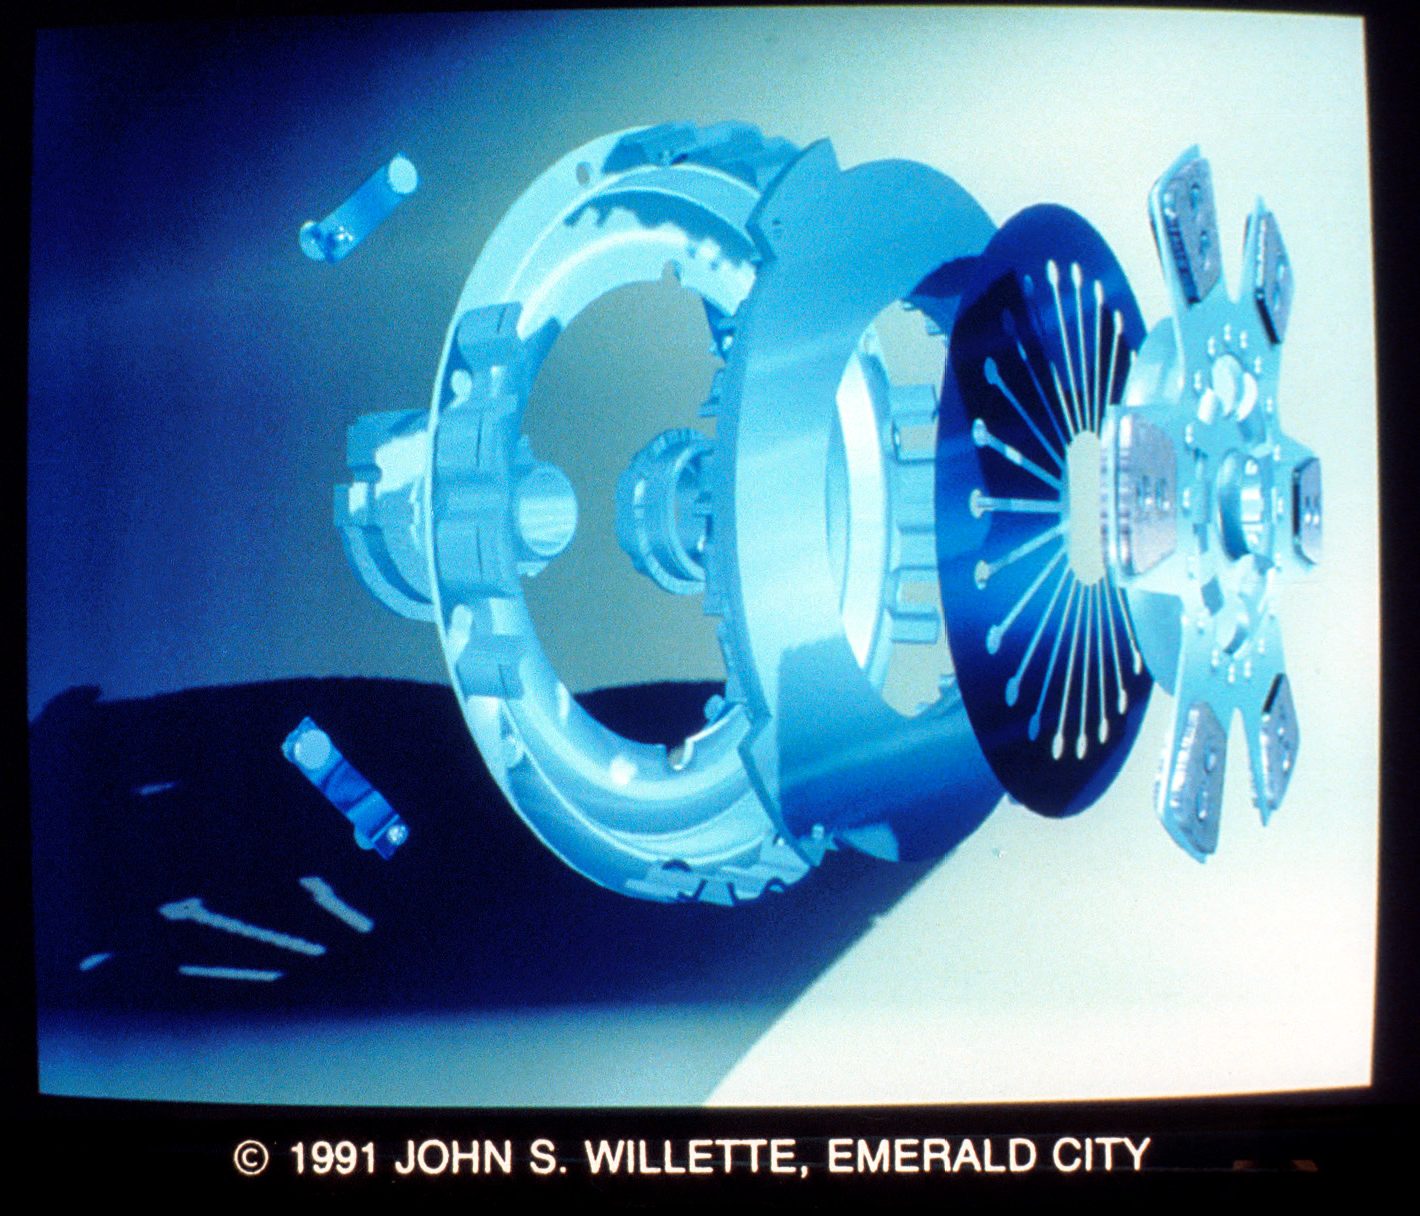
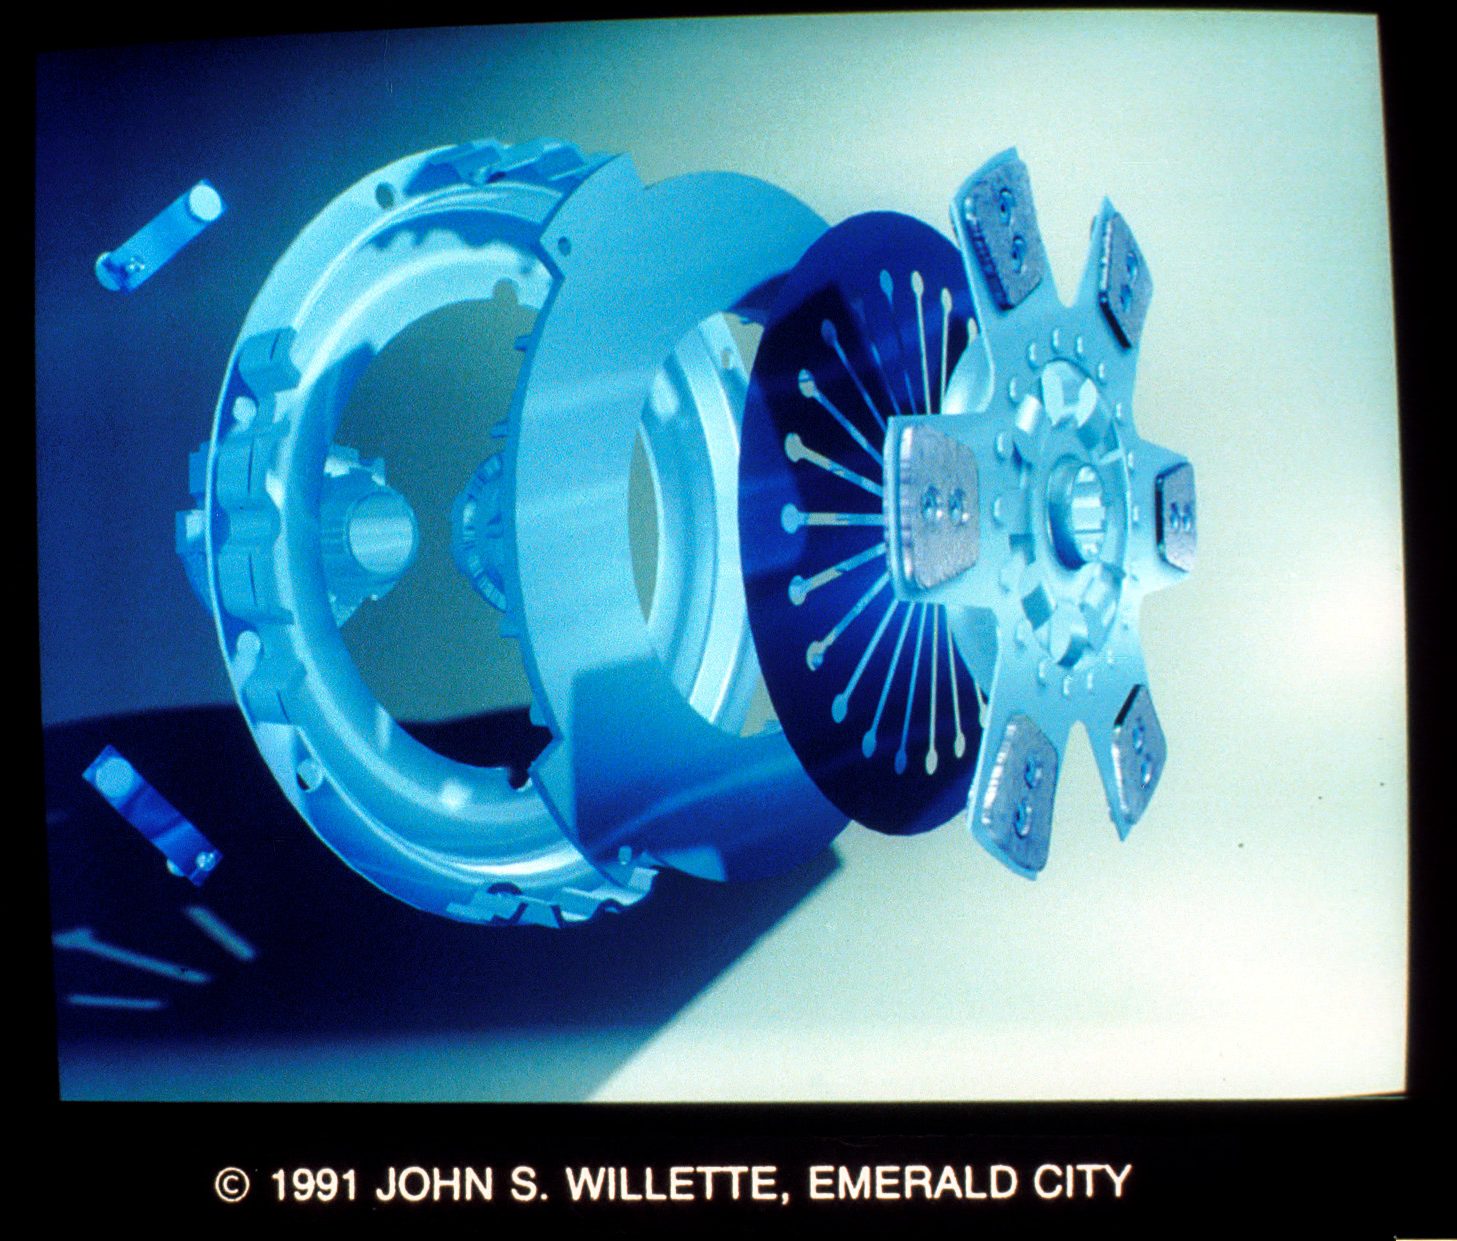
29&30. Eaton Clutch, Rear Explosion by John S. Willette. Using blueprints and mockups, this photo- realistic truck clutch was shown to manufacturers and used for trade show purposes. The images were produced on a SGI 4D/210GT using Vertigo, Picture Maker and True Color Paint. Contact: John S. Willette, E Drive S.E., Grand Rapids, MI 49546; (616) 949-9283
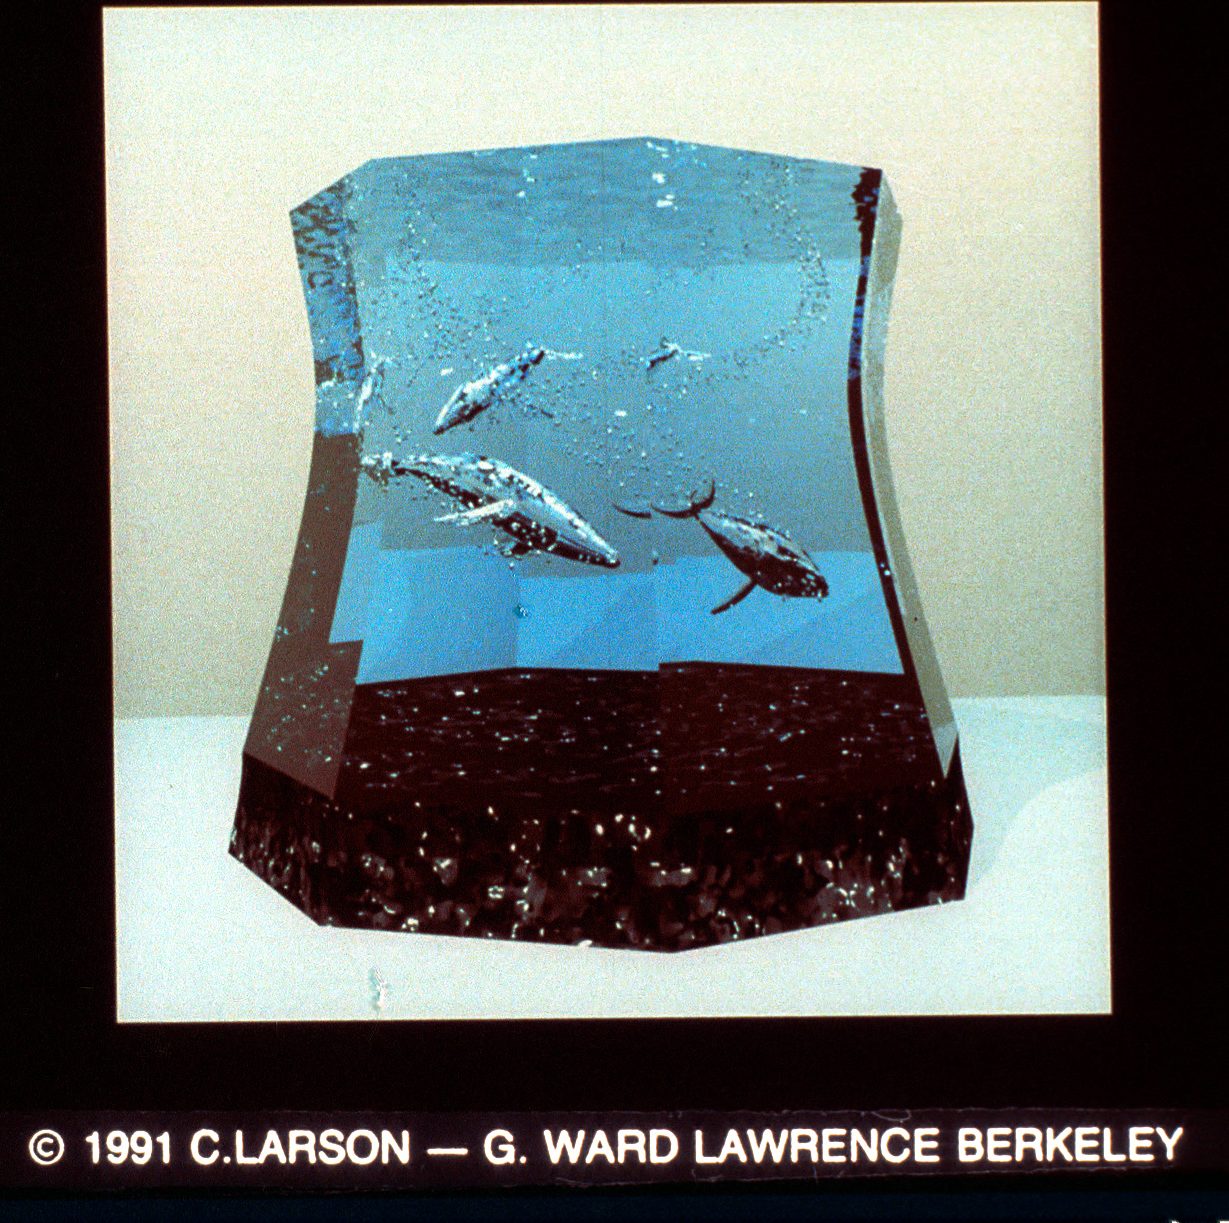
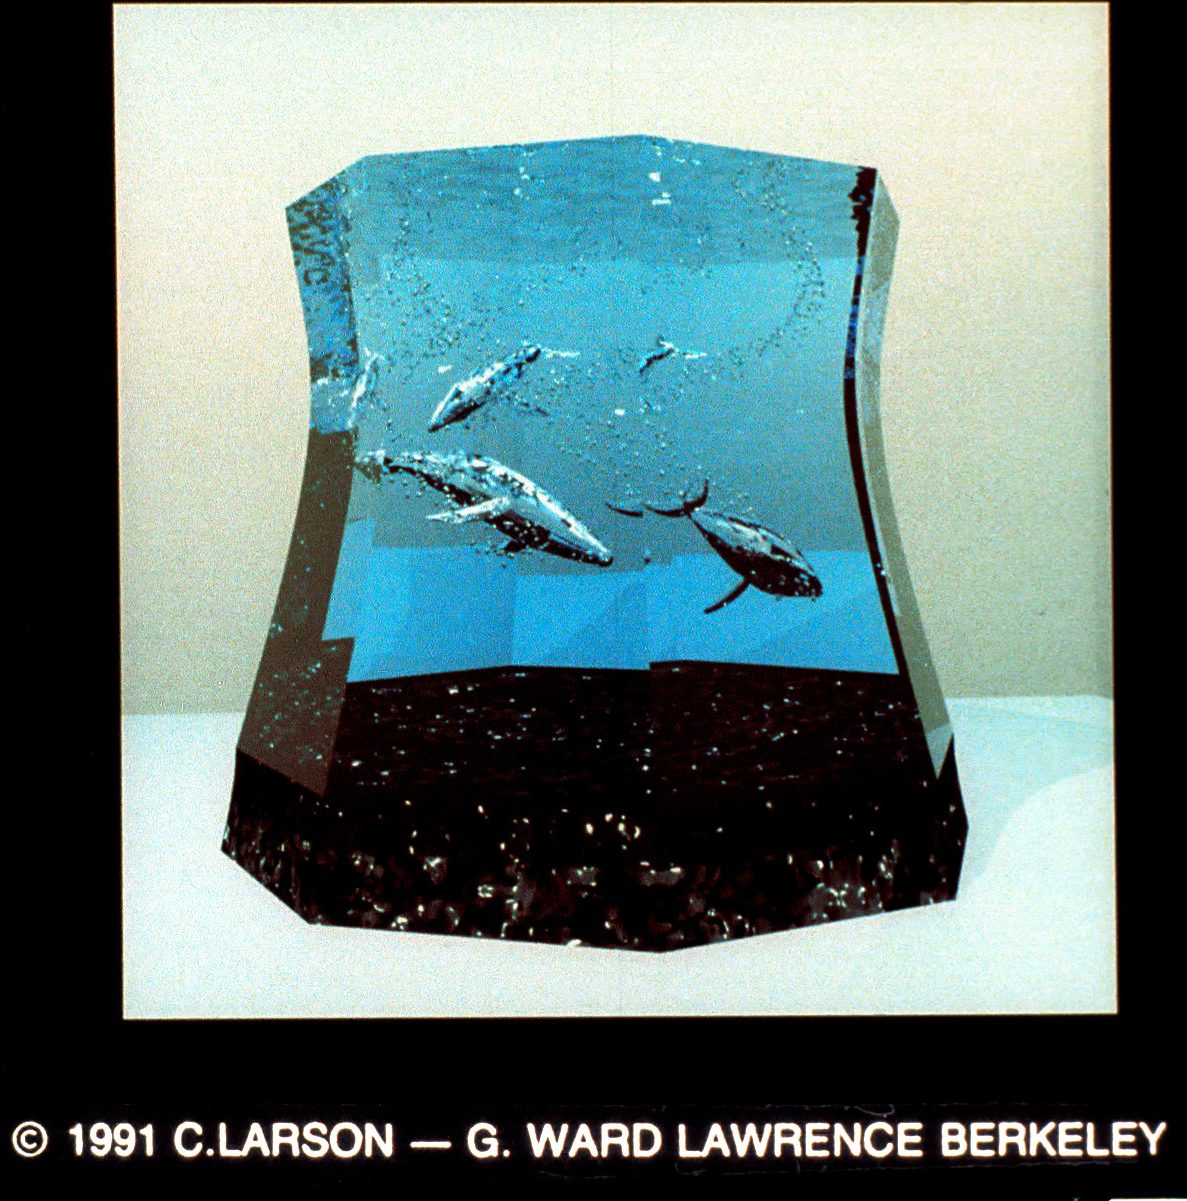
31&32. Pod Life by Cindy Larson, Greg Ward, Seth Teller. Designed in a dream, this is an accurate simulation of a IO foot glass sculpture that cannot be built. The images were created on a Sun, Mac II and SGI using RADIANCE and spline modeler. Contact: Greg Ward, Lawrence Berkeley Laboratory, 1 Cyclotron Rd. 90-3111, Berkeley, CA 94720; (415) 486-4757.
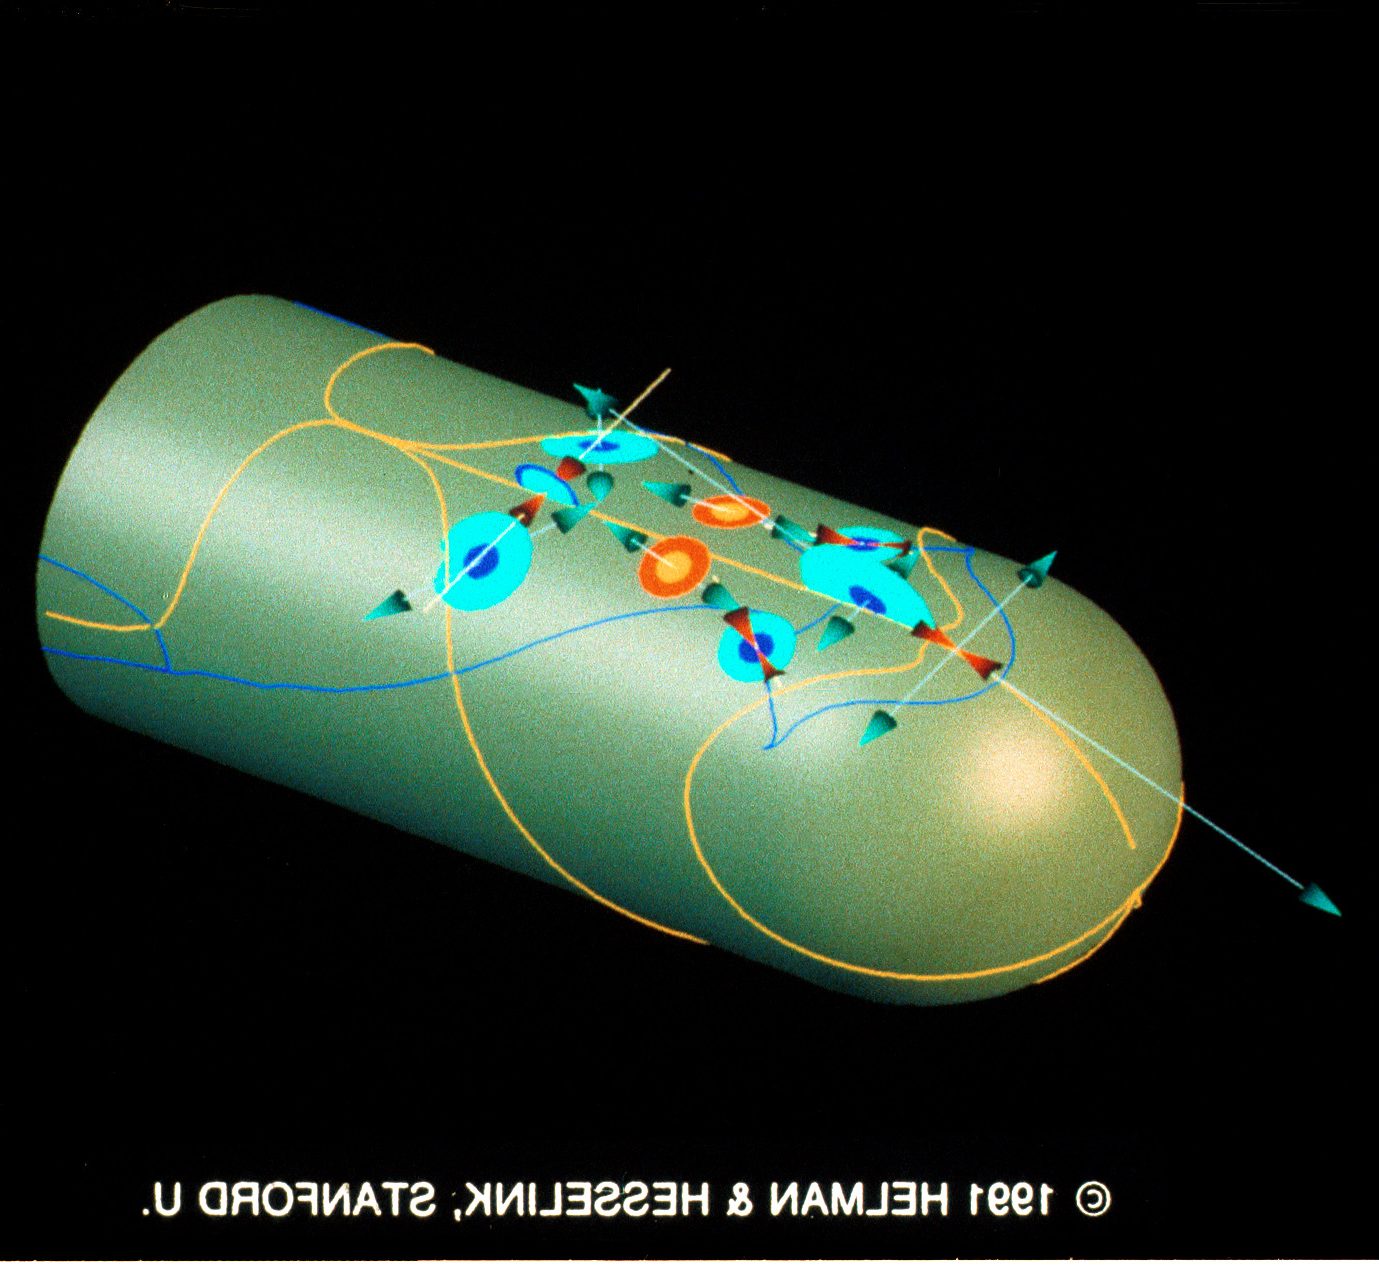
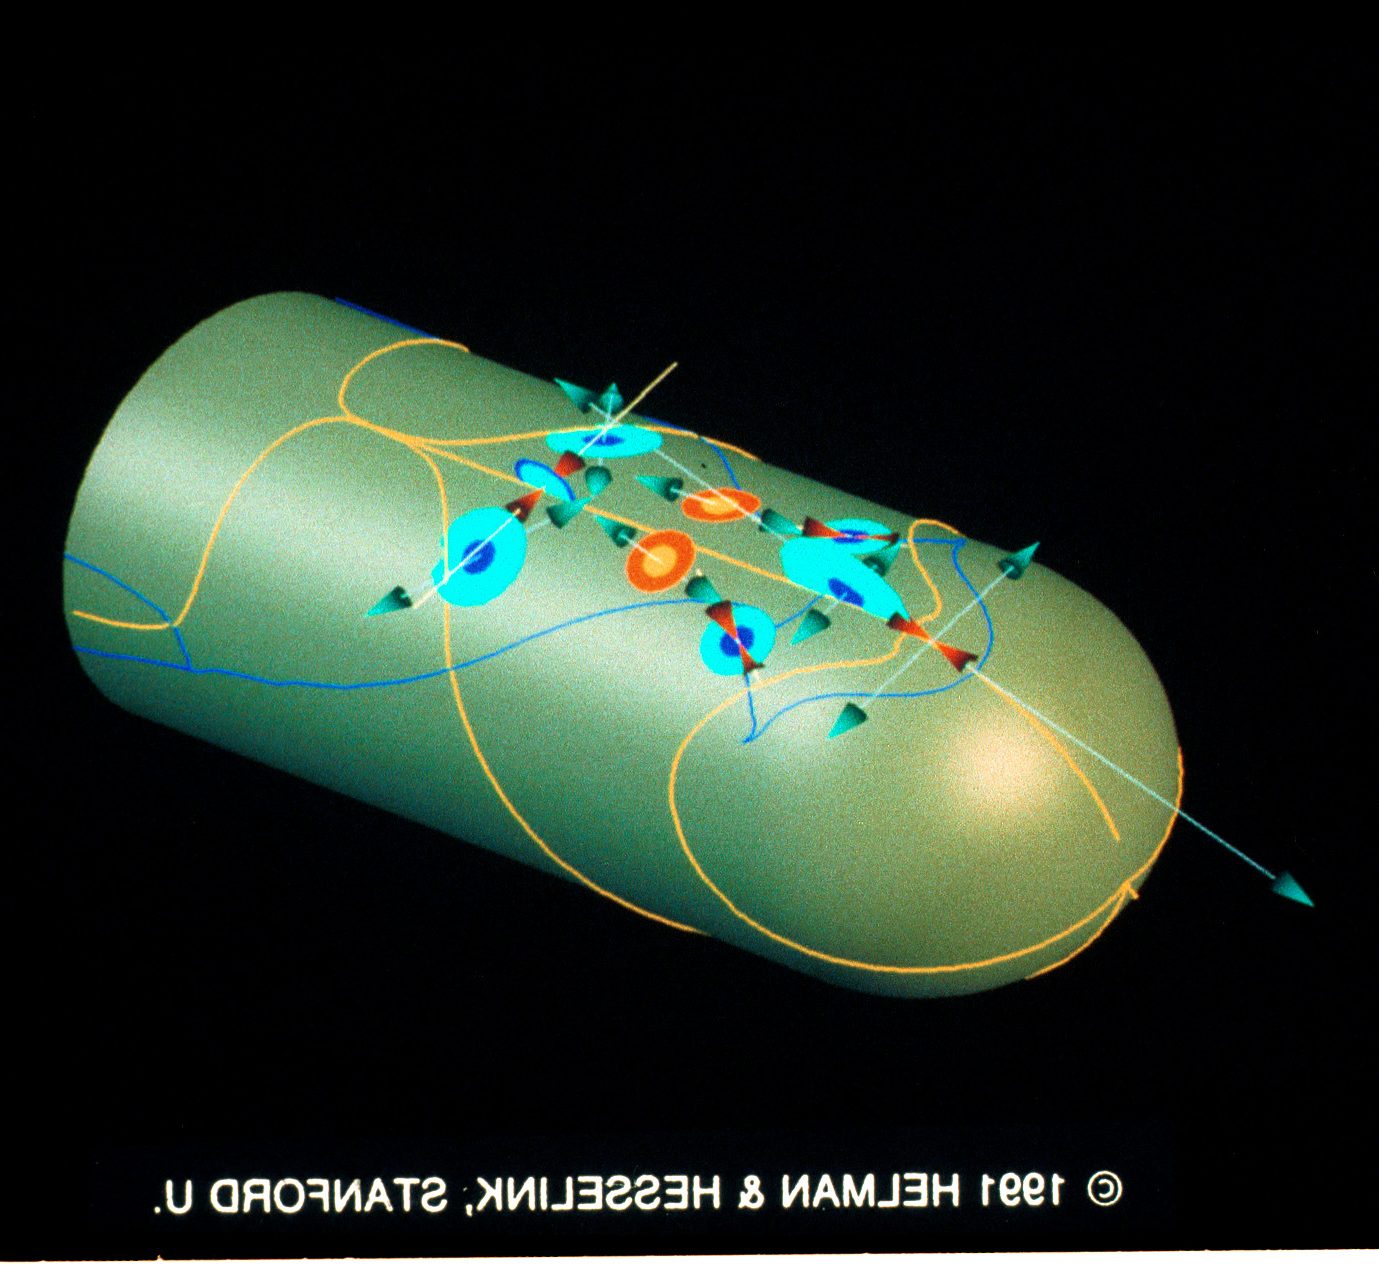
33&34. Hemisphere Cylinder: 3- D Critical Points by James L. Helman, Susan Ying (NASA Ames), Lewis Schiff (NASA Ames), Joseph Steger (NASA Ames). Icons consisting of arrows and disks depict real and complex eigenvalues and eigenvectors at 3-D critical points. They were created on a SGI 4D/220GTX using custom data visualization software. Contact: James L. Helman, c/o Aero/ Astro Department, Stanford University, Stanford, CA 94305; (415) 723- 9127.
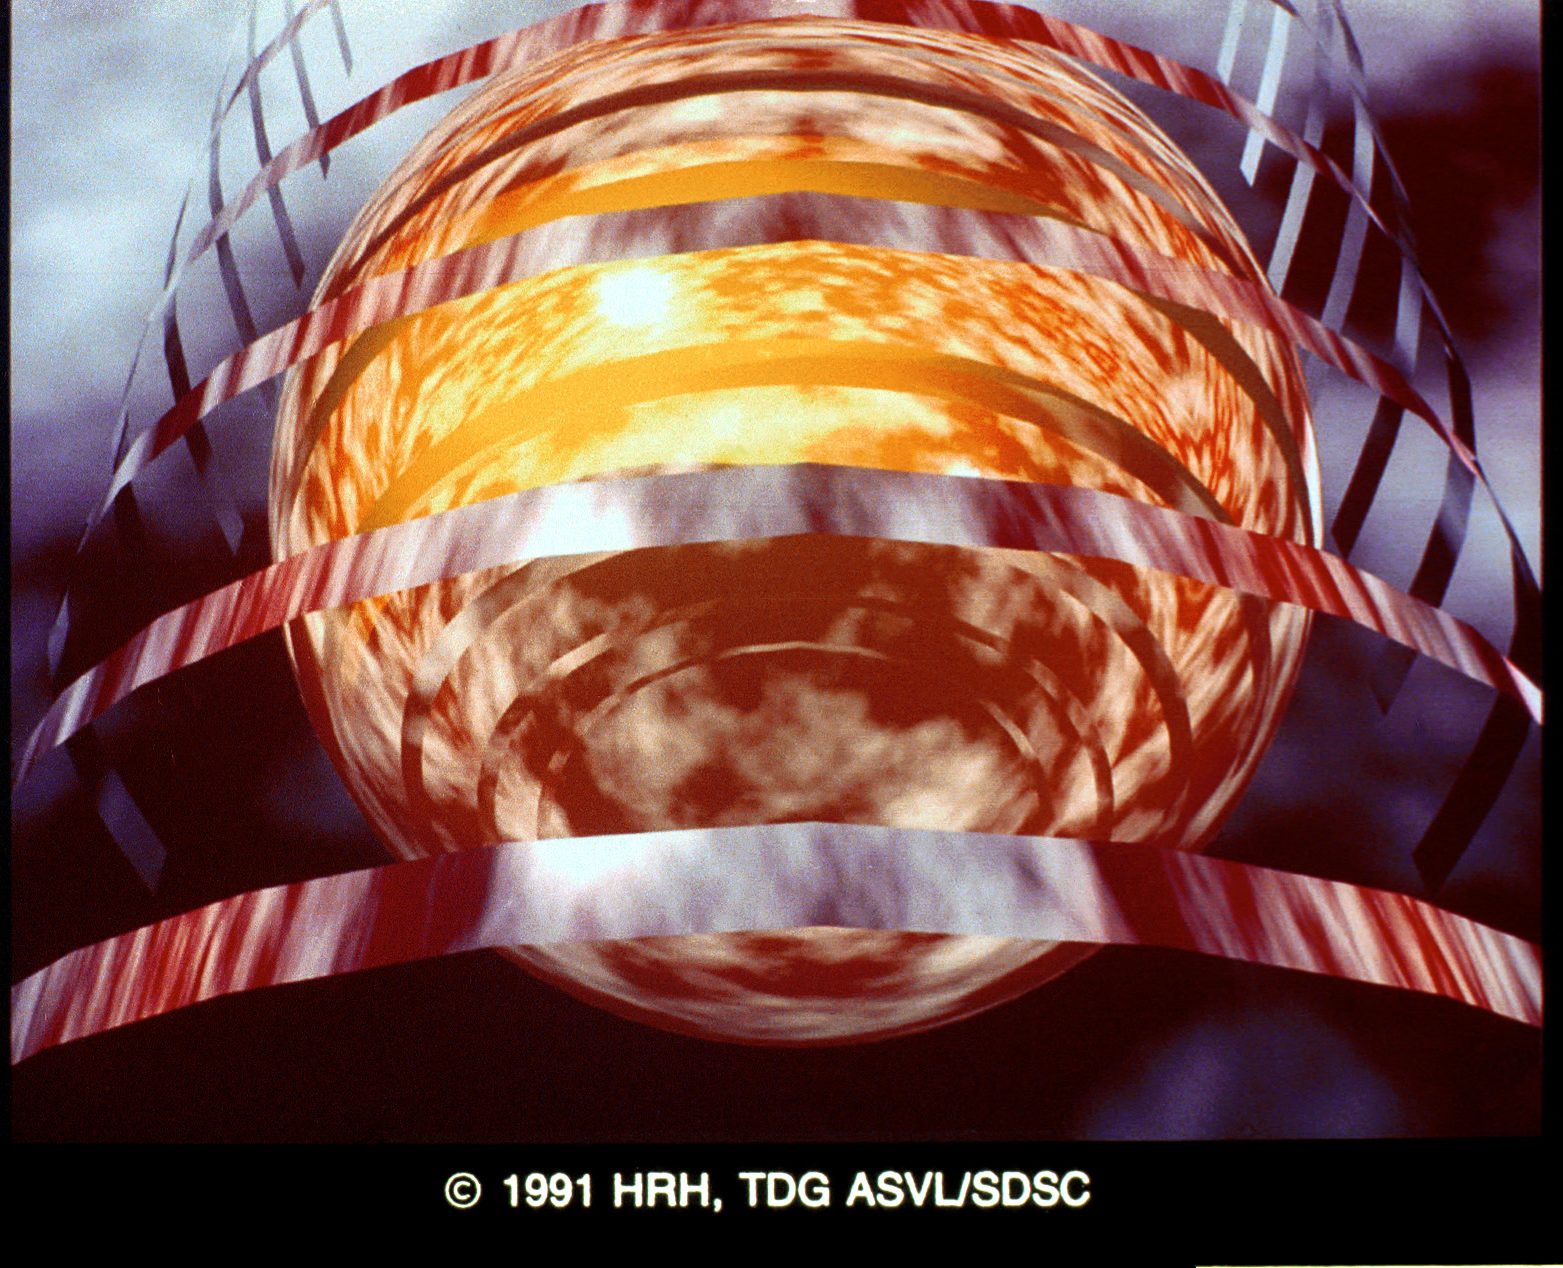
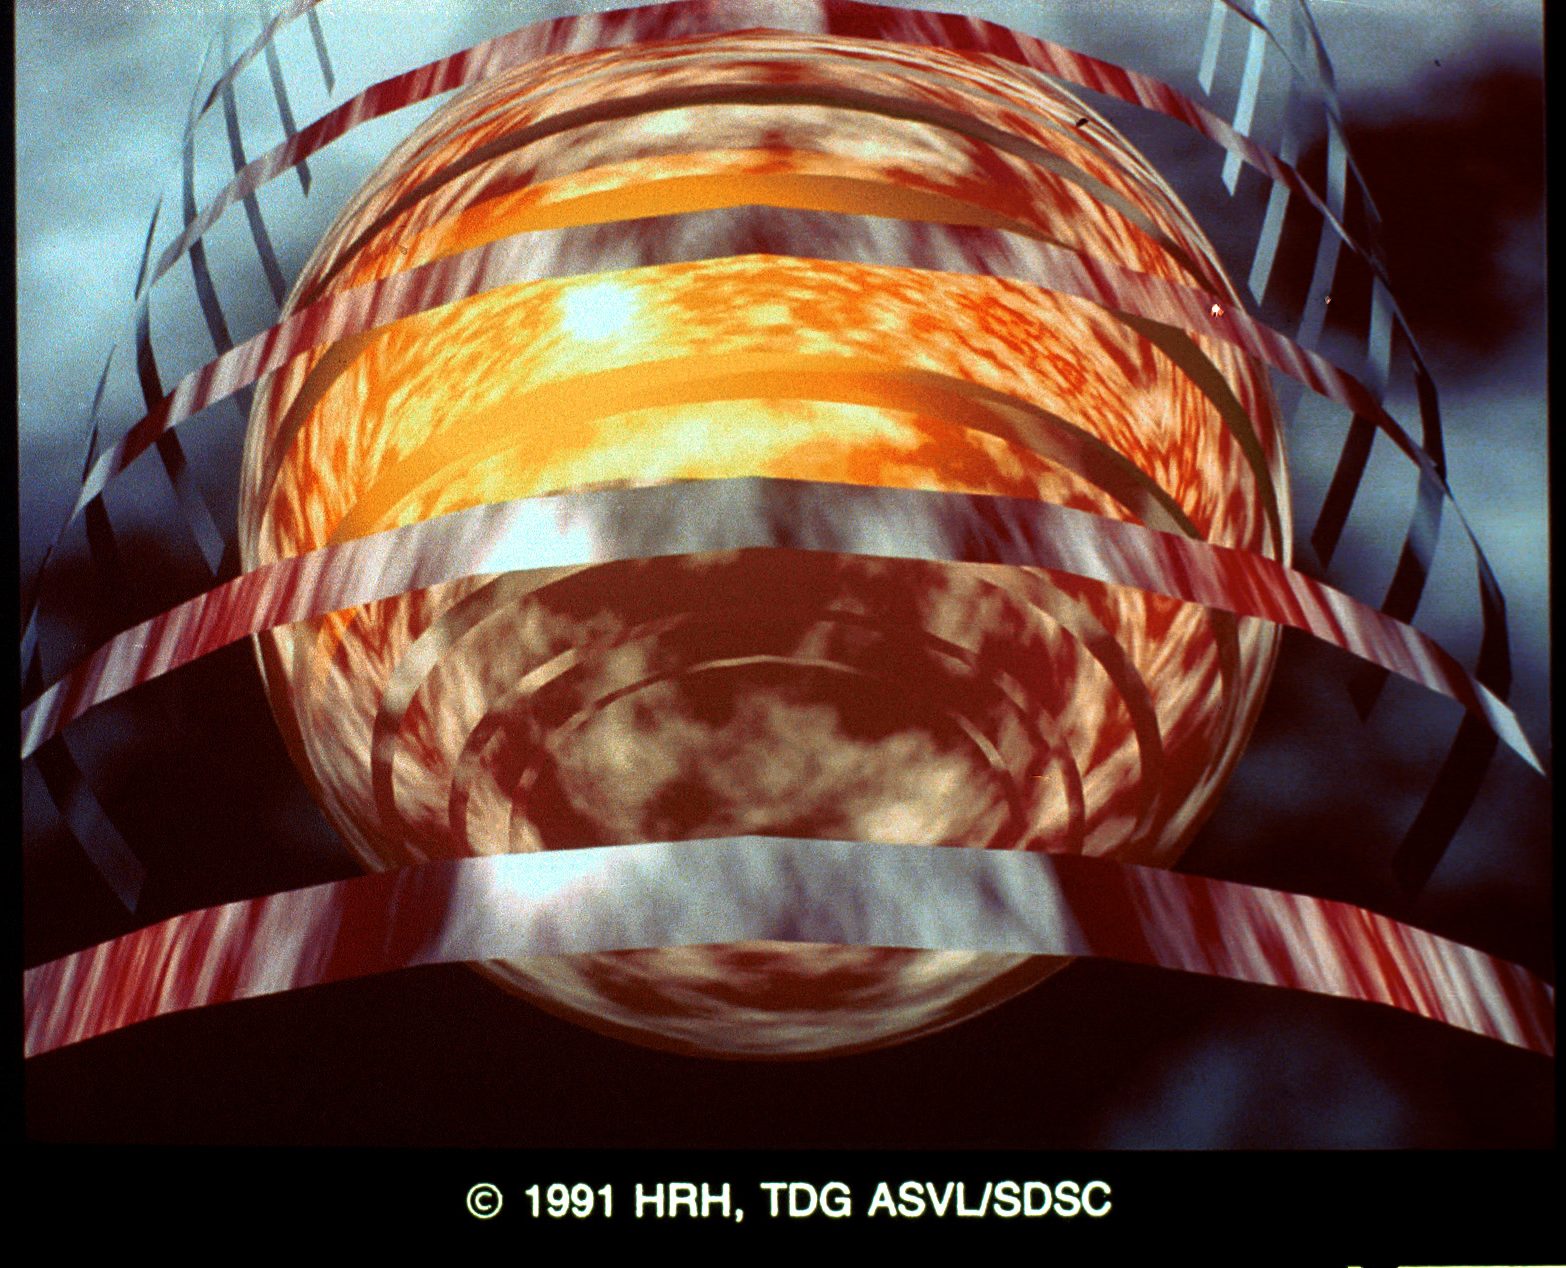
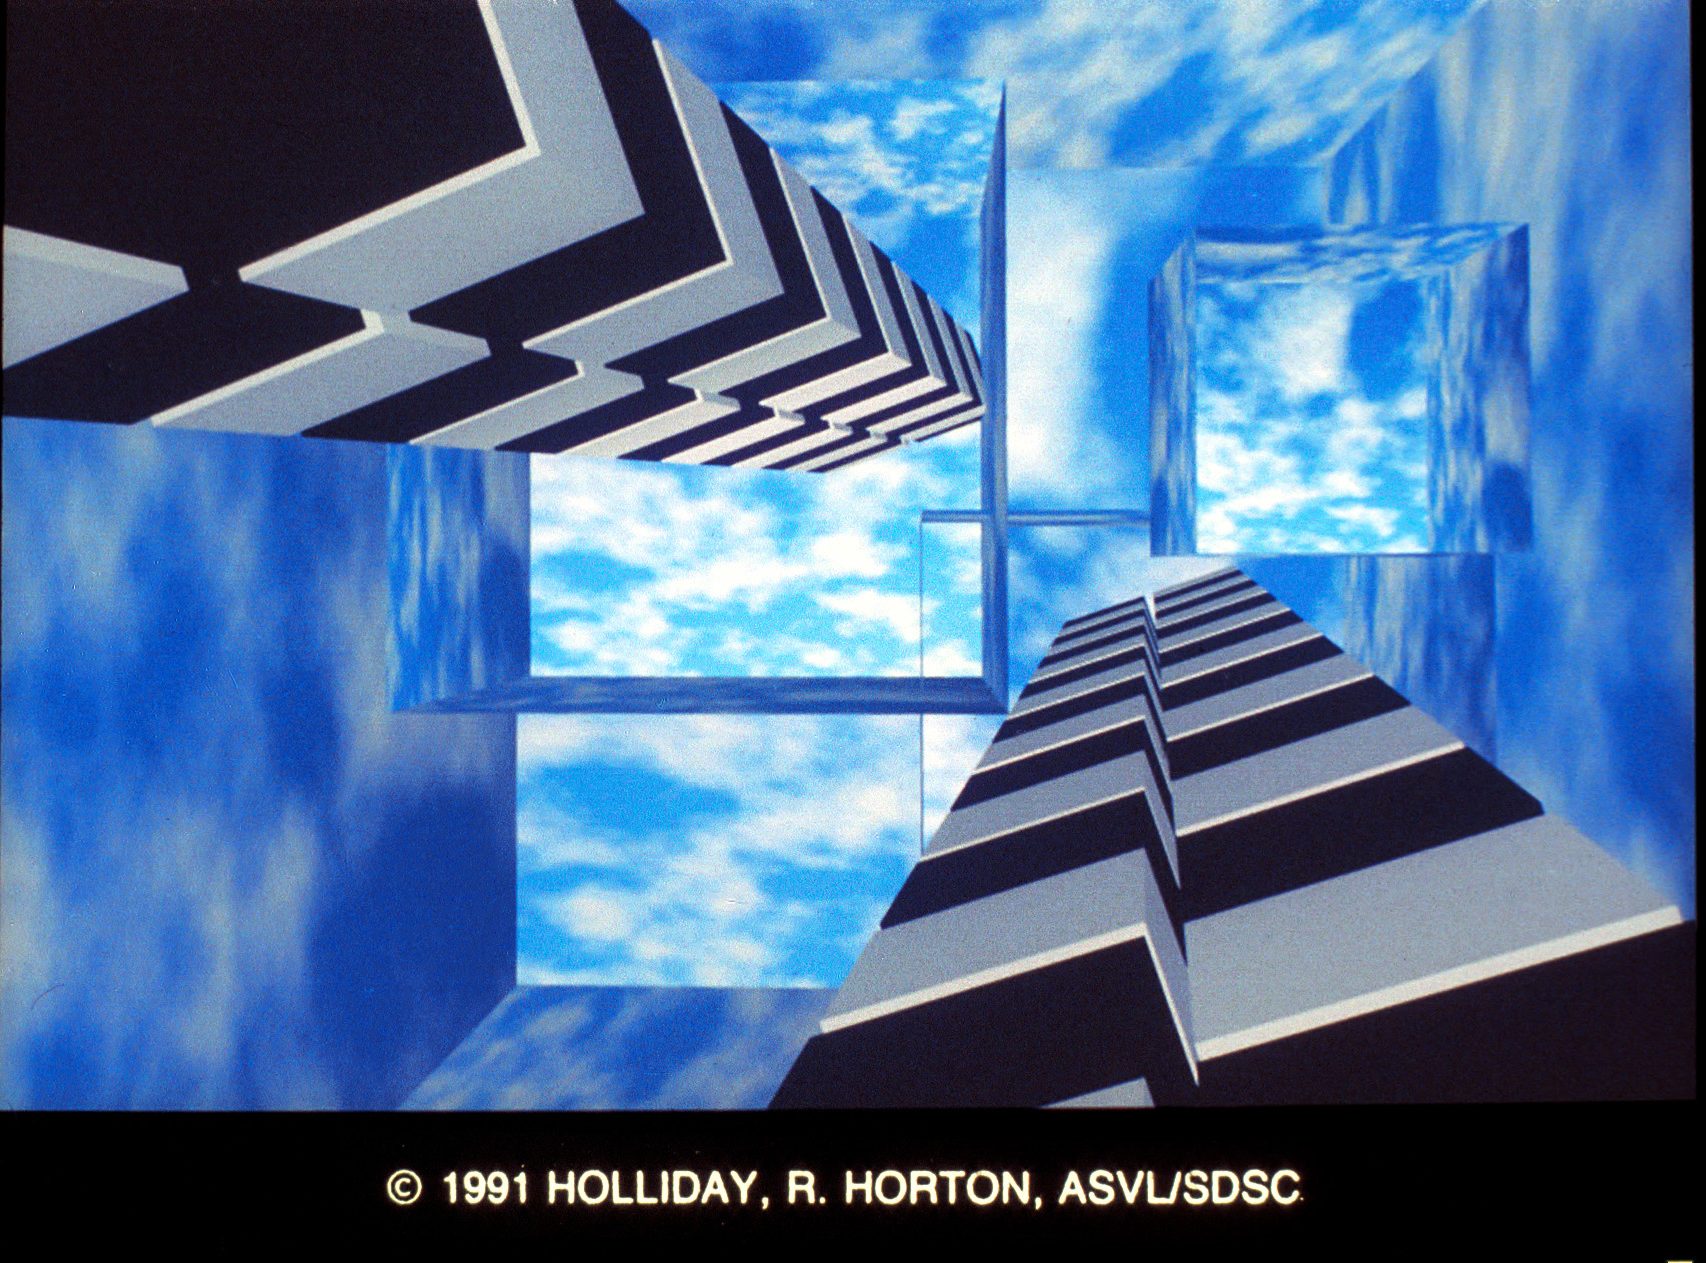
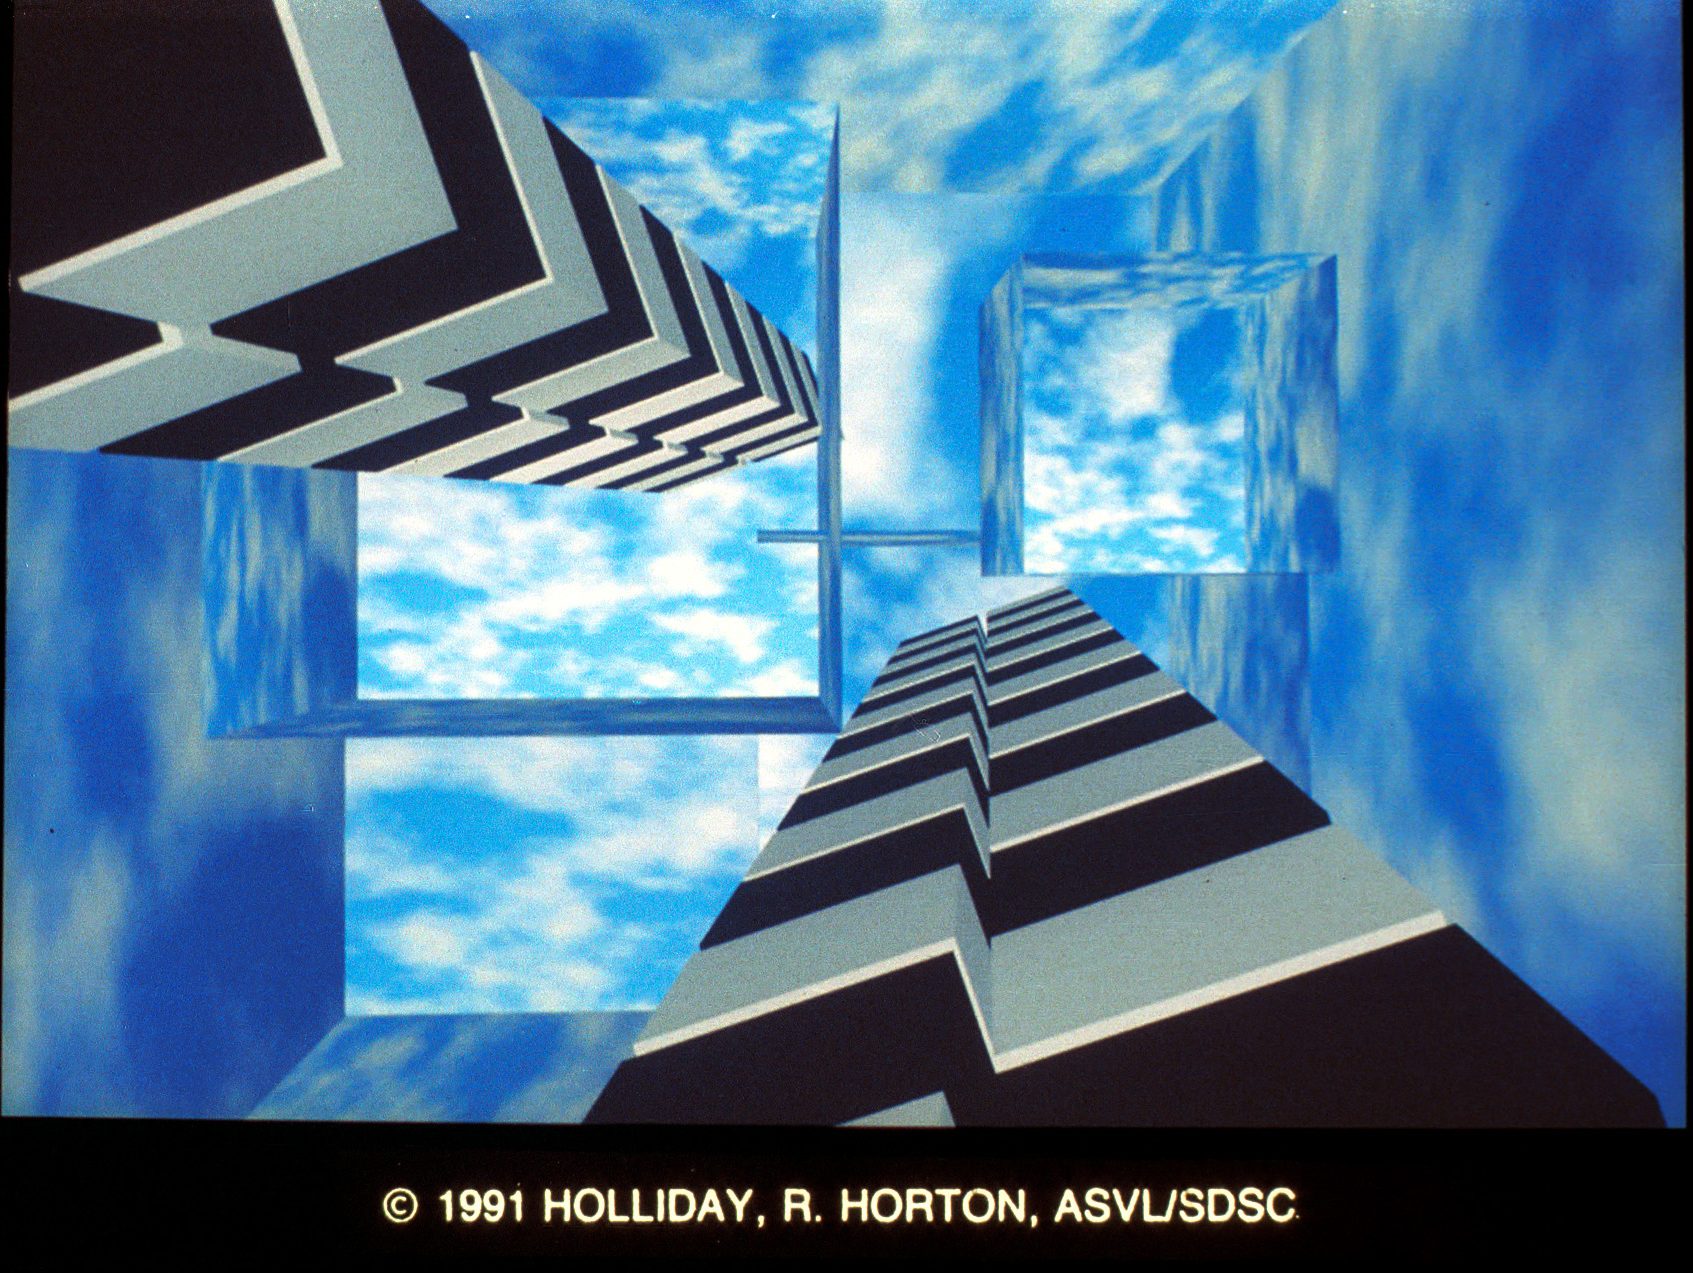
35&36. ZOOM by Holliday R. Horton. This stereo pair was an experiment with changing the focal length of the camera and using zoom. They were created on a SGI 21 0VGX using Alias Research software. Contact: Holliday R. Horton, San Diego Supercomputer Center, 10100 John Hopkins Drive, La Jolla, CA 92037; (619) 534-5037.
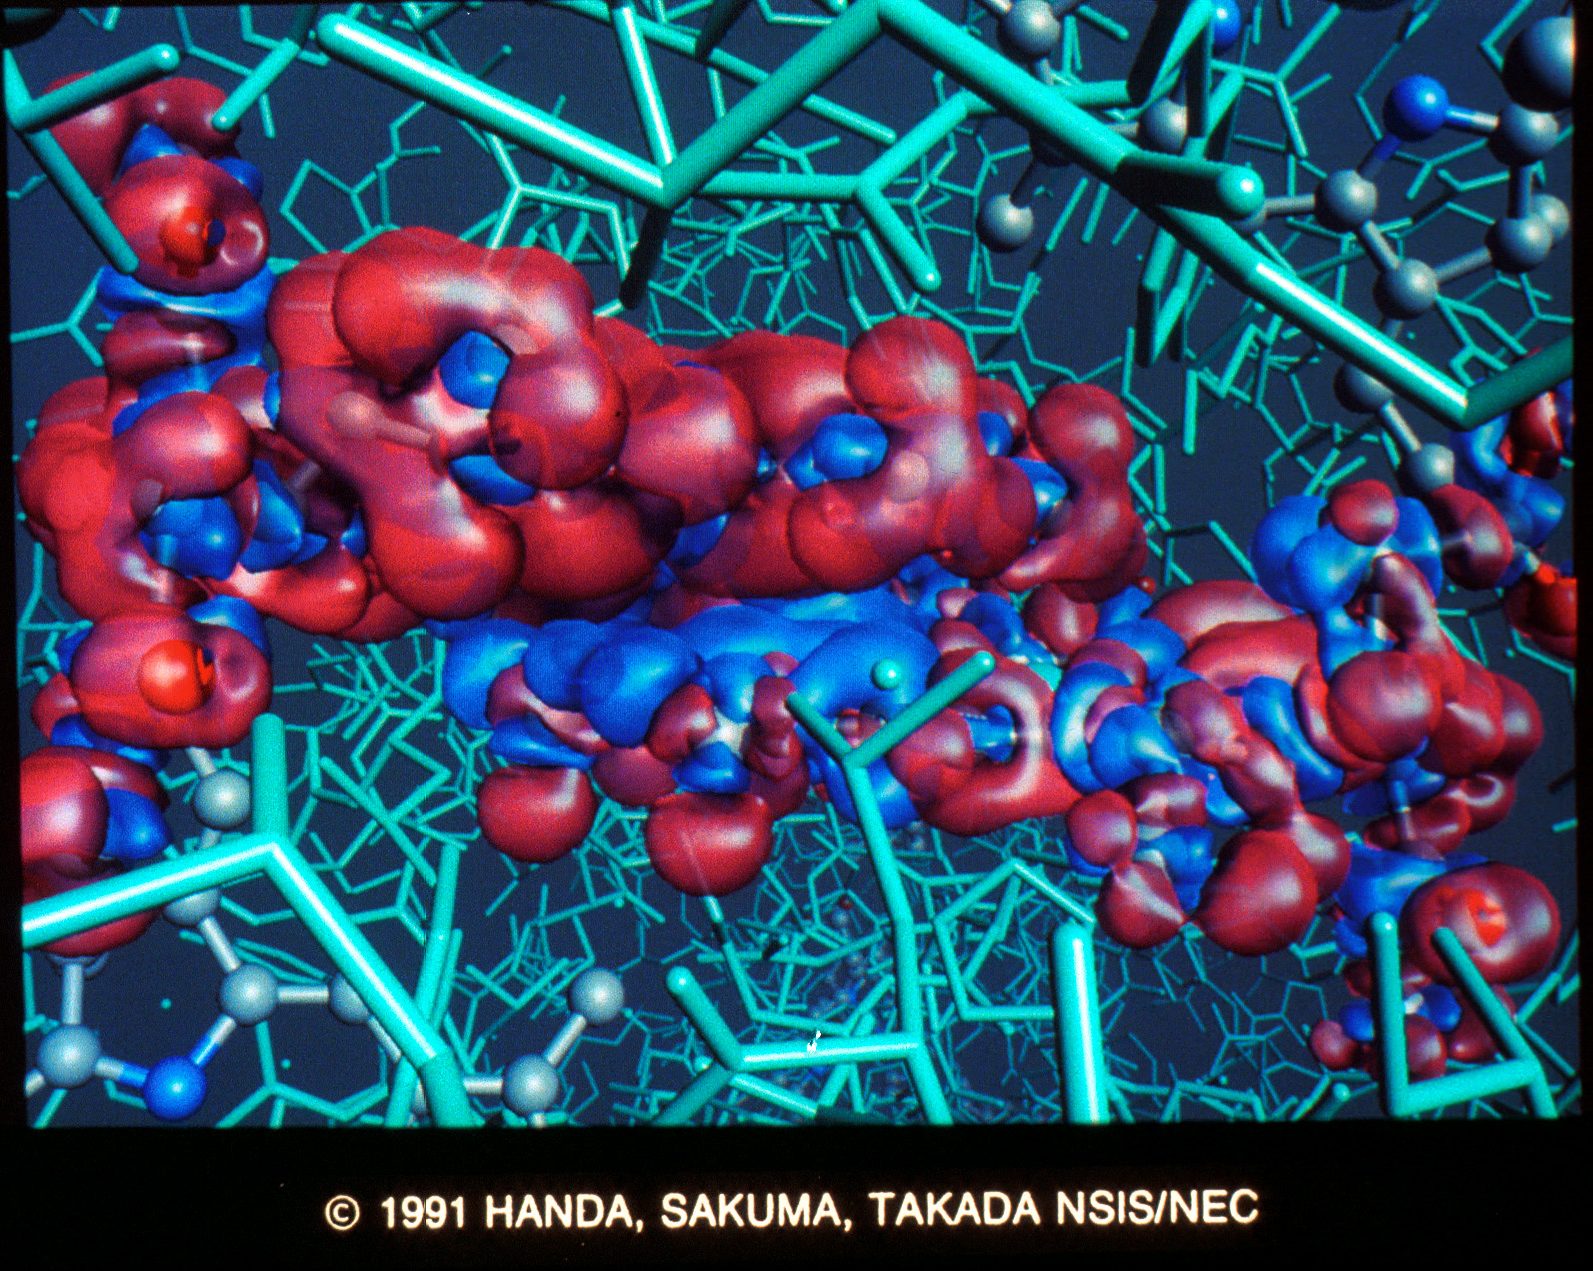
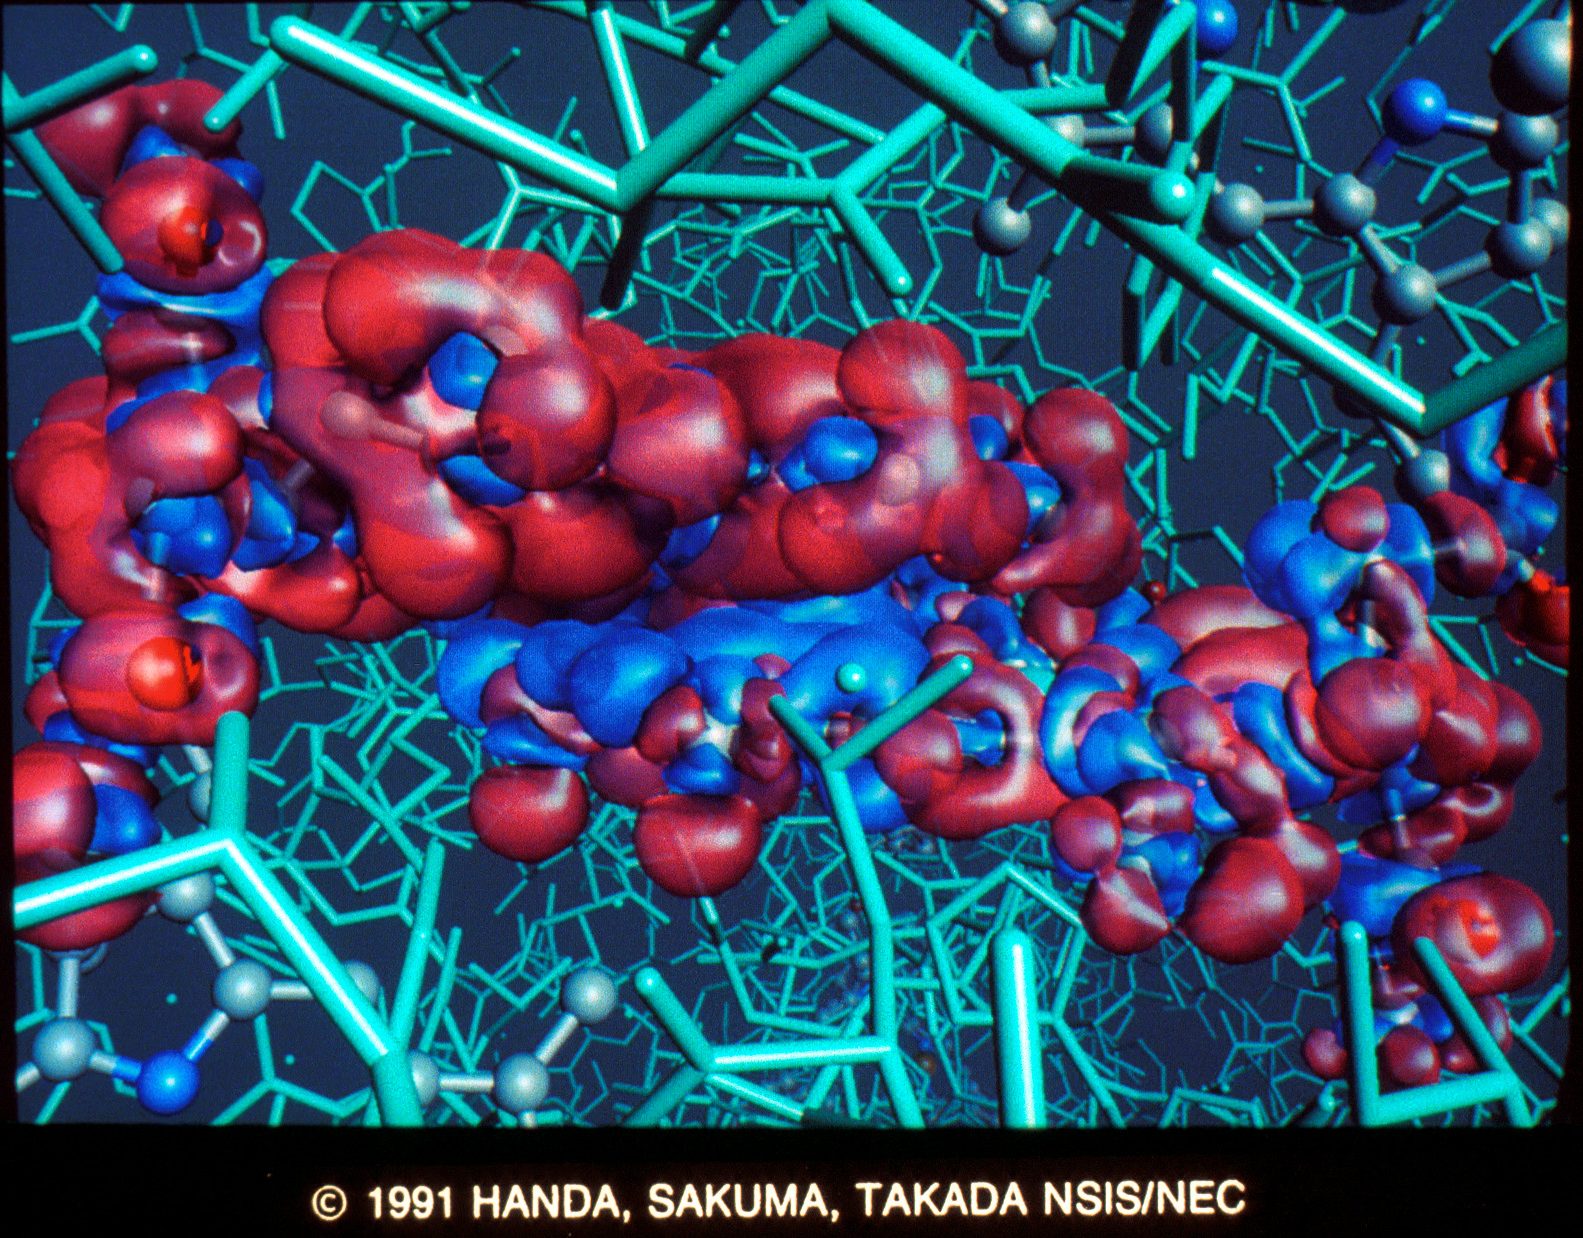
37&38. Difference Between Two States of CHI..2 by Susumu Handa, Toshihiro Sakuma, Toshikazu Takada. This pair shows the difference between the neutral and ionized electronic states of the chlorophyll dimer in the photosynthetic reaction center. Coordinates are determined by J. Deisenhofer et al. The translucent iso-value surfaces are shown with the mist effect. AMOSS, abinito molecular orbital calculation program developed by the NEC quantum chemistry group, was used to obtain the electron density data. The images were generated using vrms, which is an in-house volume rendering program. They were created on a Stardent (Titan) 3000. Contact: Susumu Handa, NSIS & NEC Corporation, 34 Miyukigaoka, Tsukuba, lbaraki 305 Japan; 298-56-6155.
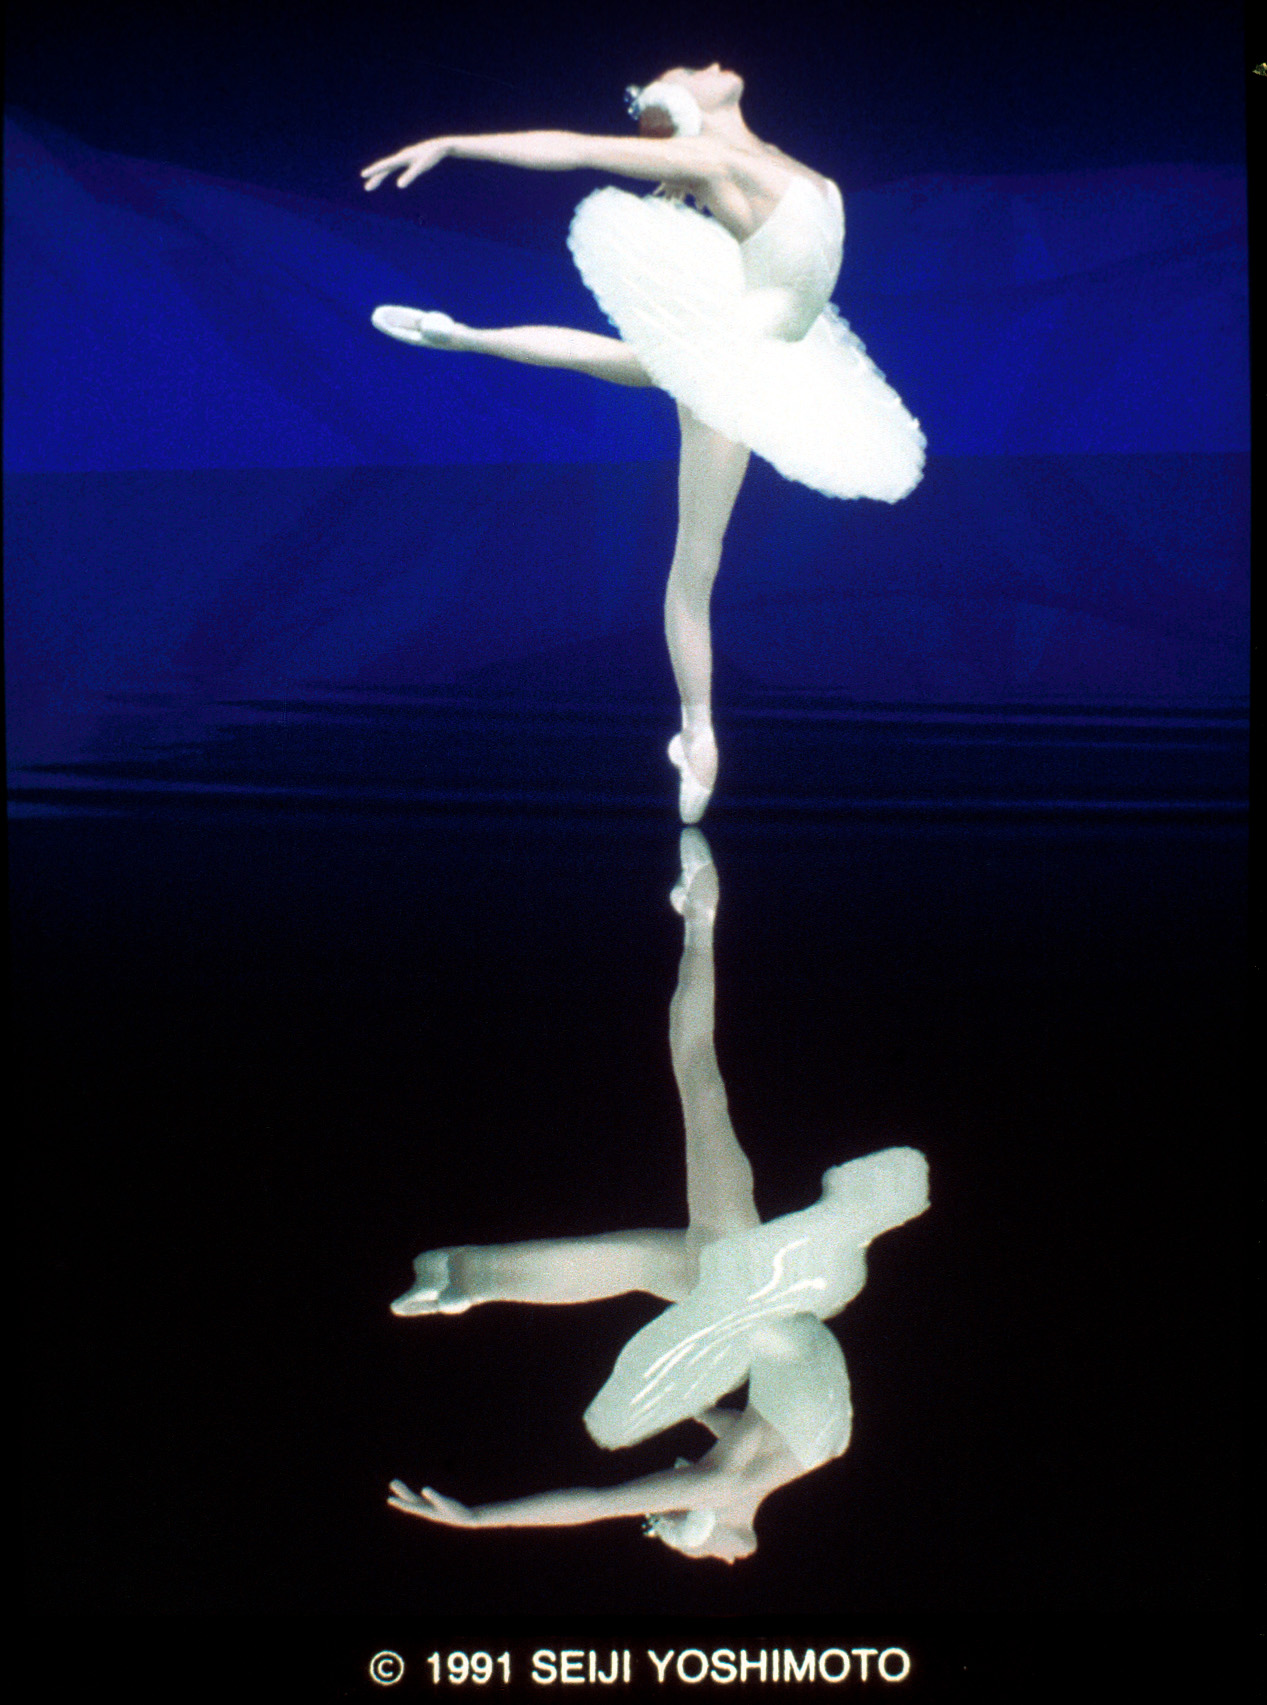
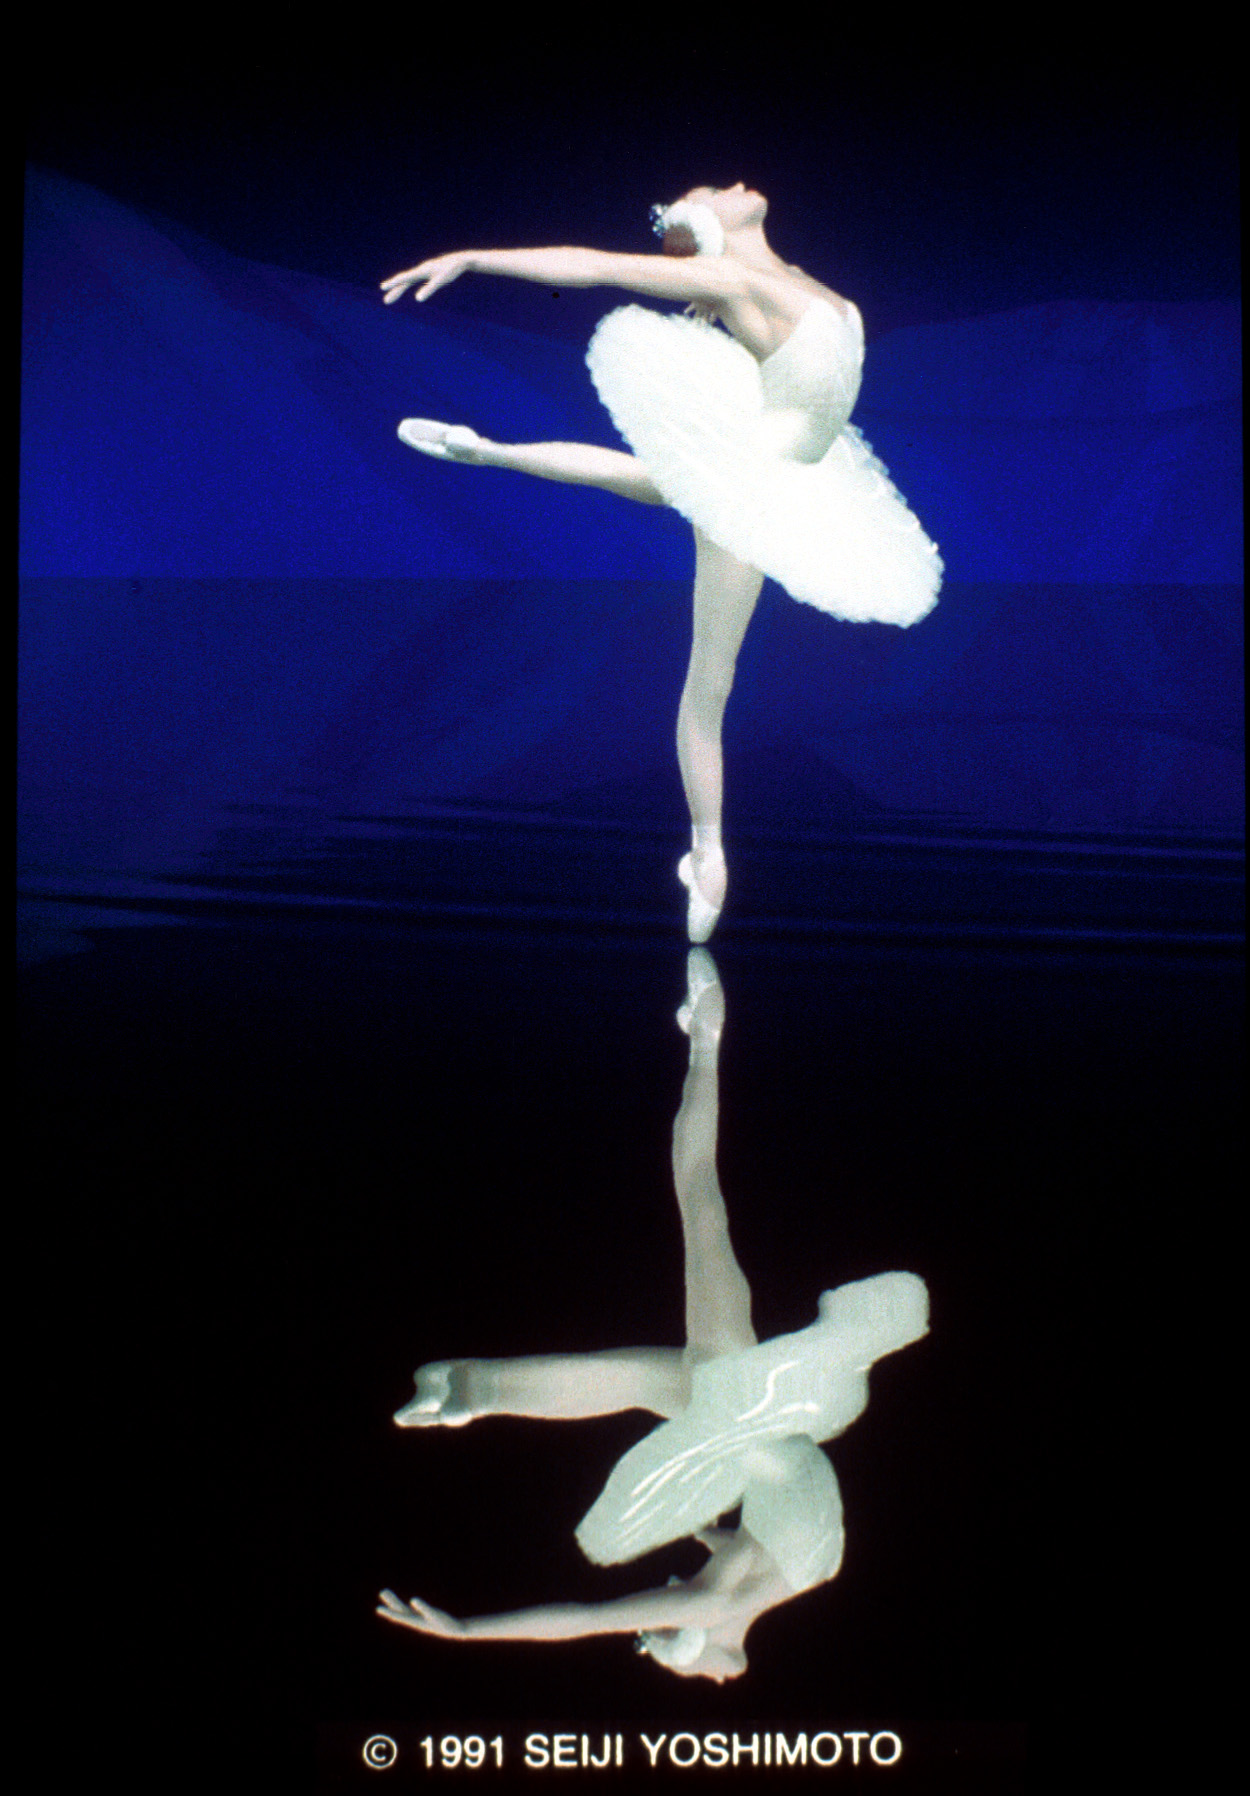
39&40. Swan Lake by Seiji Yoshimoto. These are pure computer generated images using 3D mathematical models and ray tracing. The beautiful ballerina dancing on the lake is composed of about 500 mathematical ellipsoids. The images were created on aNECPC9801 RA21 (with 387) using Personal Links “Tracy.” Contact: Seiji Yoshimoto, NEC Corporation Space & Laser Communications Division, 4035 lkebe-cho, Midori-ku, Yokohama, Japan; 81-45-939-2271.
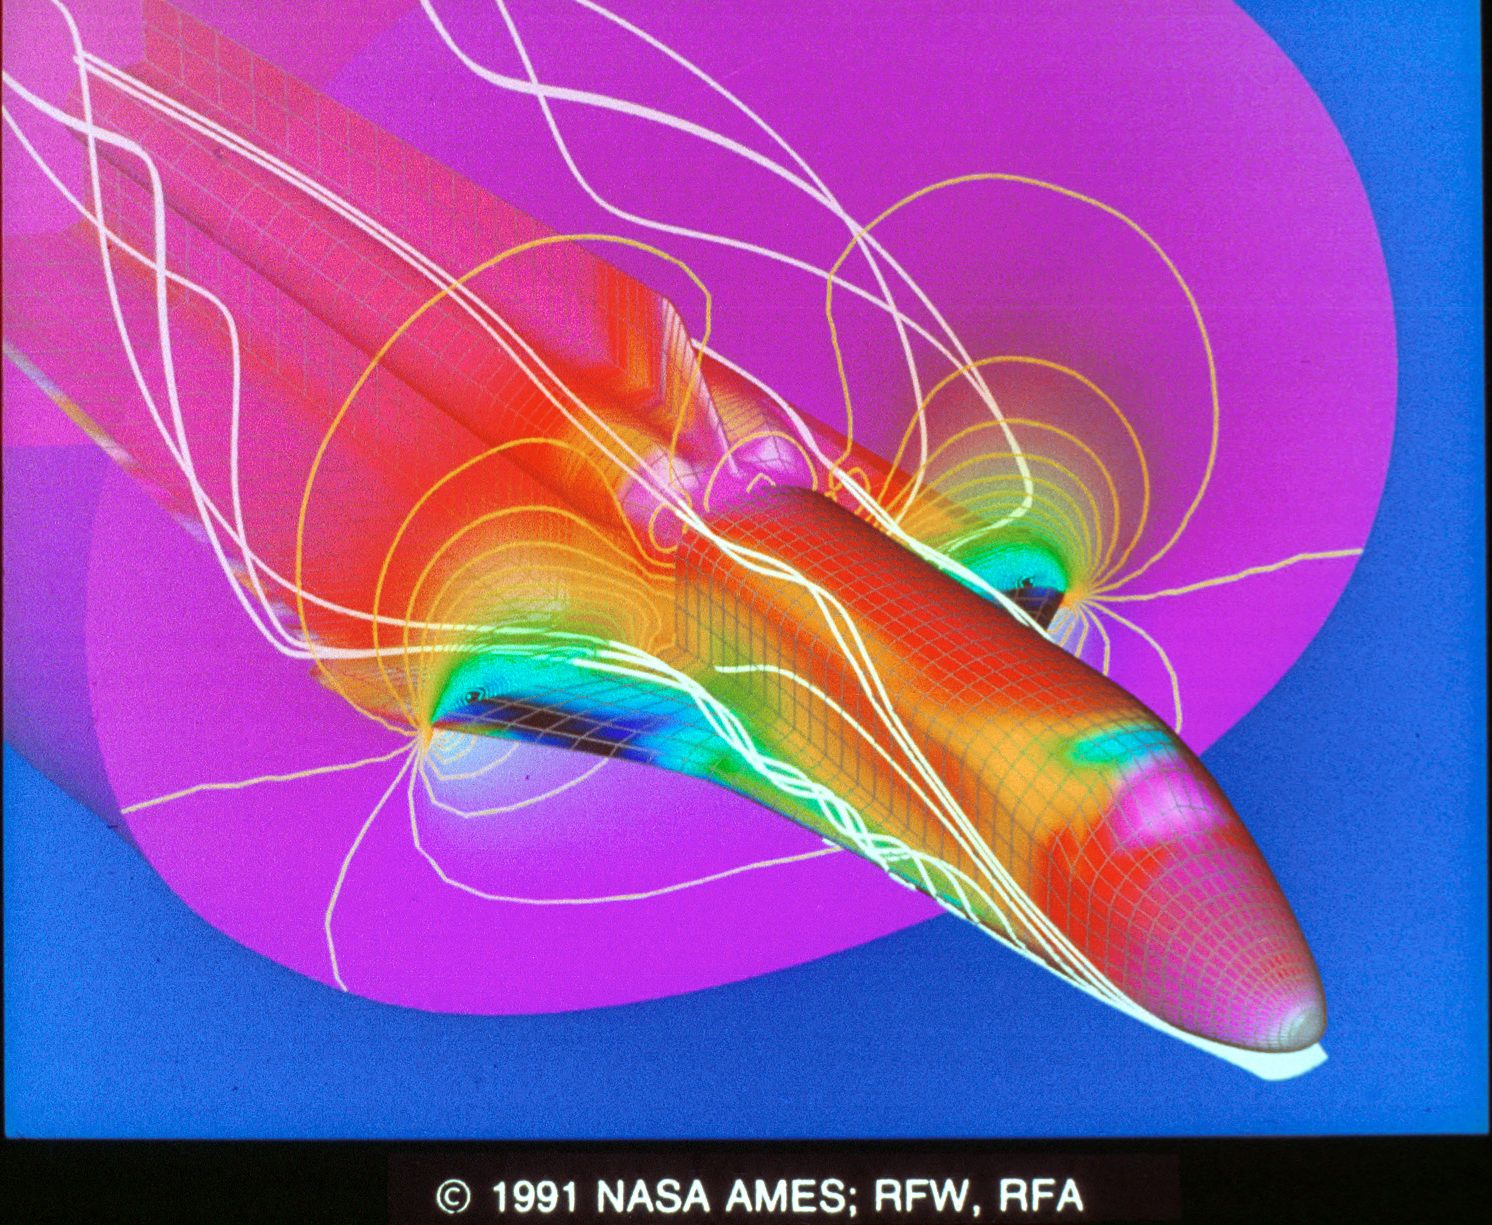
41&42. Fast Shuttle by Kevin McCabe, Todd Plessel, Yehia Rizk, Pieter Buning, Vee Collet. These images show pressure surfaces on shuttle orbitor with pressure contours and particle traces. They were created on a SGI 320VGX using Flow Analysis Software Tool Kit. Contact: Vee Collet, Sterling Software at NASA Ames, MS 258- 2, Moffett Field, CA 94035; (415) 604-4450.
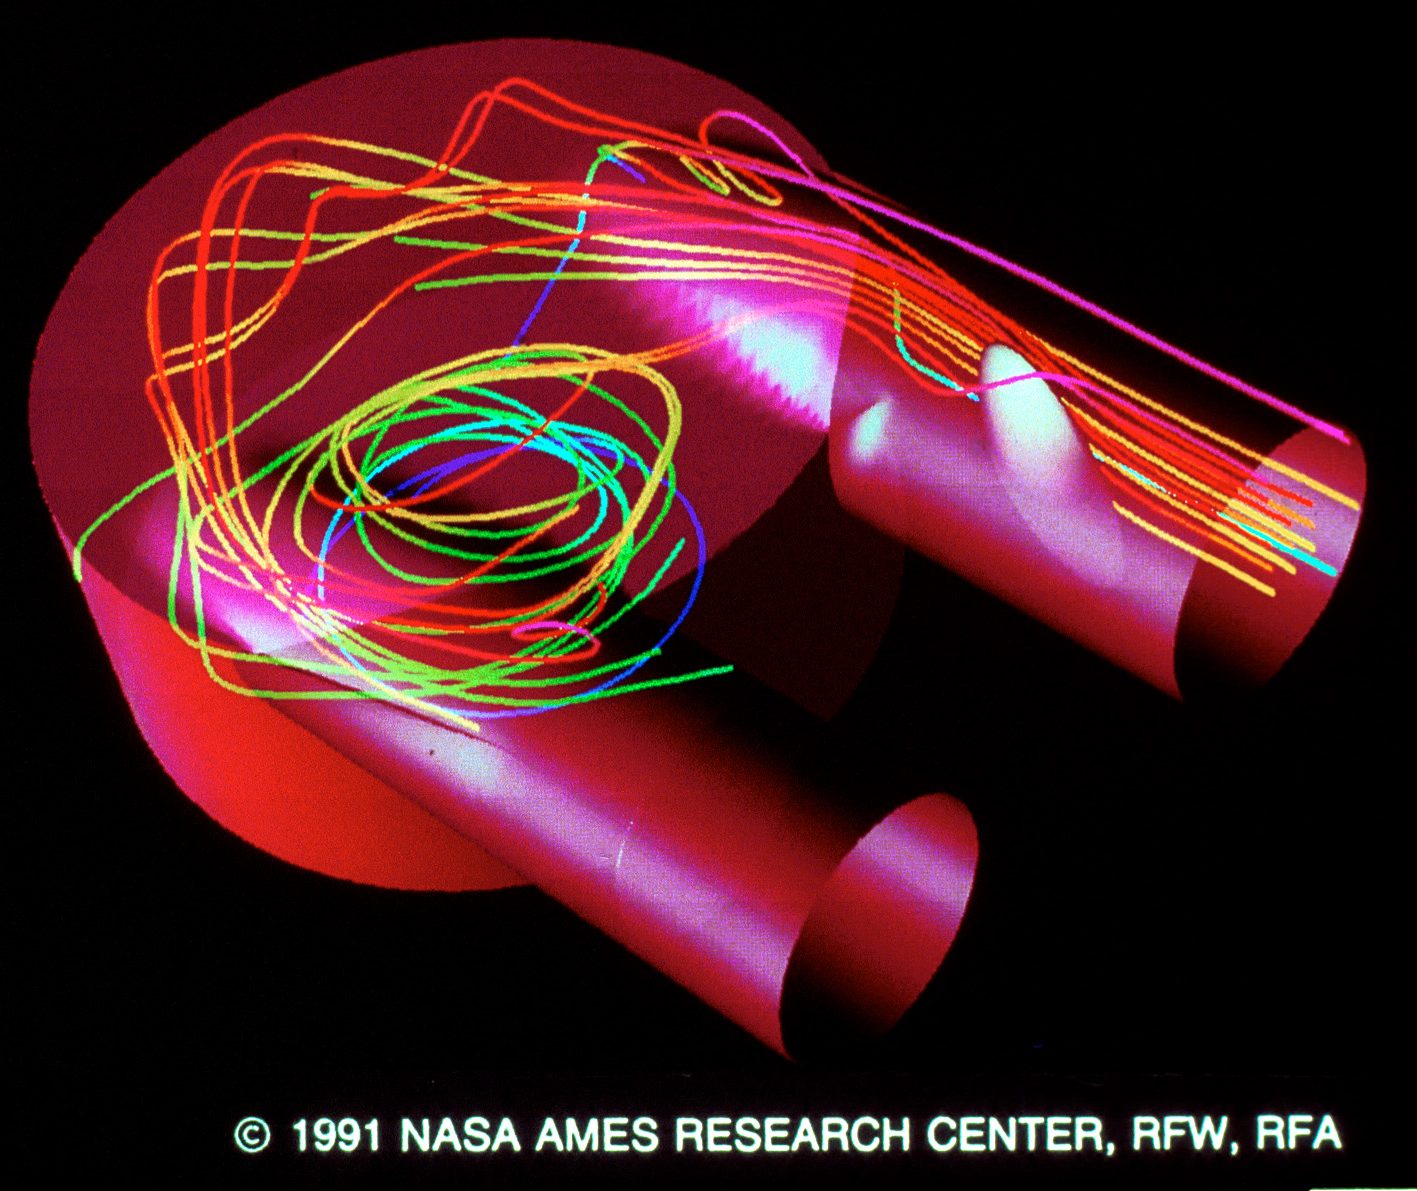
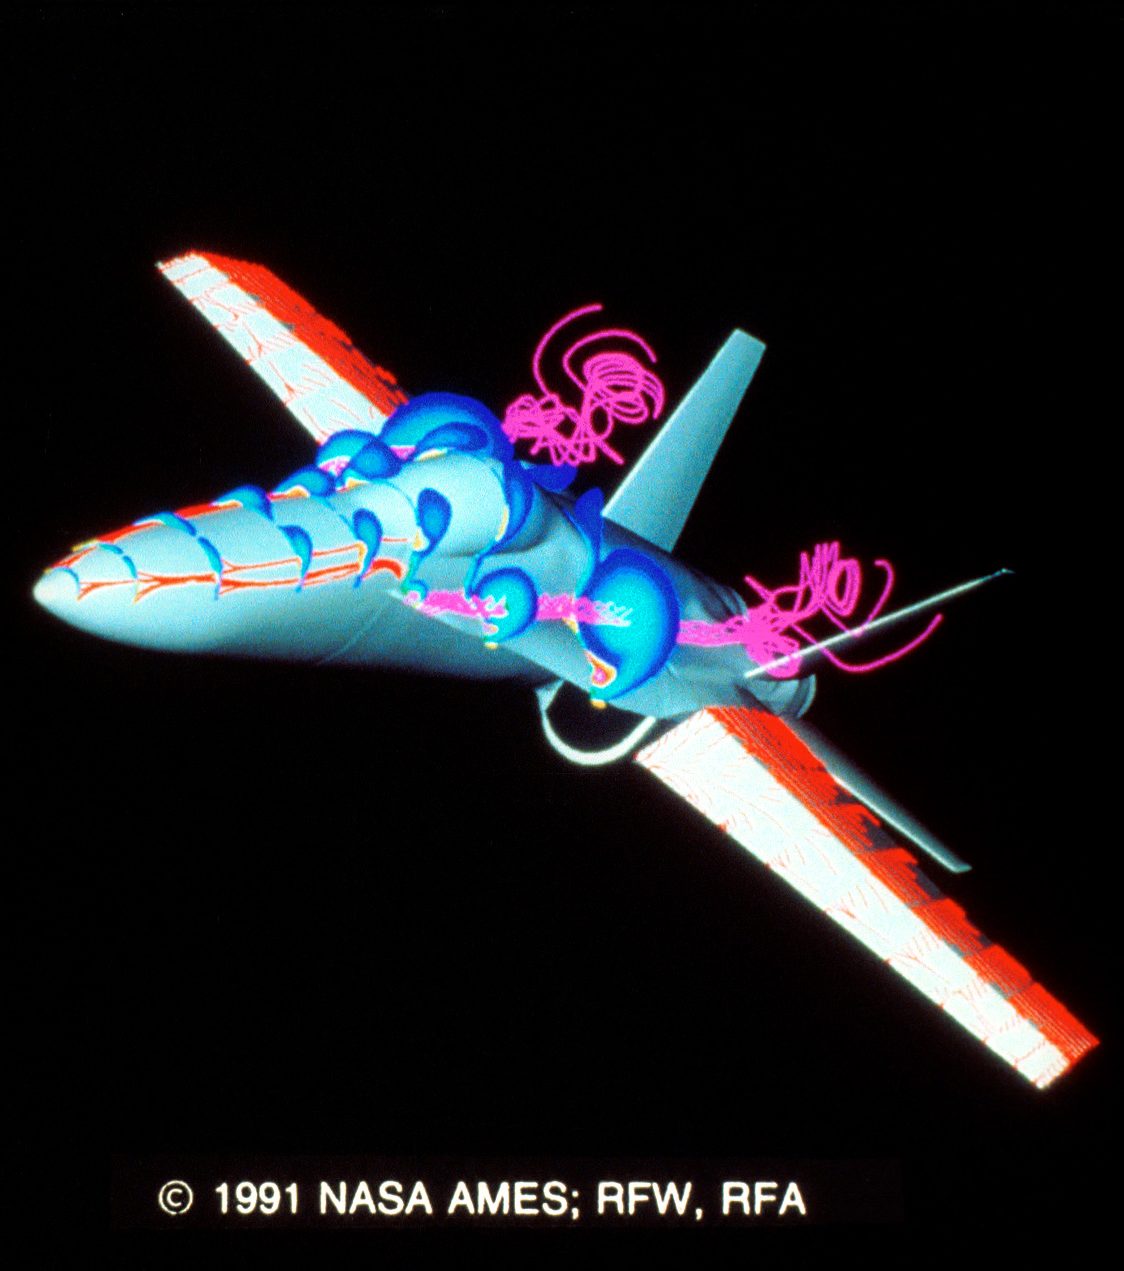
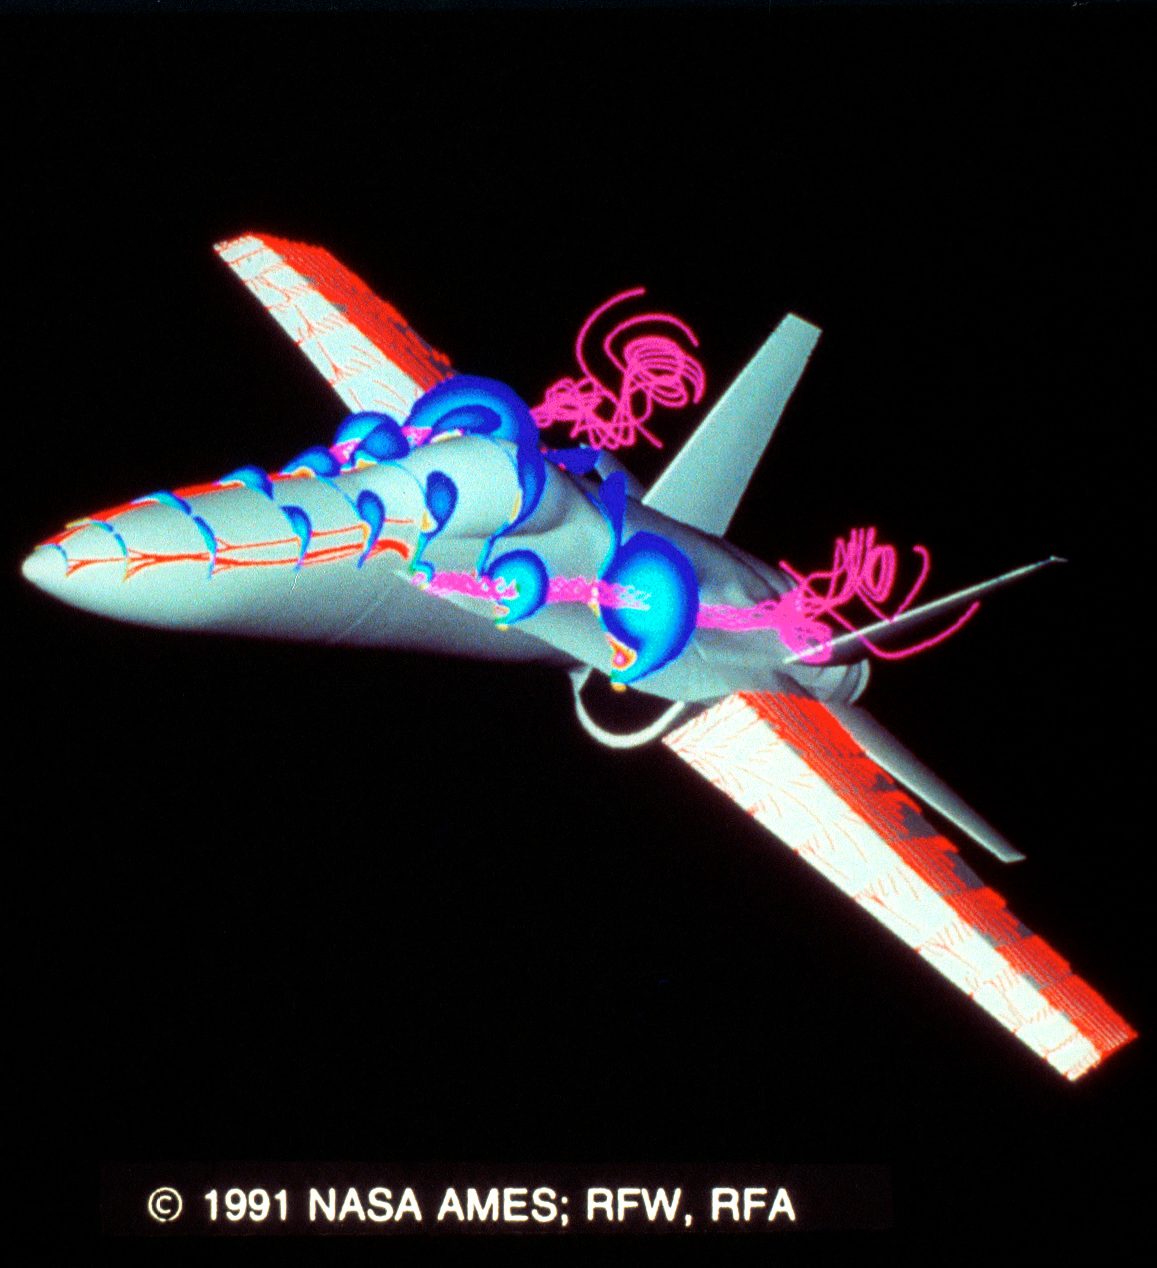
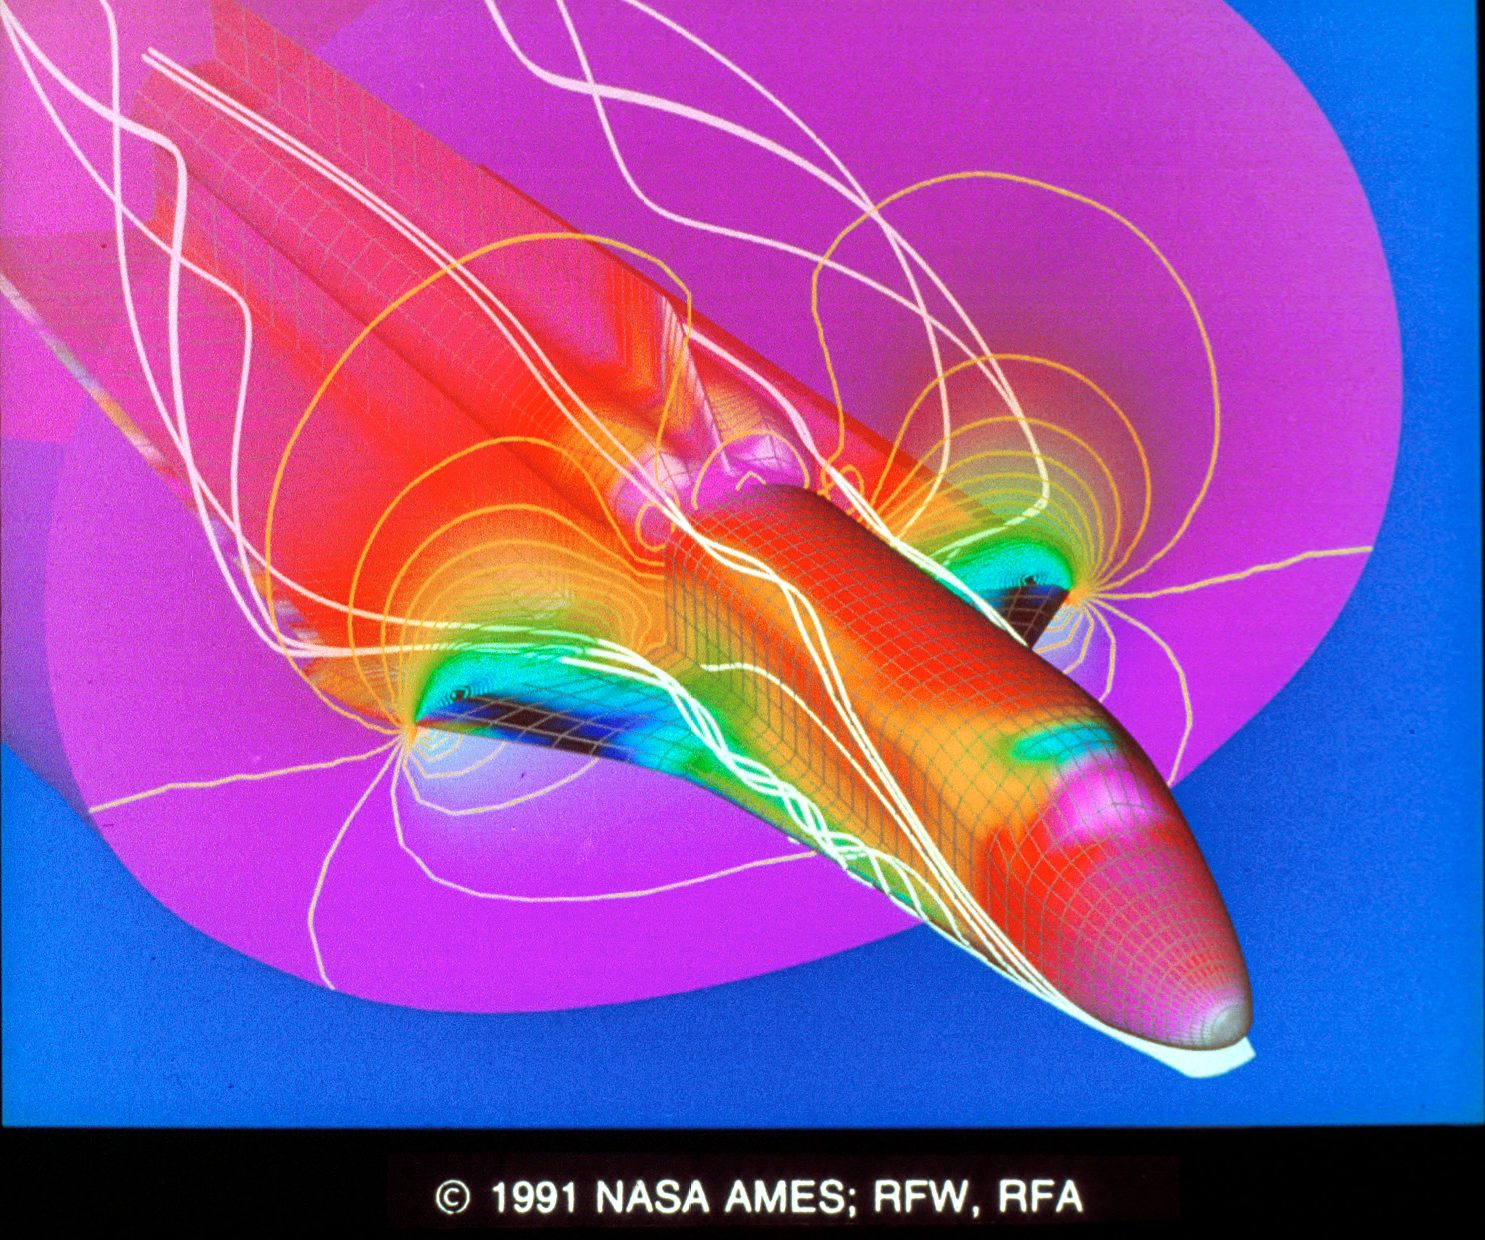
43&44. Simulated Flow Field about the F-18 by Ken Gee, Chris Gong, Yehia Rizk, Lewis Schiff. The stereo slides show the flowfield around the F-18 aircraft at 30 degrees angle of attack and full scale Reynolds number. The red traces represent the simulated oil flow on the forebody, wing and deflected leading edge flaps. The oil flow shows the lines of primary and secondary separation. The forebody and leading edge extension vortices are visualized using helicity ·density contours. The particle traces, shown in magenta, show the development and burst of the leading edge vortex. The slides were created on a Cray YMP and SGI 4D/70GT using PLOT3D, SURF and GAS. Contact: Chris Gong, Sterling Software at NASA Ames, MS 258-2, Moffett Field, CA 94035; (415) 604-4459.
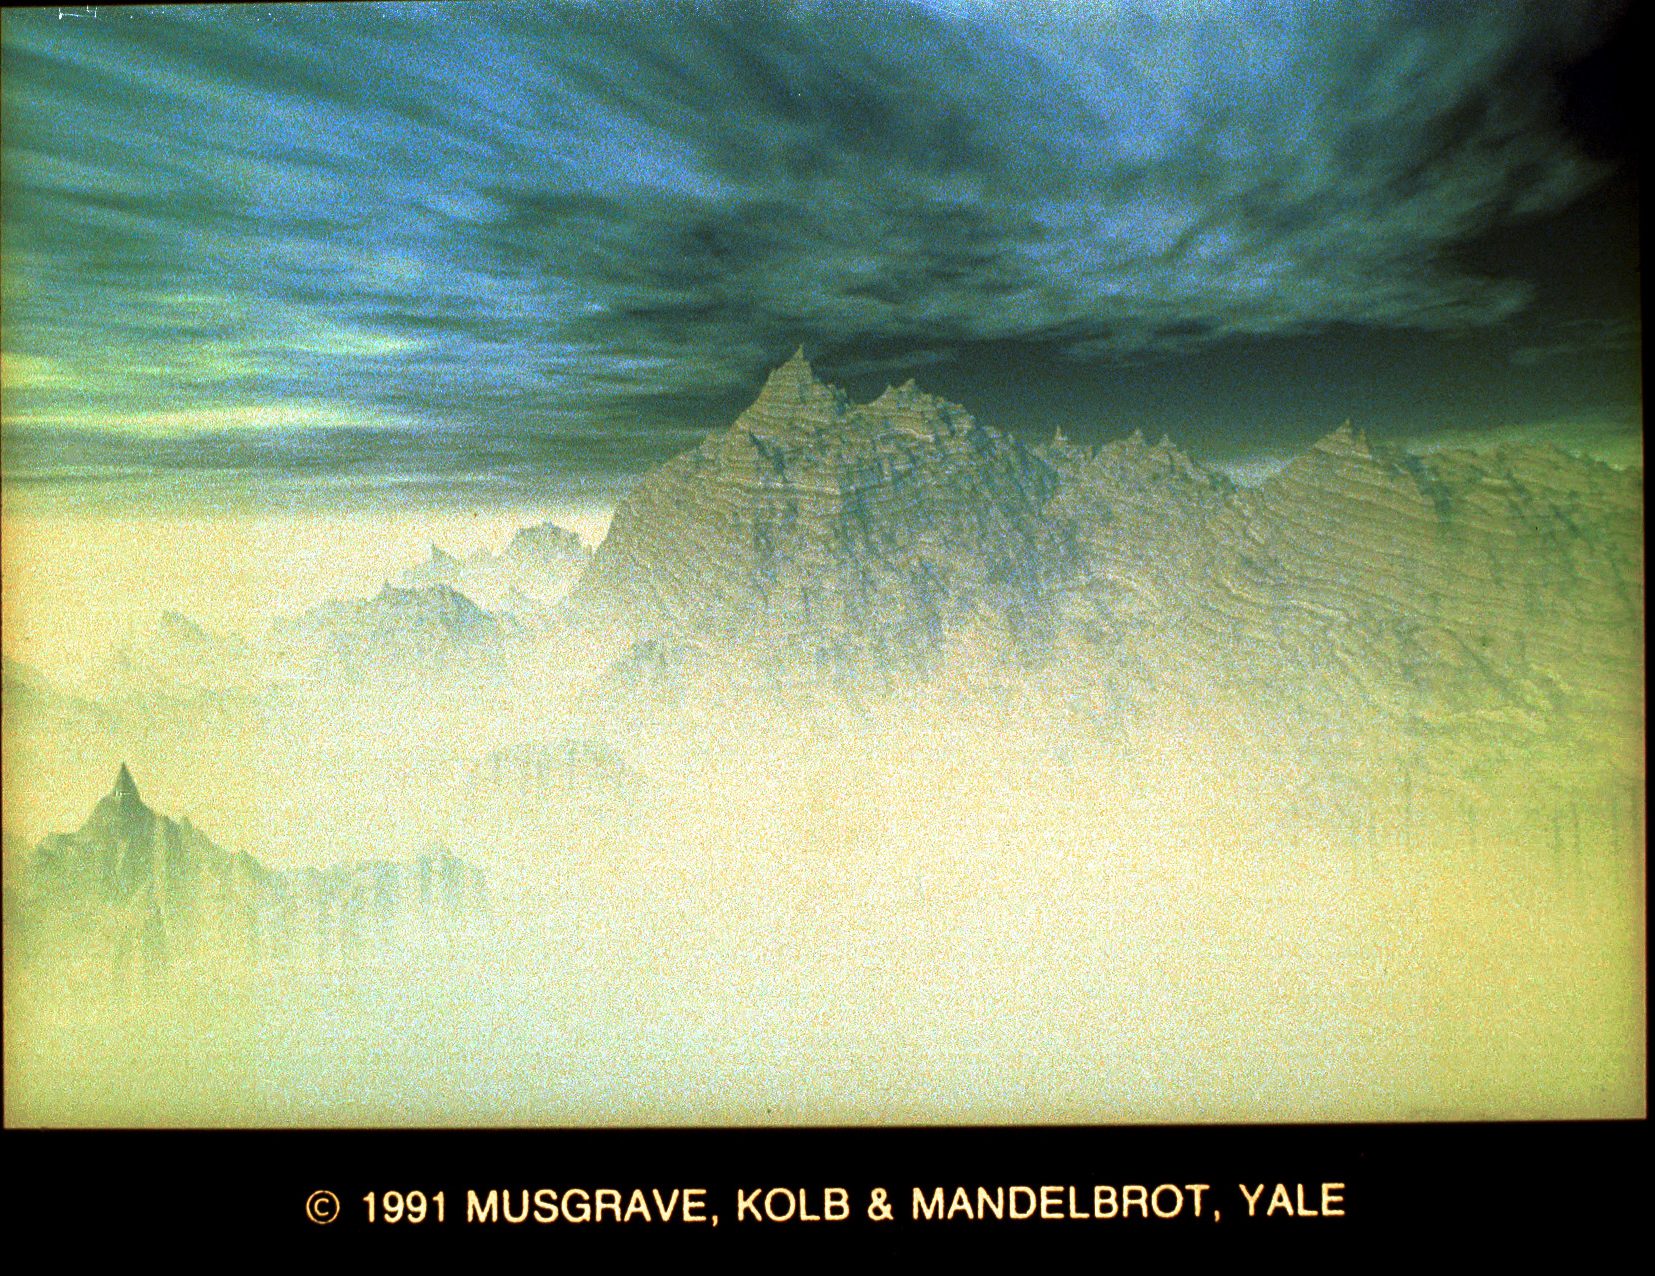
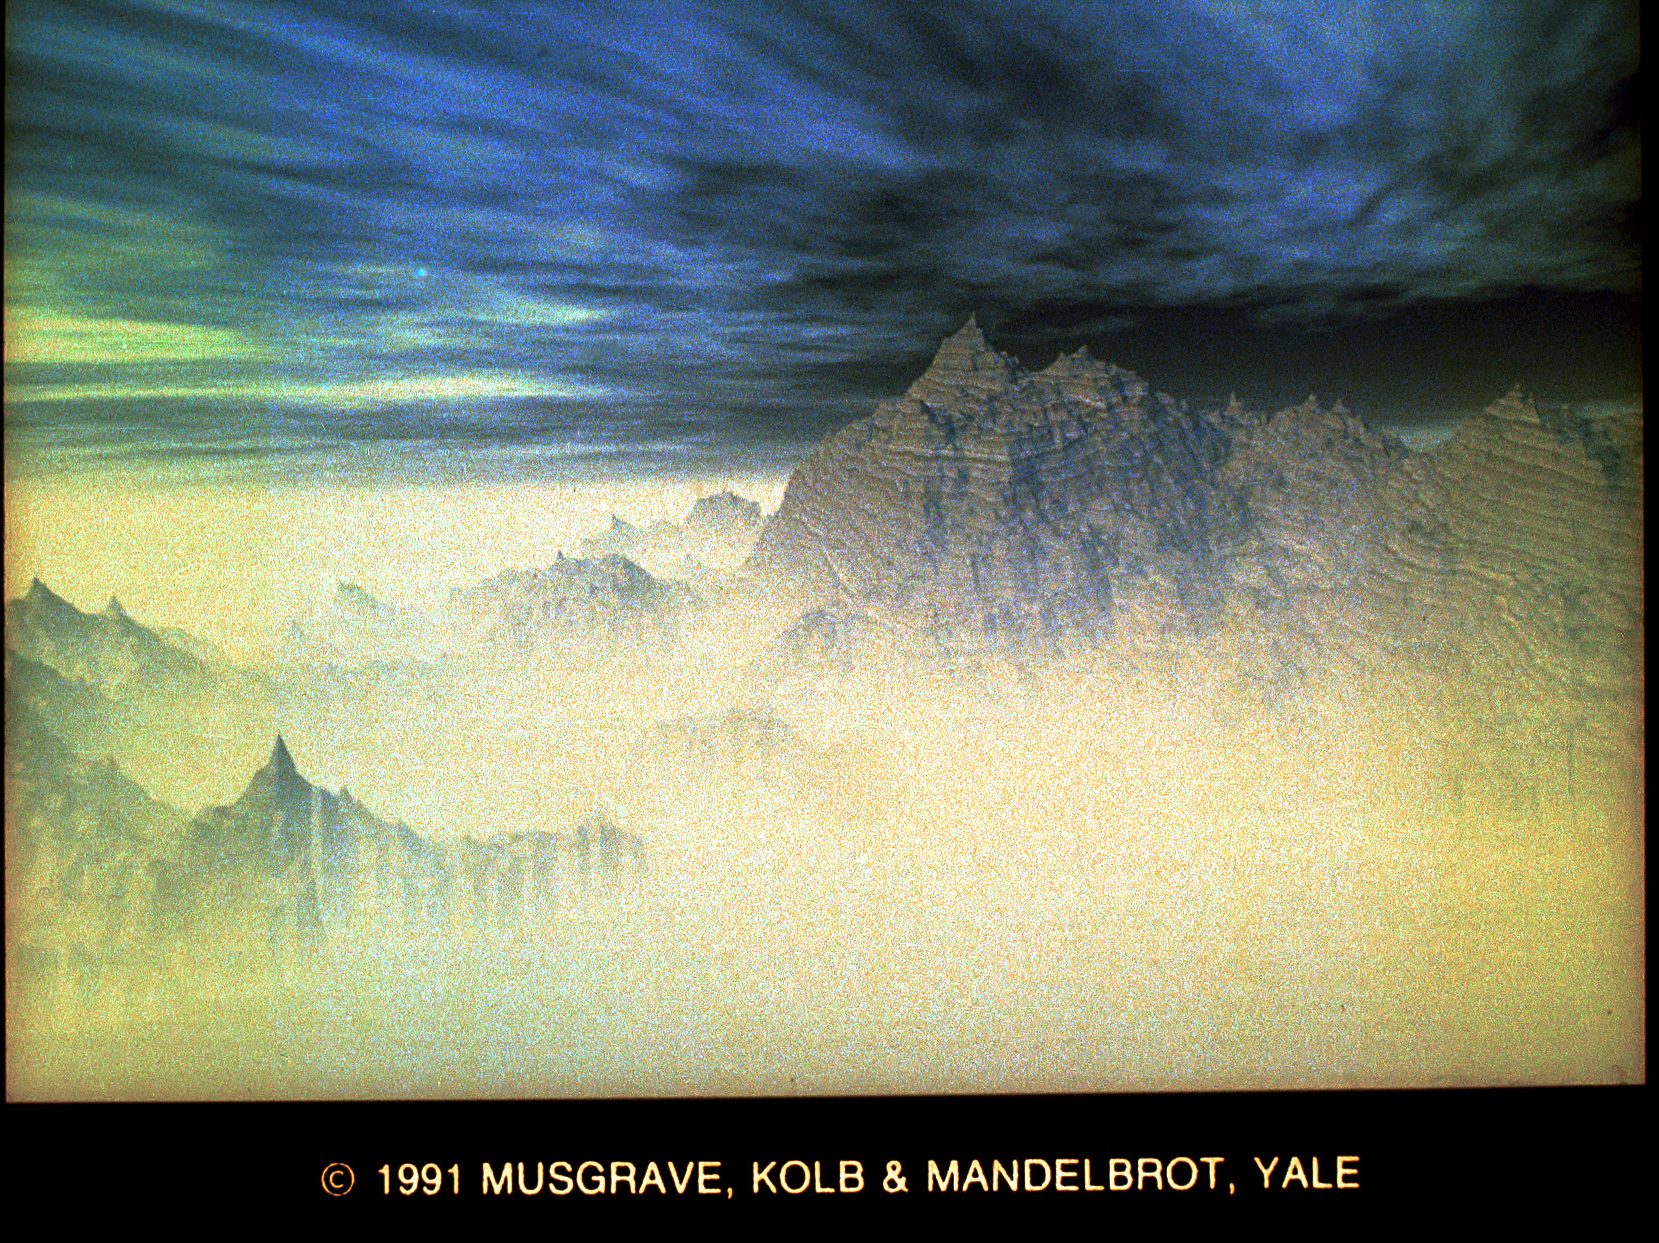
45&46. Misty Mountains by F.K. Musgrave, C.E. Kolb, B .B. Mandelbrot. Very subtle use of color distinguishes this archetypal land- scape image. It was designed to capture a subtle mood, in the tradition of Chinese landscape paintings. The mountains were created using the hexagon-subdivision scheme described by Mandelbrot in “The Science of Fractal Images.” The stratified rock was a procedural texture, as were the clouds, which were created using stretched fractional Brownian motion. The images were created on 9 DECstation 5,000′ s under Network Linda using Rayshade and C-Linda. Contact: Ken Musgrave, Yale University Math Department, Box 2155 Yale Station, New Haven, CT 06520; (203) 432-4016.
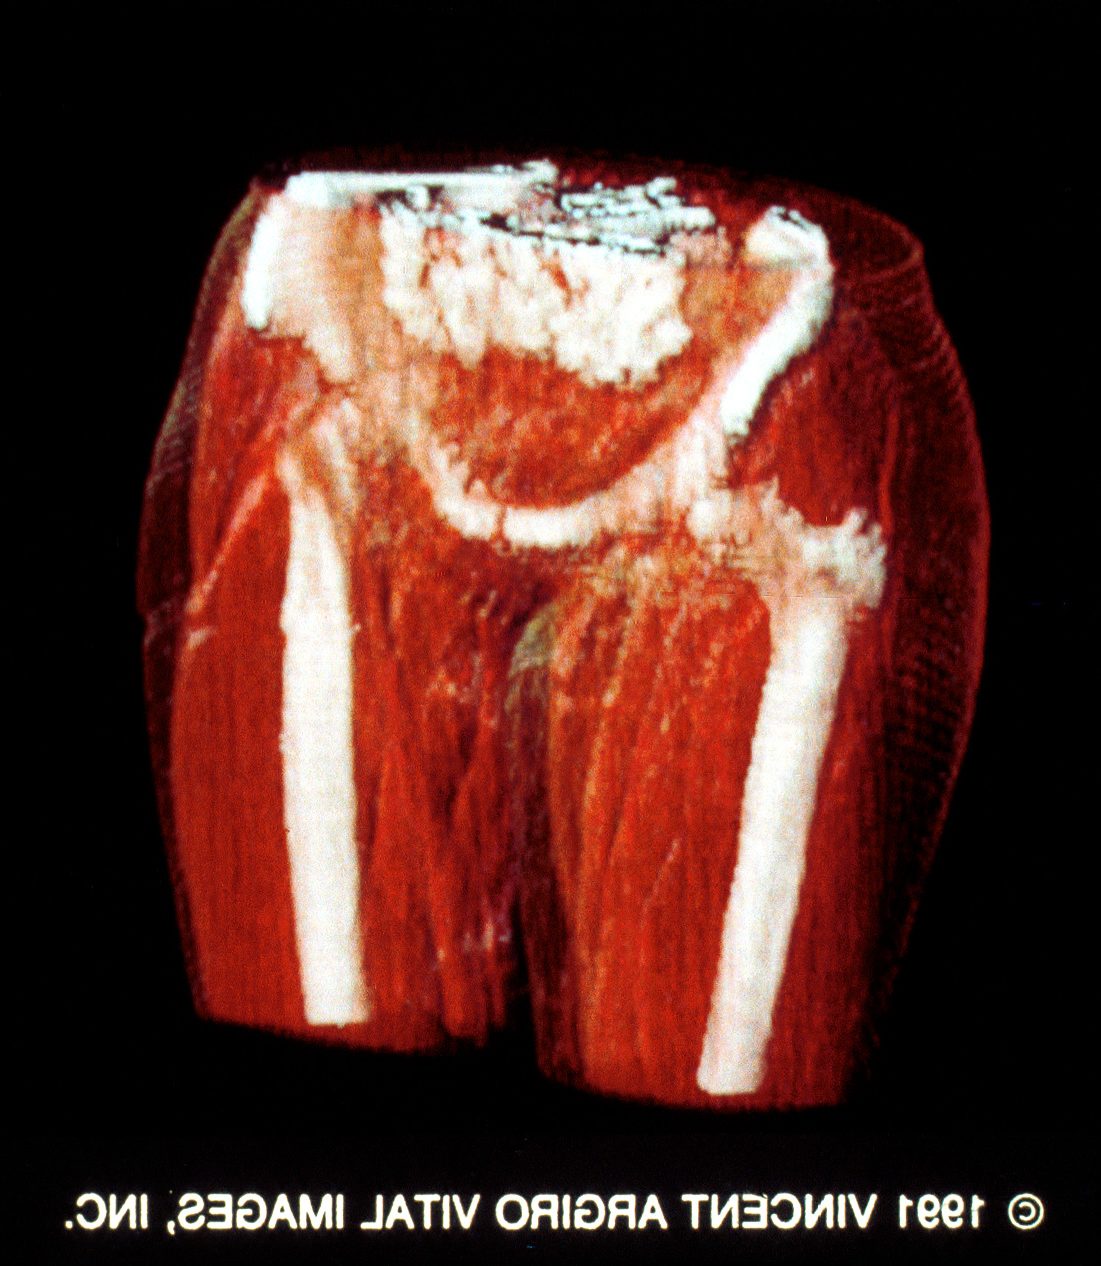
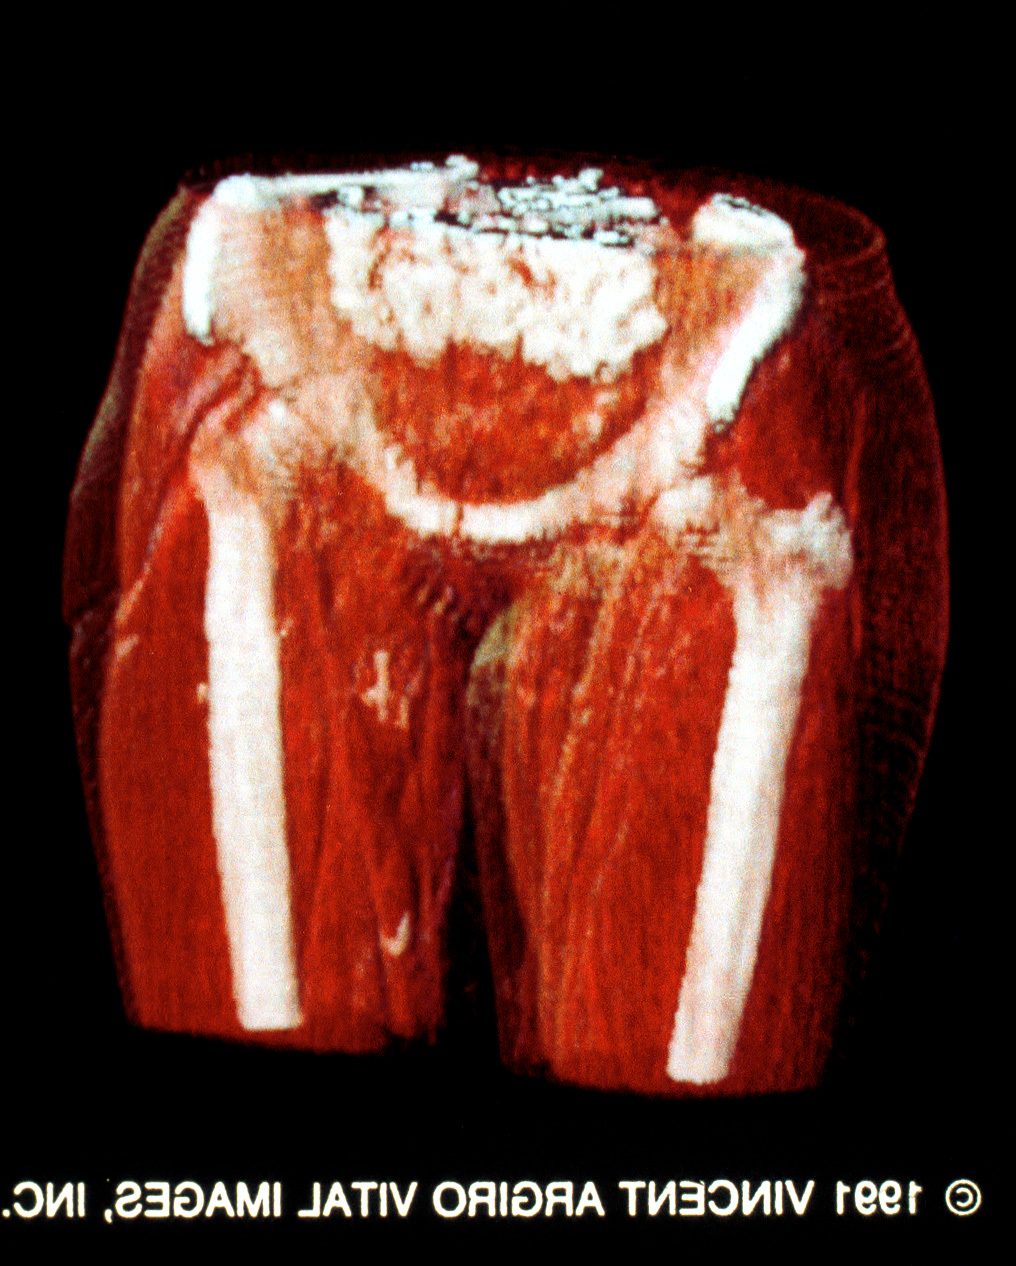
47&48. Stereo Volume CT Study of Pelvis by Vincent Argiro, Bill Van Zandt, Murray Foster. These are a stereo volume rendering using gradient lighting and gradient magnitude thresholding. Data courtesy of Sarah Gibson (Camegie- Mellon University). The images were created on a SGI 4D/220VGX using VoxelView/ULTRA. Contact: Vincent Argiro, Vital Images Inc., 505 N. 4th, Fairfield, IA 52556; (515) 472-7726.
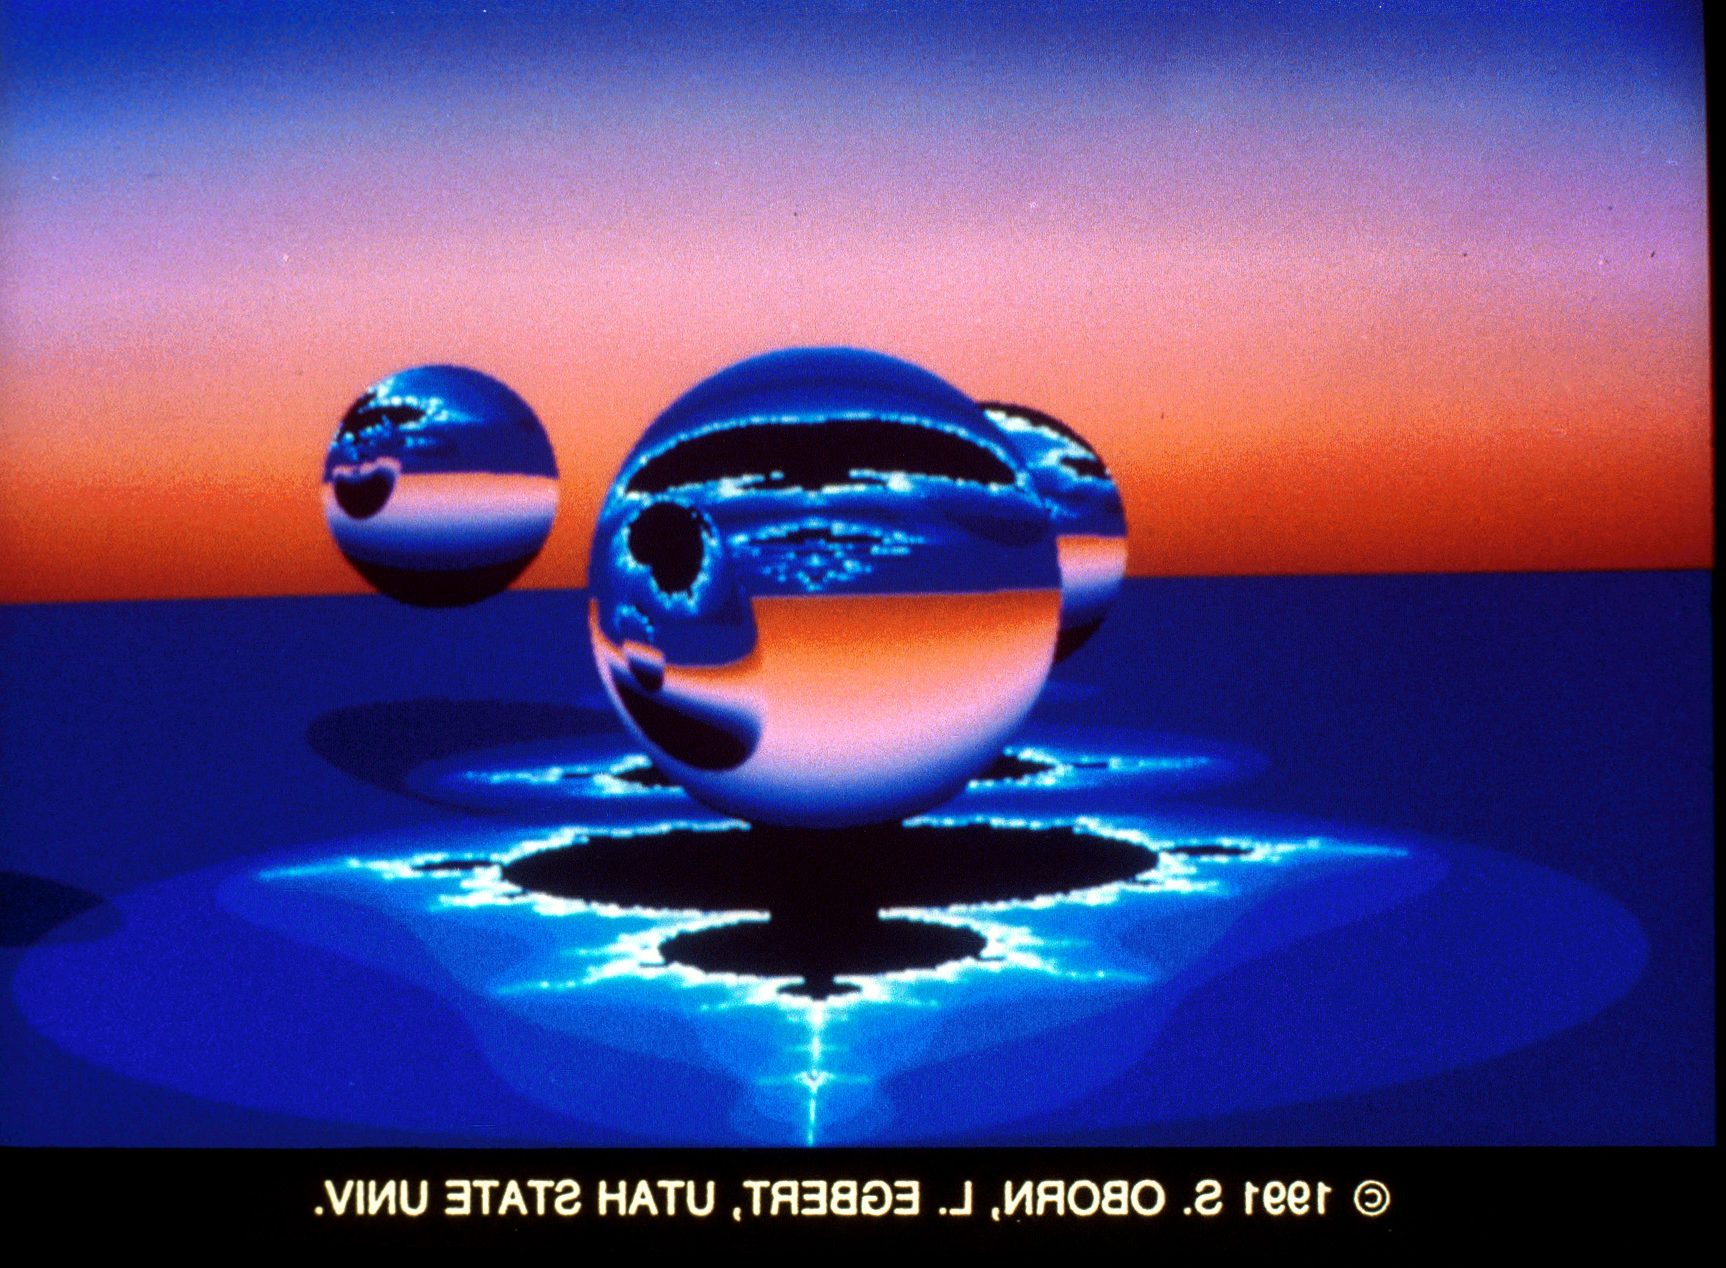
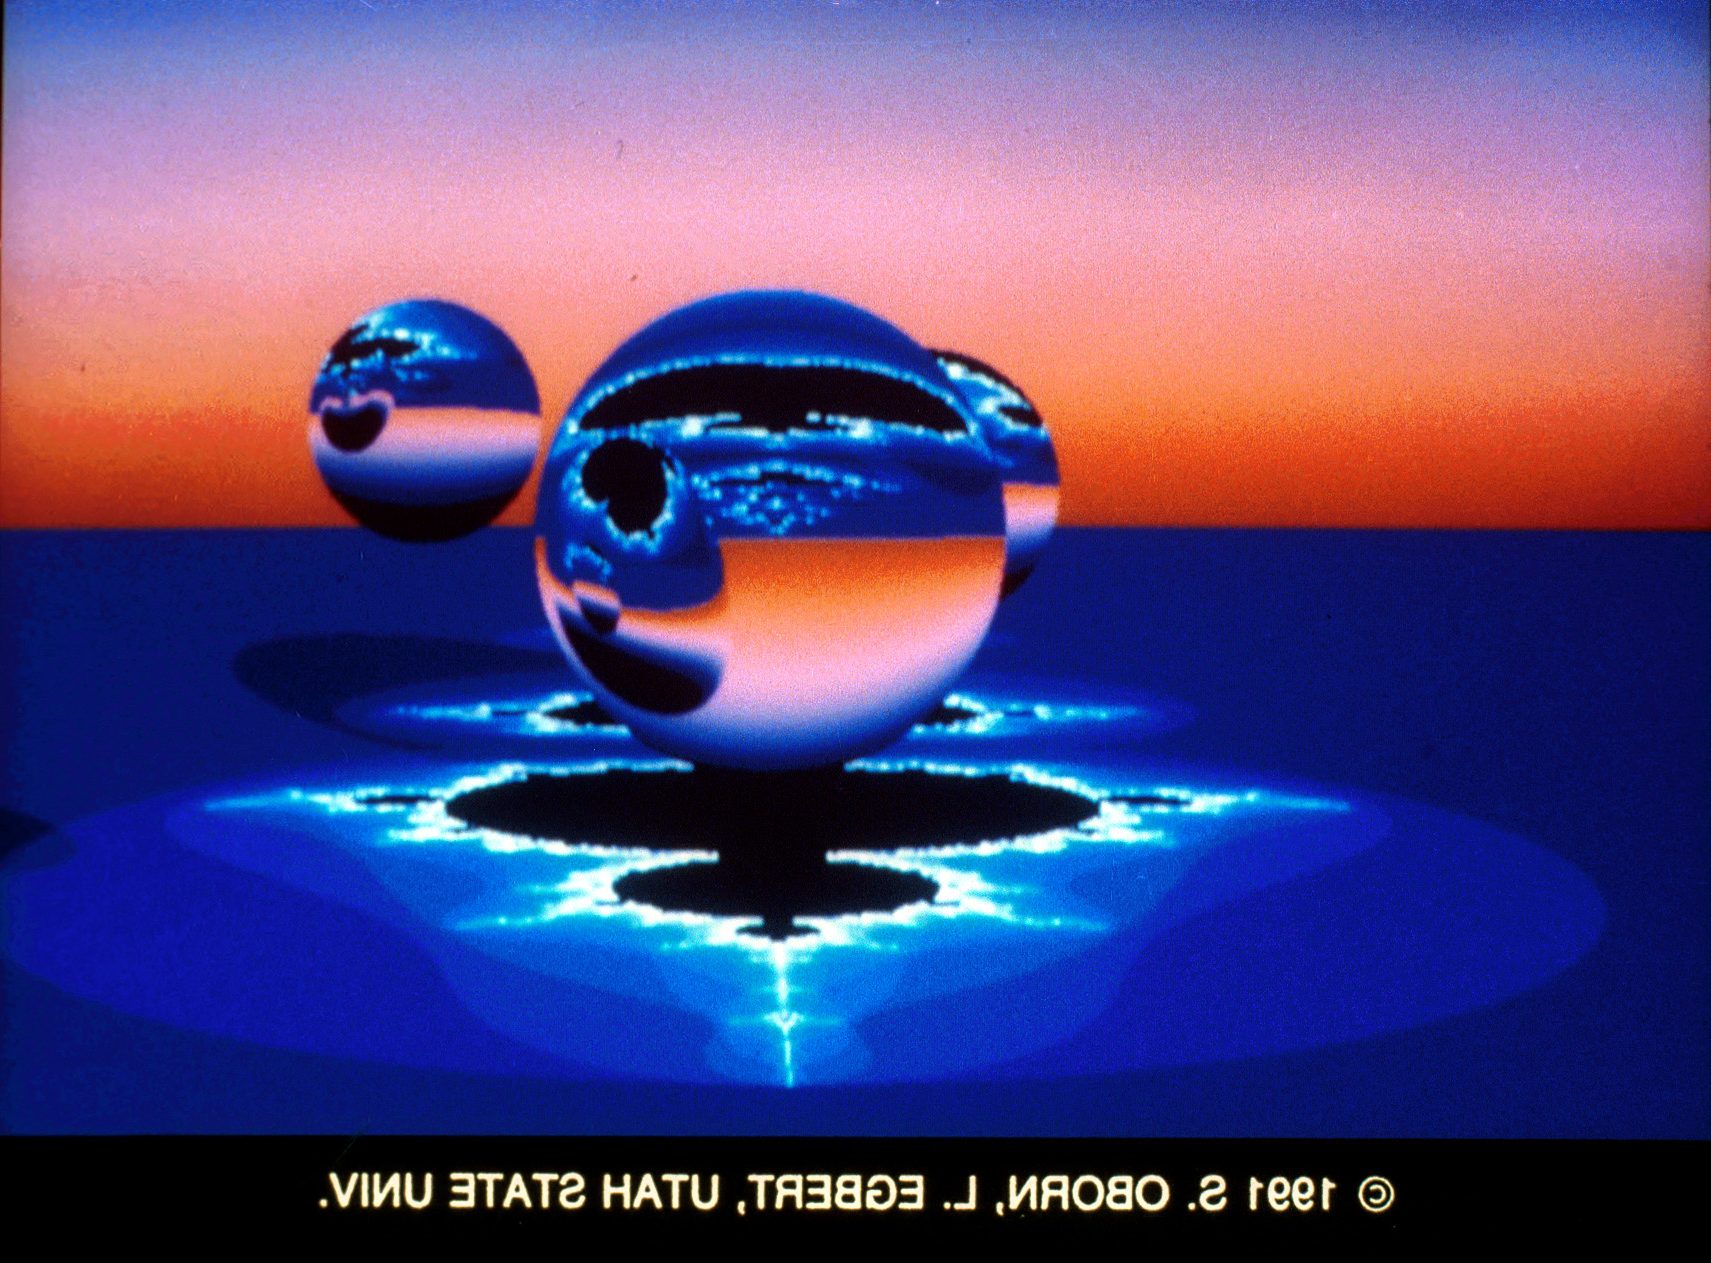
49&50. Reflections and Refractions on the Mandelbrot Set by Shaun Obom, Larre Egbert. The Mandelbrot was both reflected and refracted through and by several spheres, in stereo. The Mandelbrot set on the floor was precomputed and used as a bitmapped image. The images were created on a 386-based computer with assembly language only. Contact: Larre Egbert, Utah State University, Computer Science Department, Logan, UT 84322-4205; (801) 750- 3280.
51&52. Biological Cell by Melvin L. Prueitt. The slides illustrate ray tracing and texture mapping. Data supplied by Babetta Marrone. They were created on a Cray YMP and Dicomed film recorder using SCOPE, the author’s own program. Contact: Melvin L. Prueitt, C-6 Computer Graphics, MS-B272, Los Alamos National Laboratory, Los Alamos, NM 87545; (505) 667-4452.
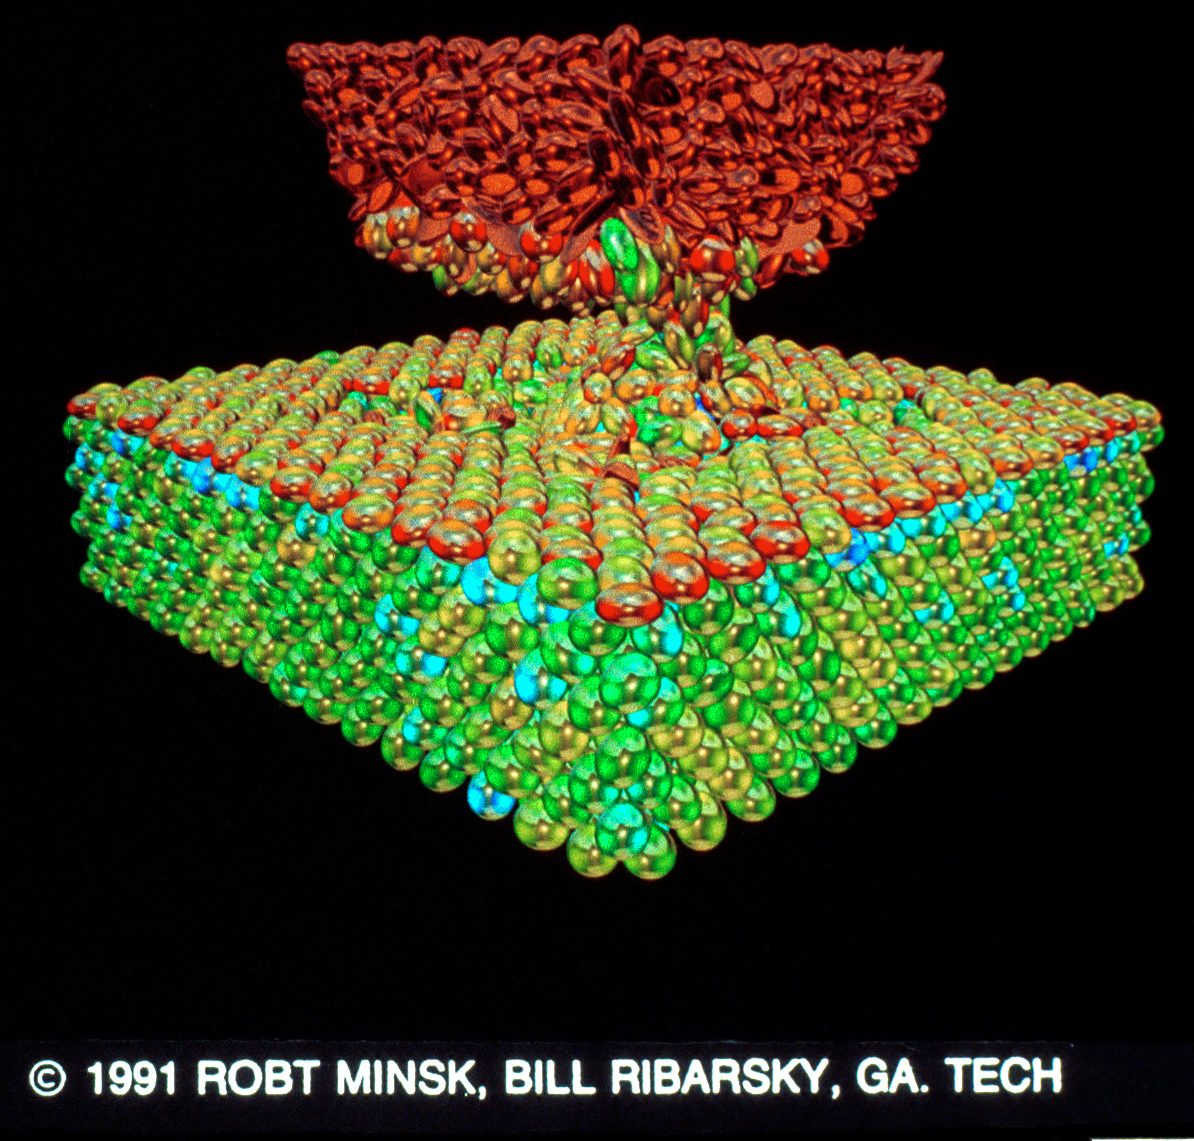
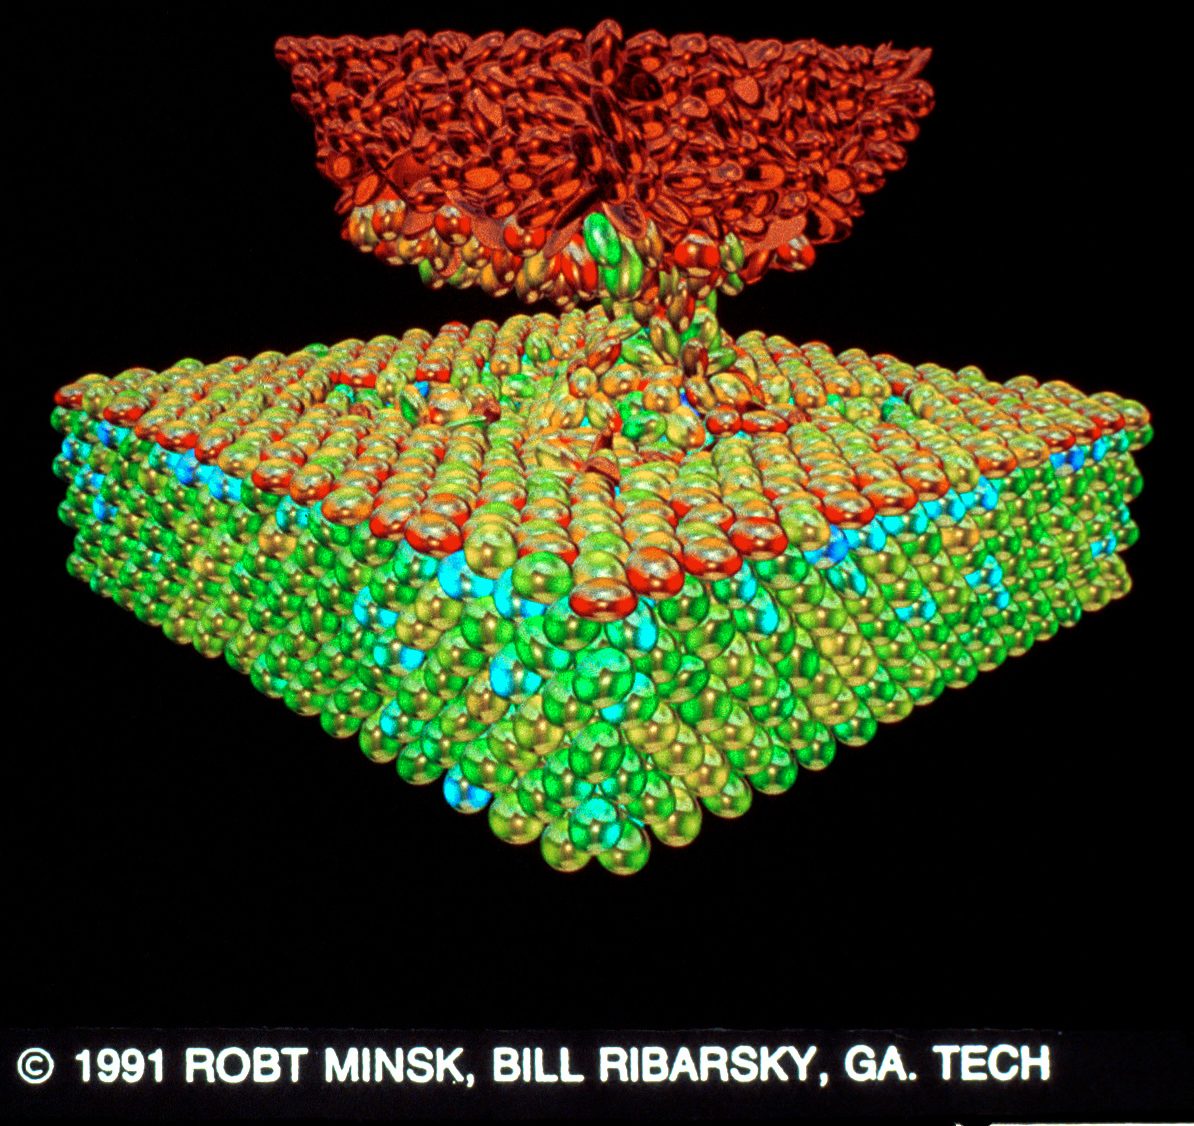
53&54. Atomic Forces as Ni Tip Ruptures Gold Surface by Robert Minsk, Bill Ribarsky. Pseudocolors and deformable spheres represent forces that motivate the atomic dynamics. Seminal use of stereoscopy to depict complex, multiparametric data. Molecular dynamics simulations by Bill Ribarsky and Uzi Landman. The images were created on a SGI 4D/120GTX using RenderMan, molecular dynamics simulation and analysis codes. Contact: Bill Ribarsky, Client Services/OIT, Georgia Tech, Atlanta, GA 30332- 0710; (404) 894-6148.
55&56. Burning Bridges by Todd Gushea, Holliday R. Horton. These were an experiment in human stereoscopic vision. The images were created on a SGI 210VGX using Alias Research software. Contact: Holliday R. Horton, San Diego Supercomputer Center, 10100 John Hopkins Drive, La Jolla, CA 92037; (619)534-5037.
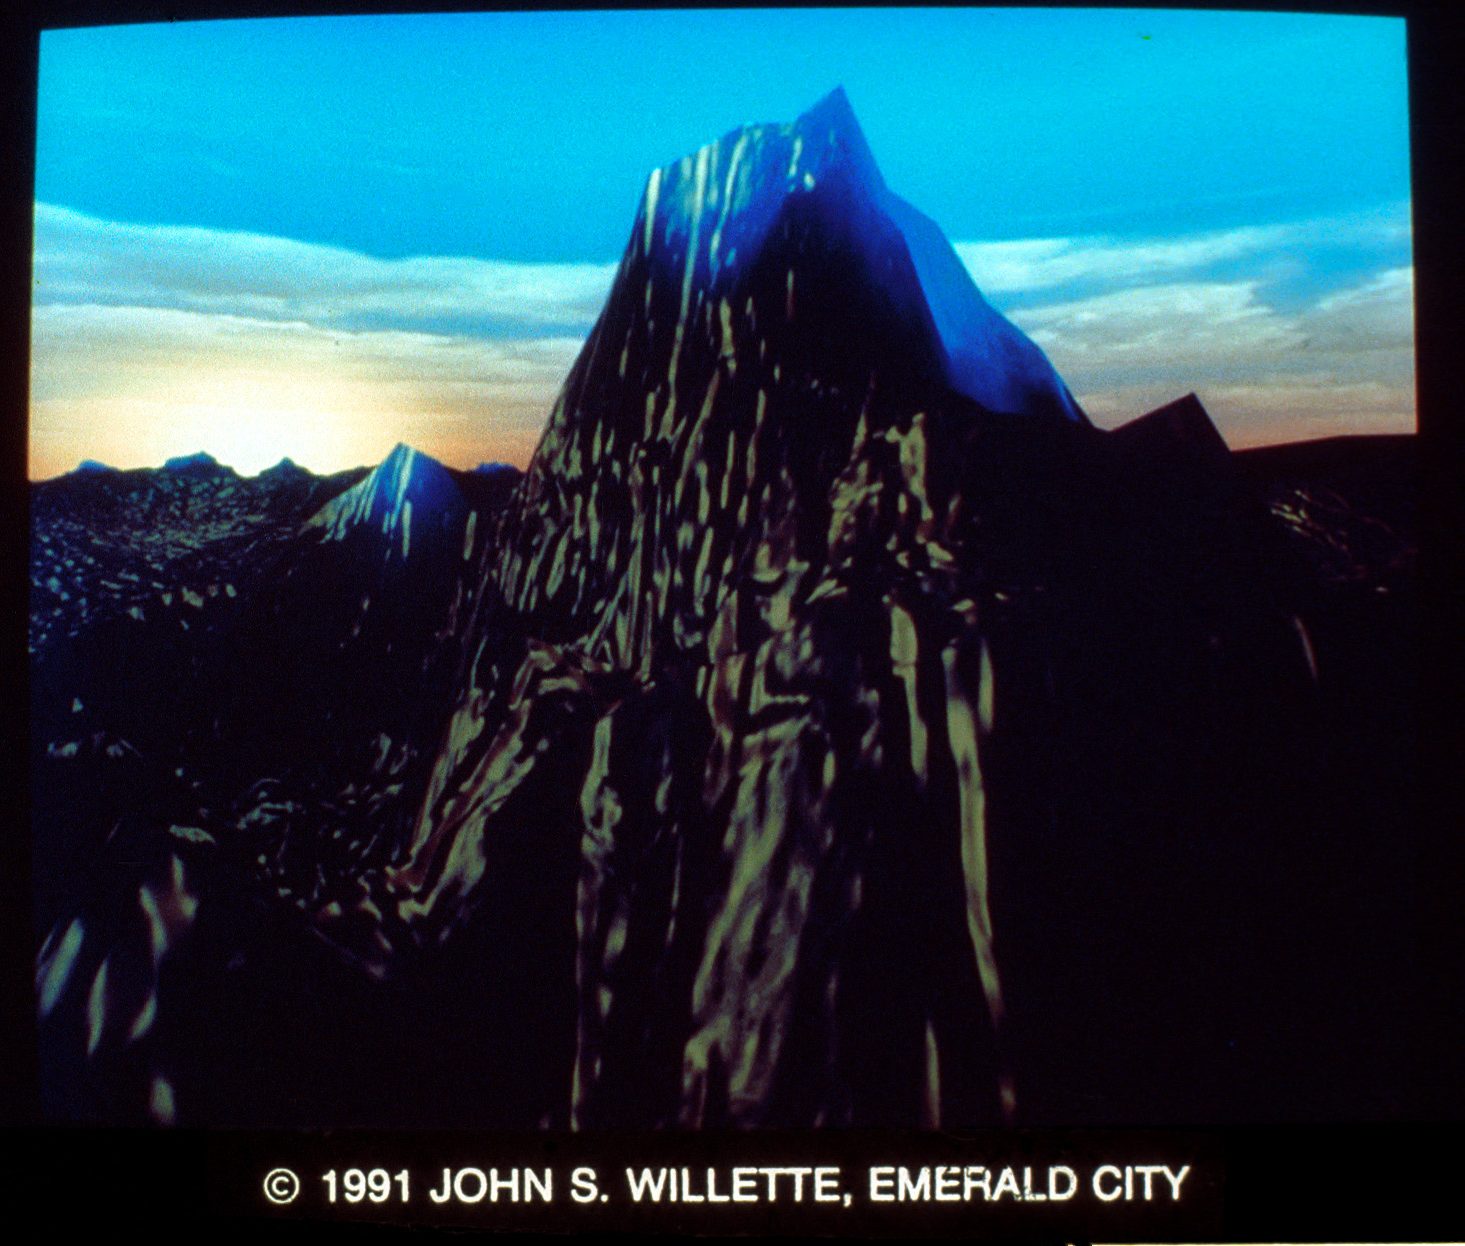
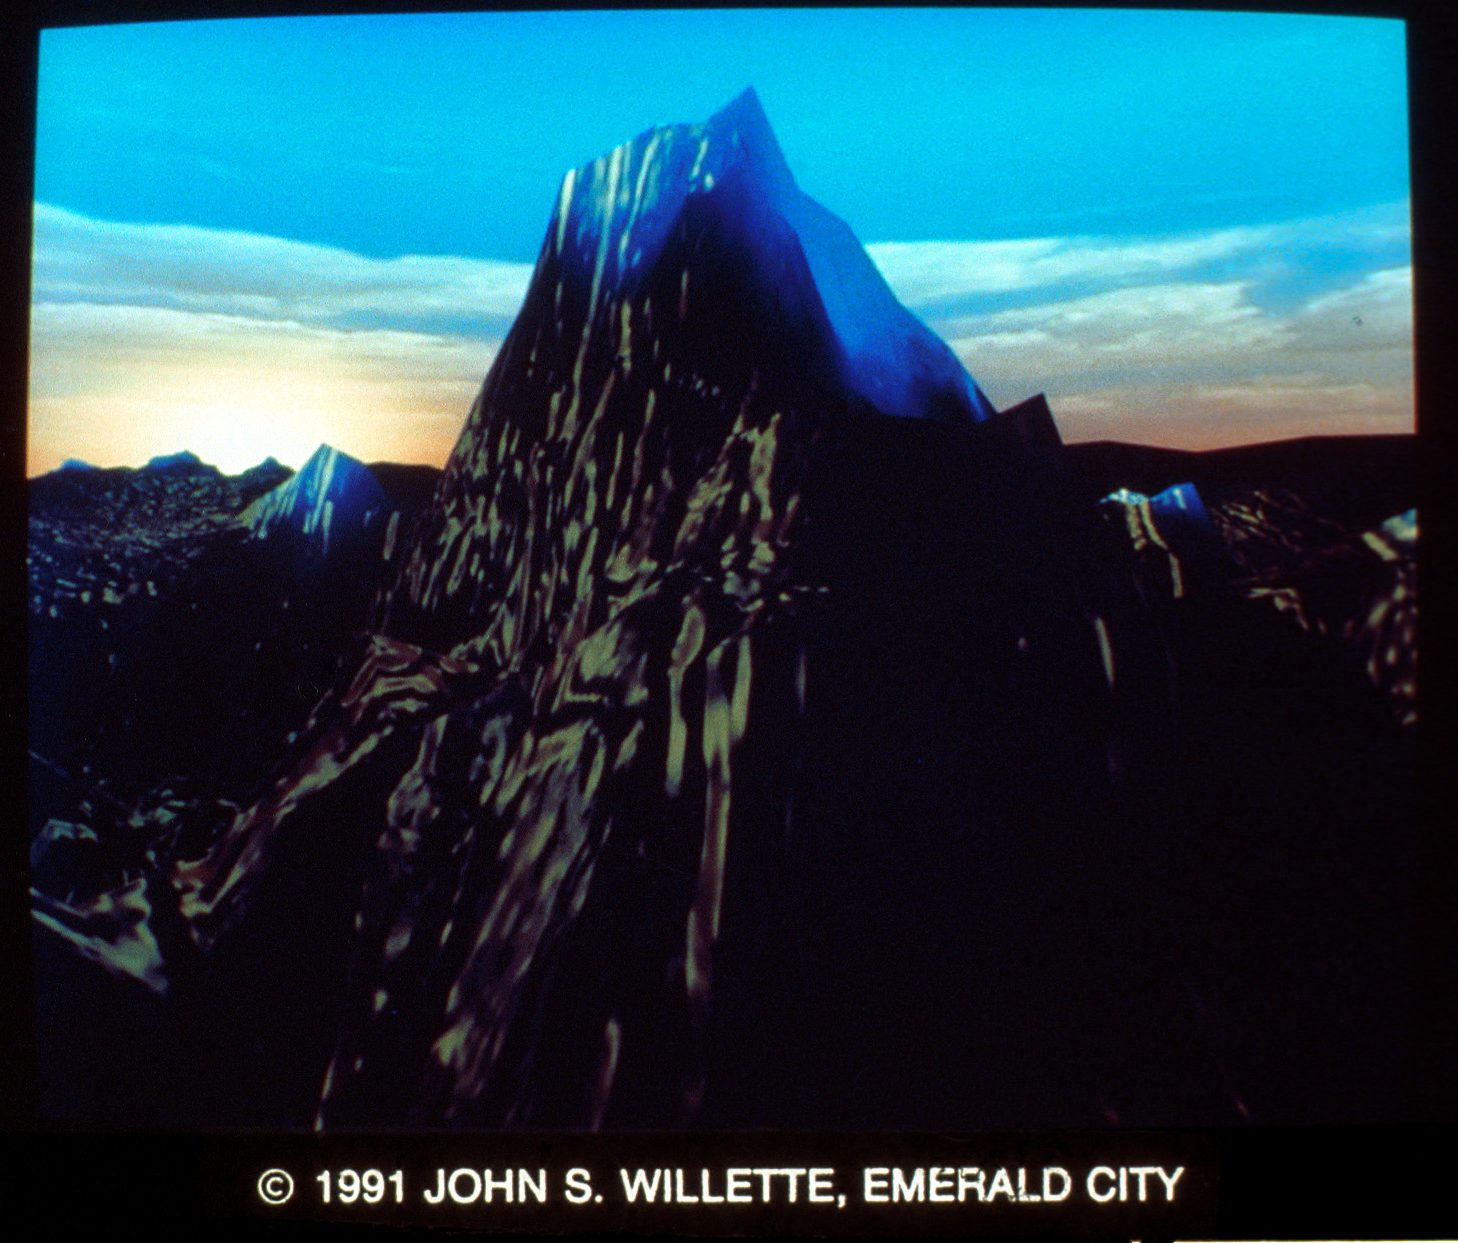
57&58. Morning Mountain by John S. Willette, Jim Cheevers. Without the stereo effect, low light scenes present problems with depth perception as shown here with a shot from a corporate logo for “Summit Training Sources.” The images were created on a SGI 4D/210GT using Vertigo, Picture Maker and True Color Paint. Contact: John S. Willette, Emerald City, 2660 Horizon Drive S.E., Grand Rapids, MI 49546; (616) 949-9283.
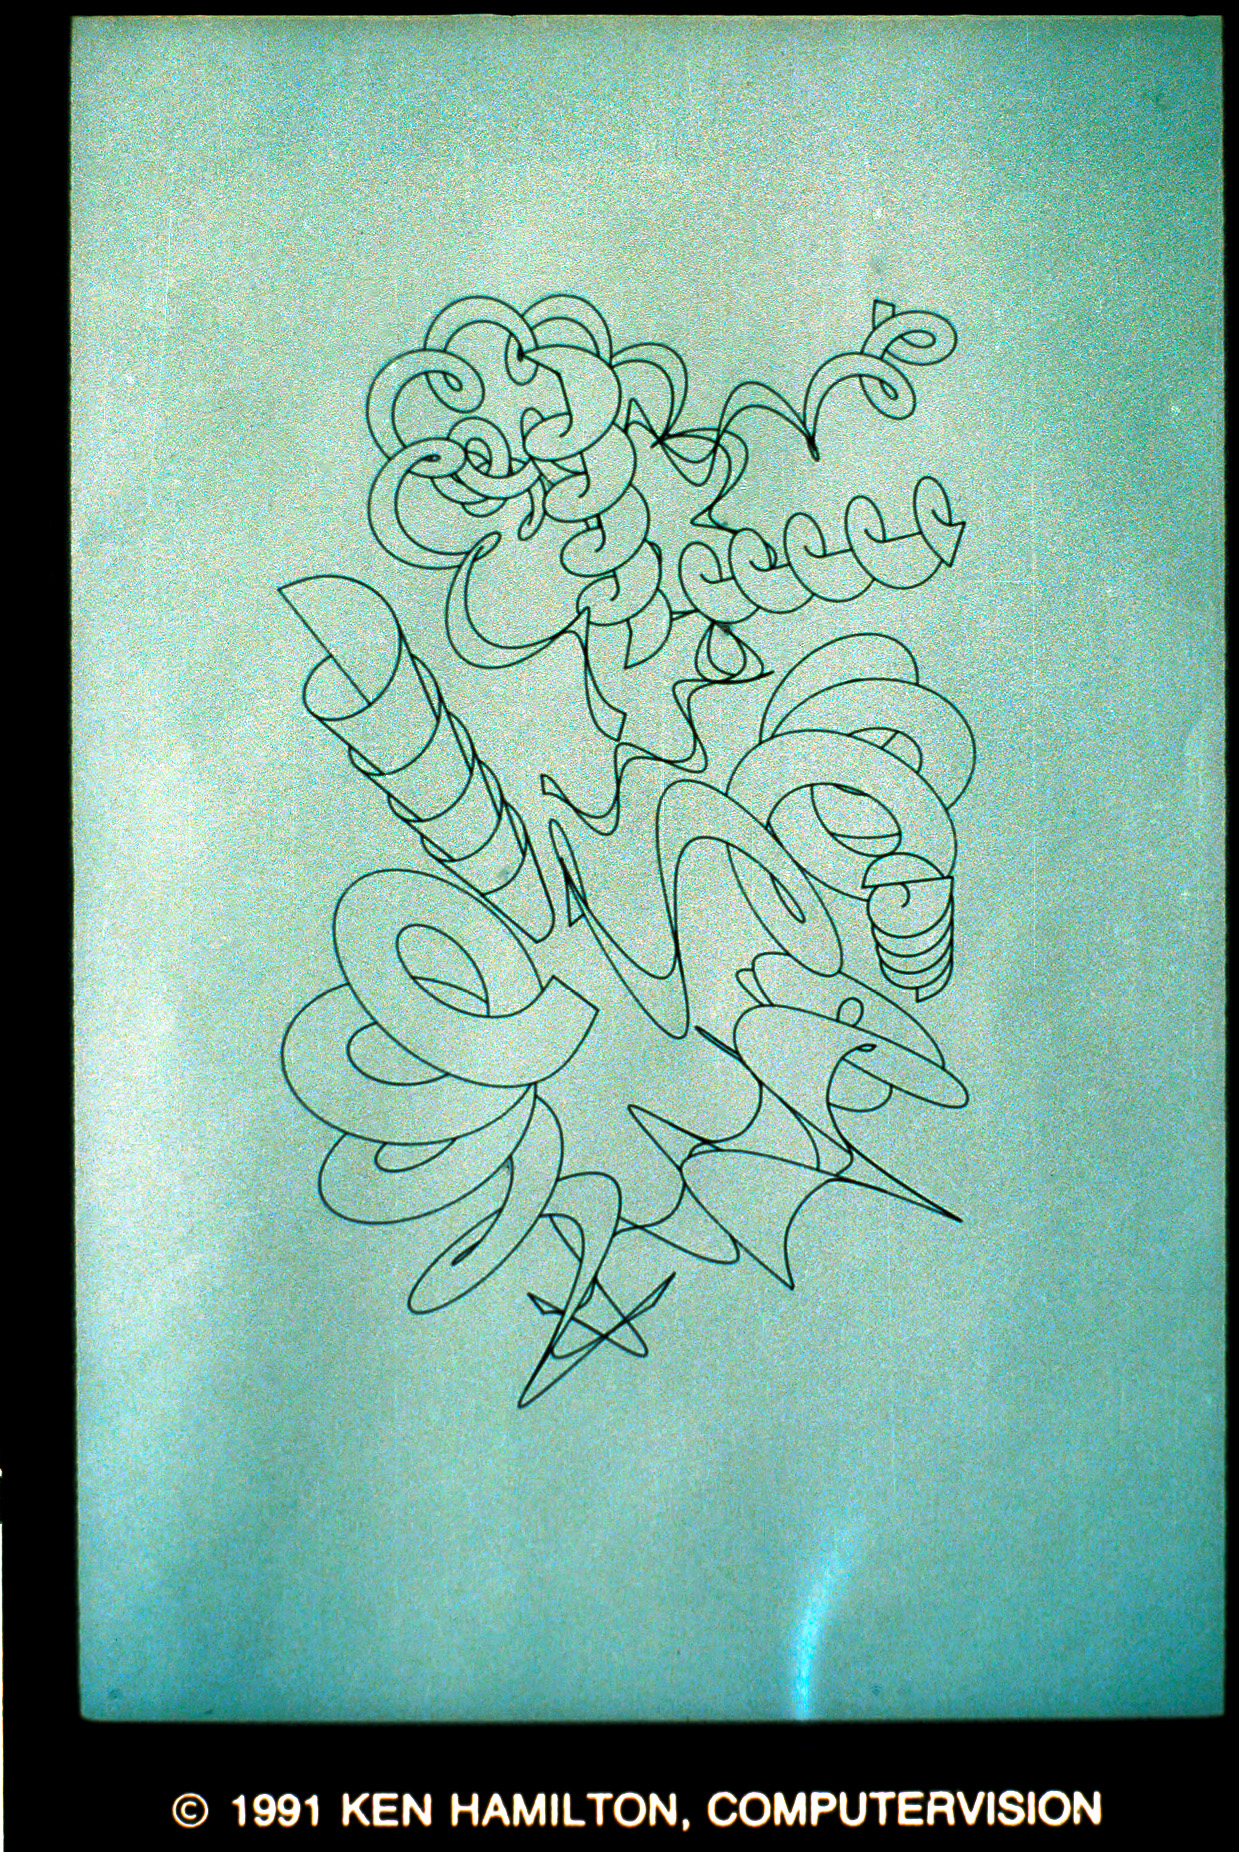
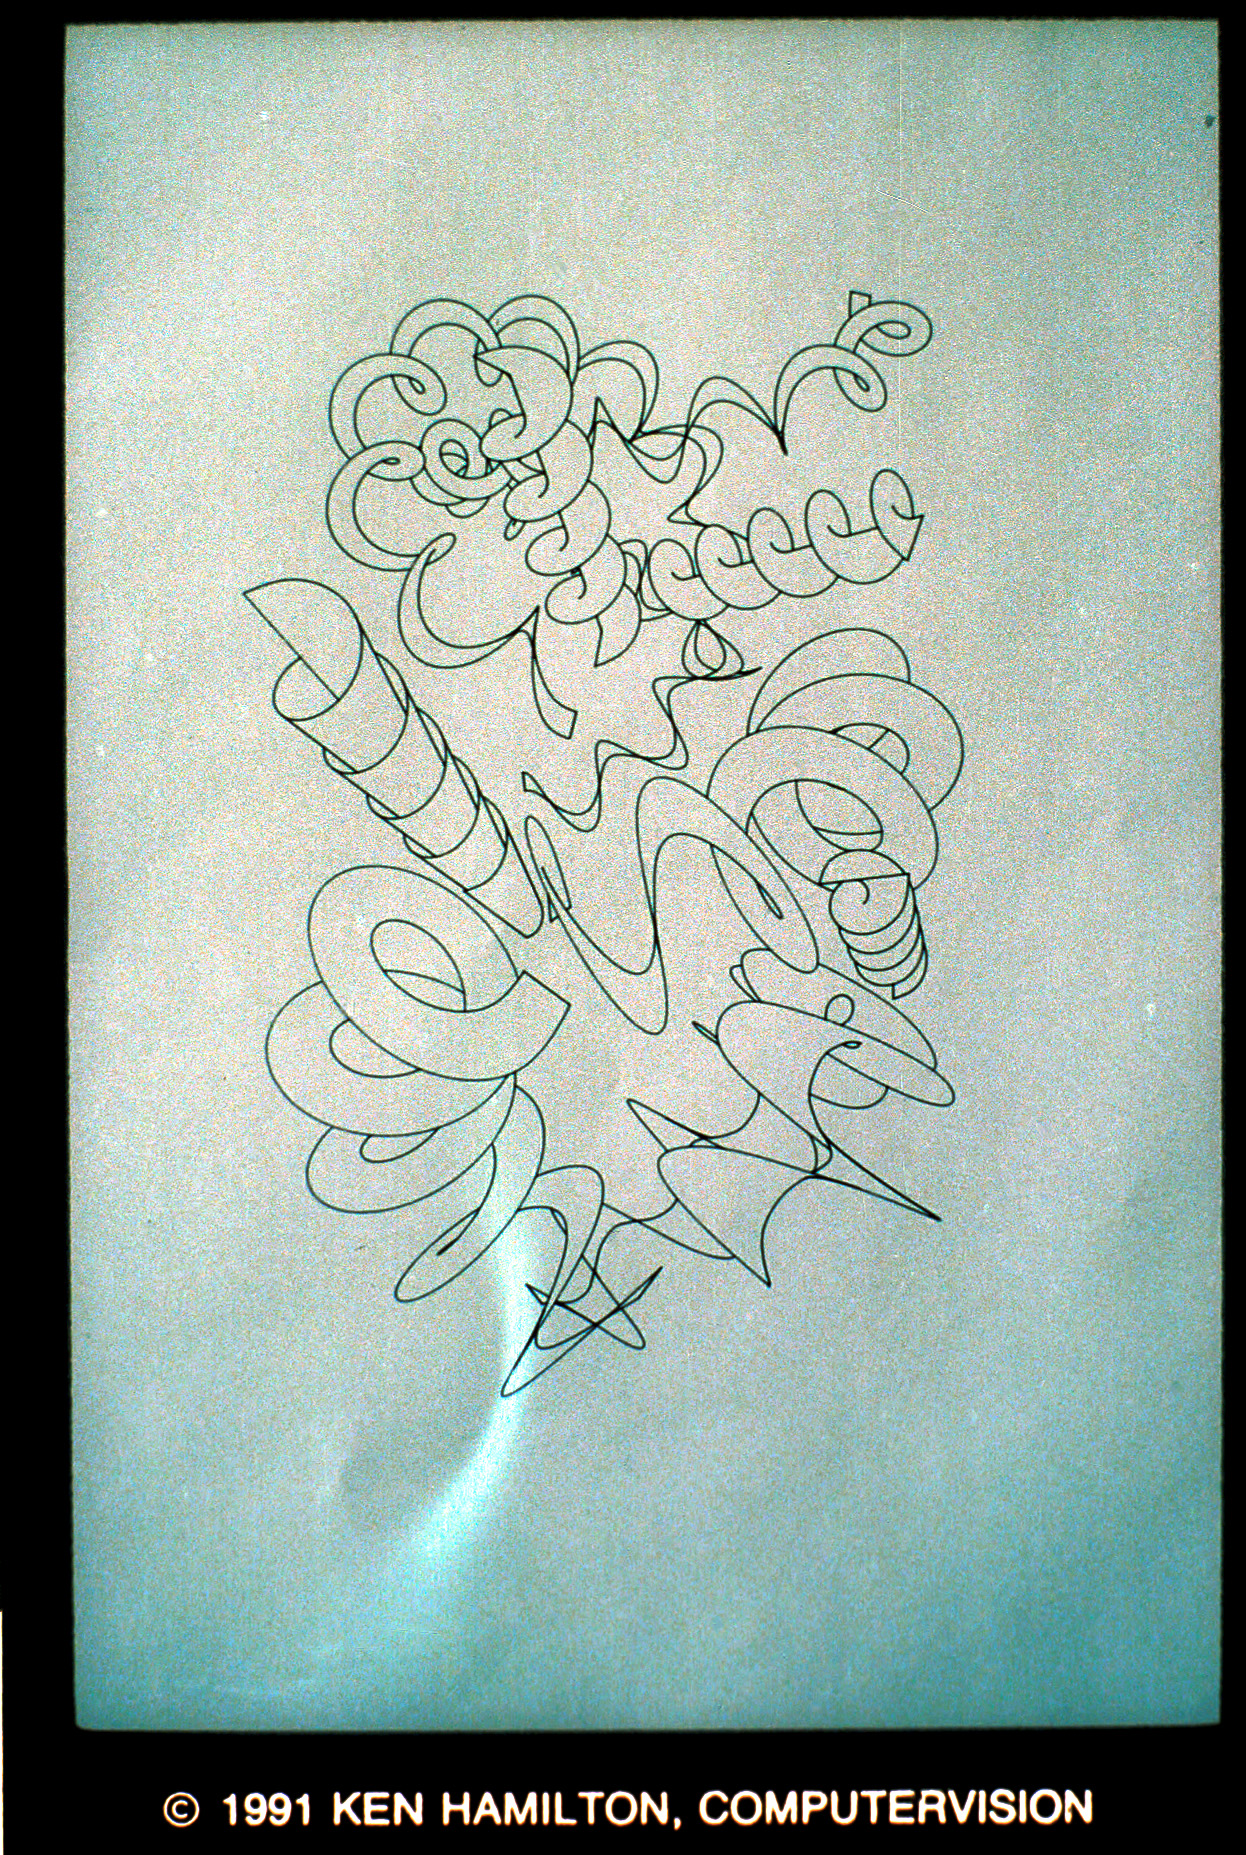
59&60. Clearly Screwy by Ken Hamilton. Nine twisty NURB surfaces were rendered by a “visible curve” (or hidden curve”) algorithm. Silhouettes are computed as 3D NURB curves for each view of the model. For each view, the image is computed and stored as blanking data referenced to the parametric domains of the silhouettes and the surface boundary curves (which are also realized as 3D NURB curves). This is a high-resolution (object-space) realization of the model, and is rendered here via a pen plotter. Many thanks to the developers of CADDS4X and to Karman Dev for assistance with plotter. The images were created on a SPARCstation 1 and Calcomp pen plotter 1043 using CADDS4X Solidesign. Contact: Ken Hamilton, Computervision/Prime, 122 Dec;atur Street #10, Arlington, MA 02174; (617) 275-1800 x6598.
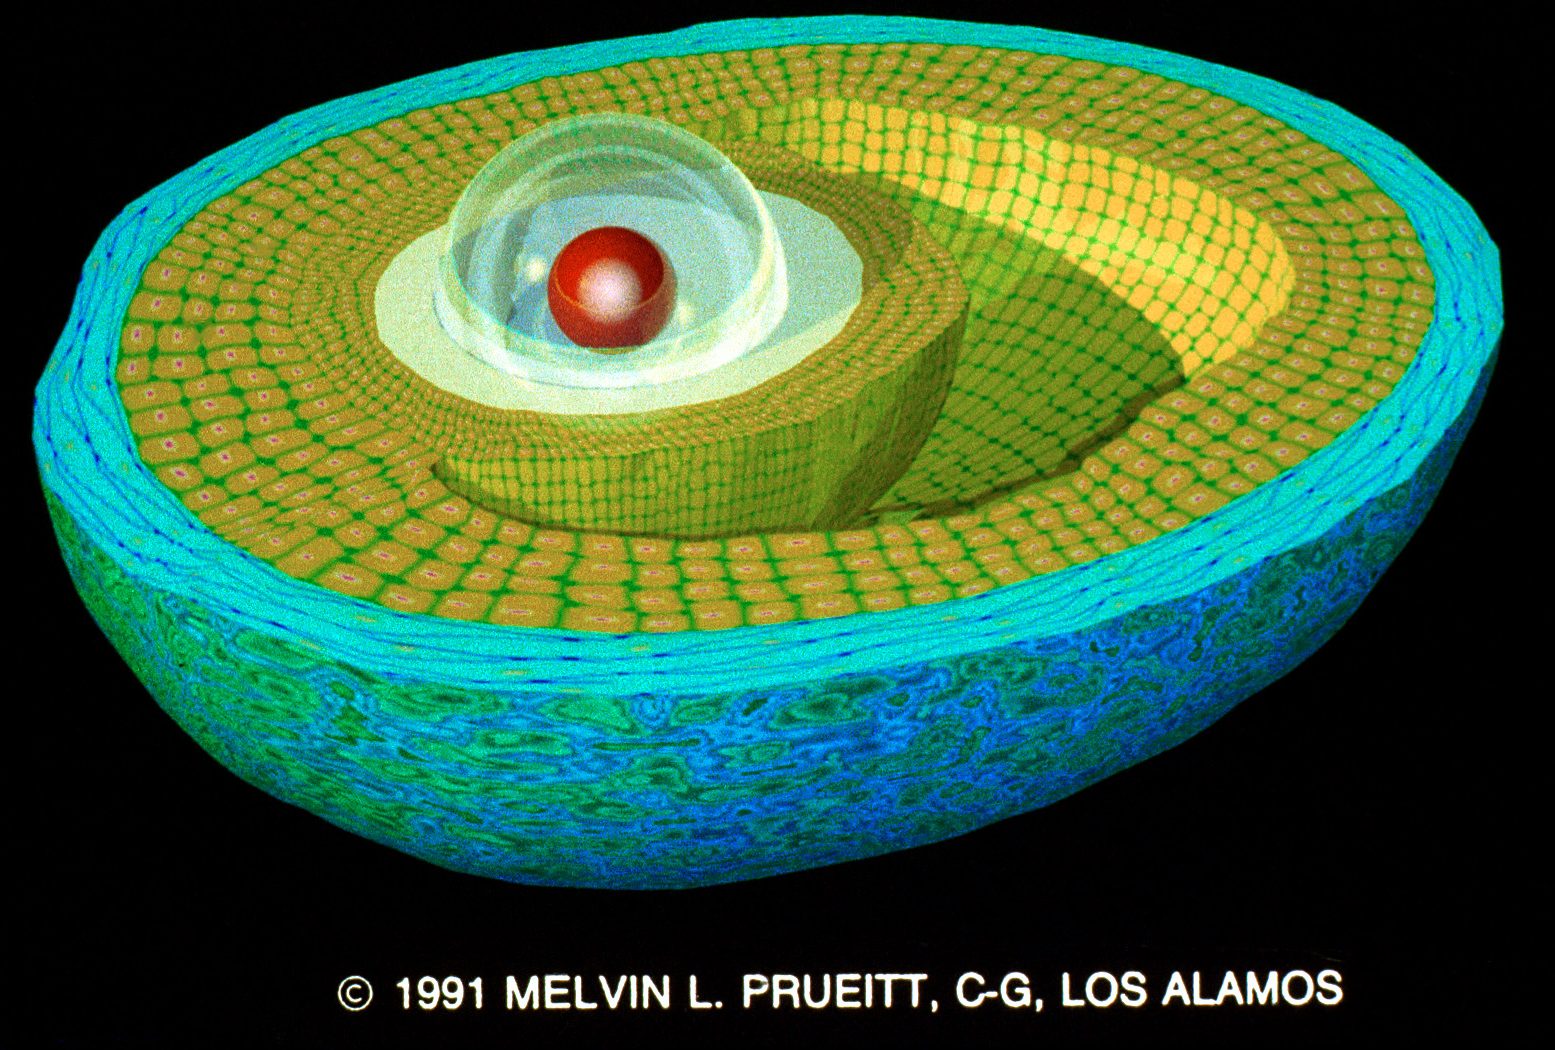
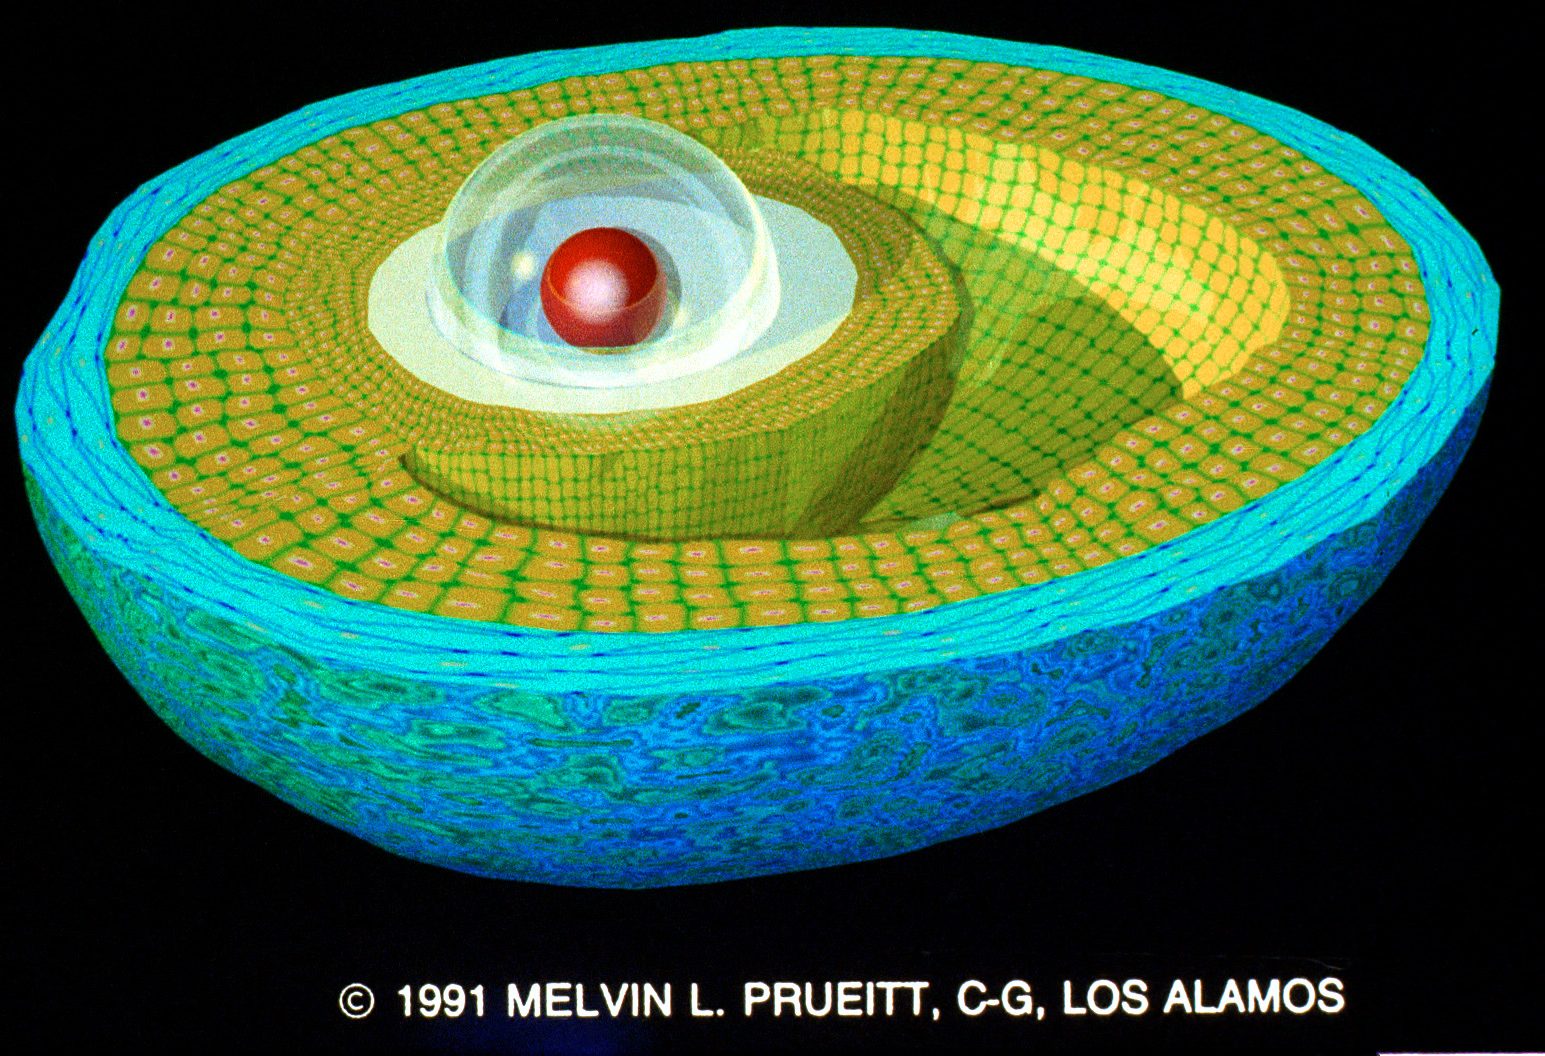
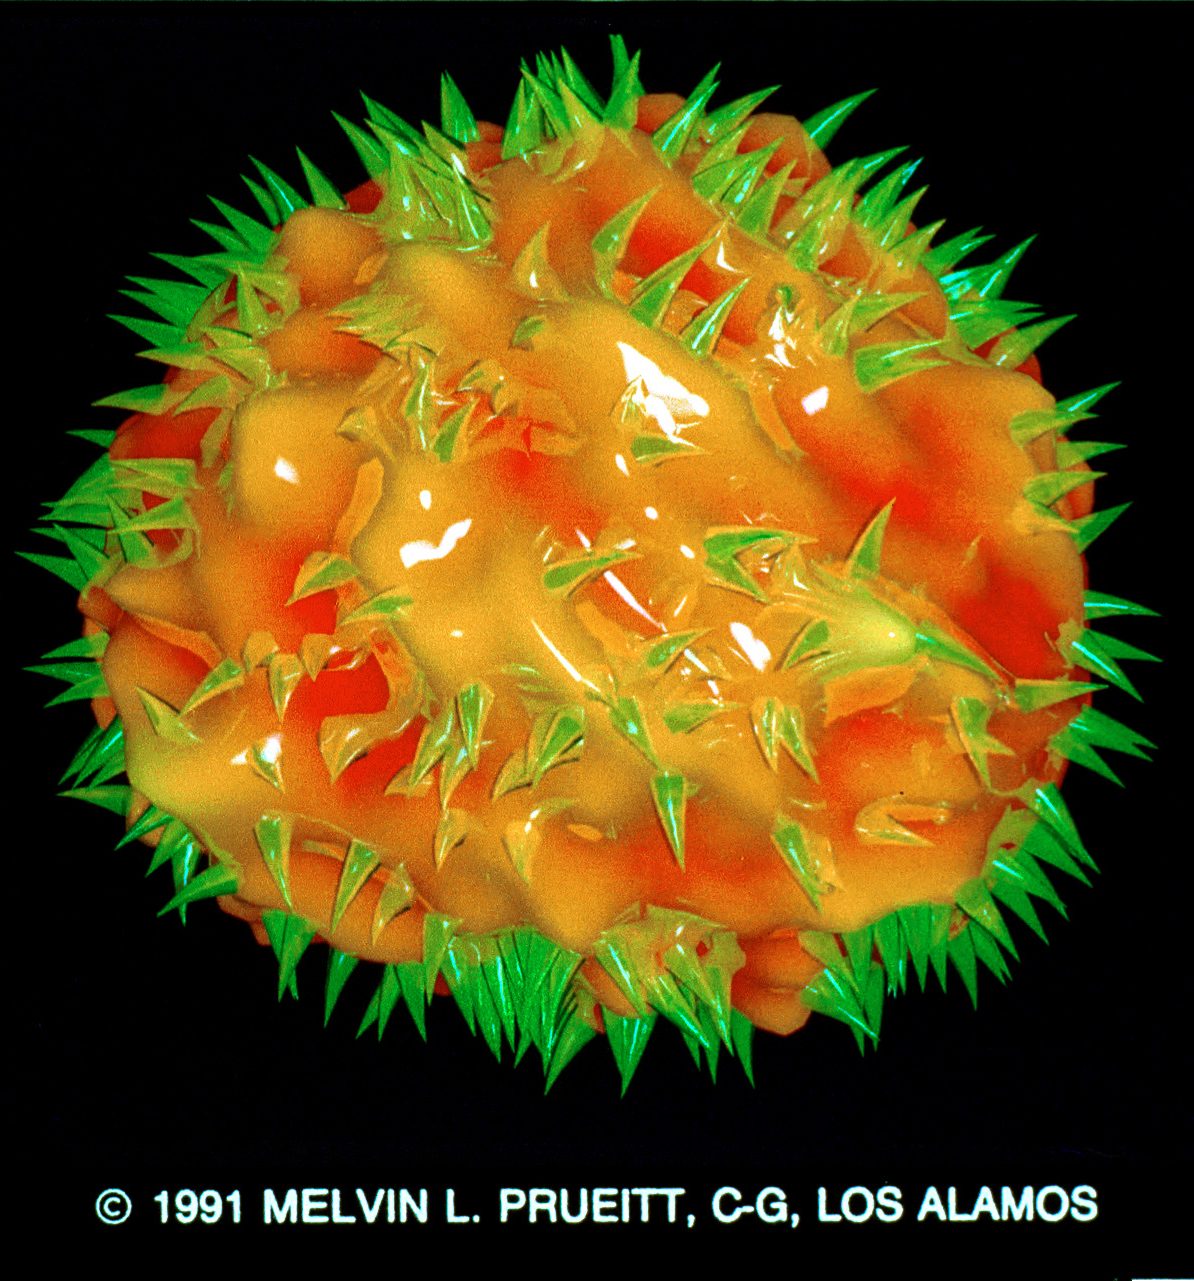
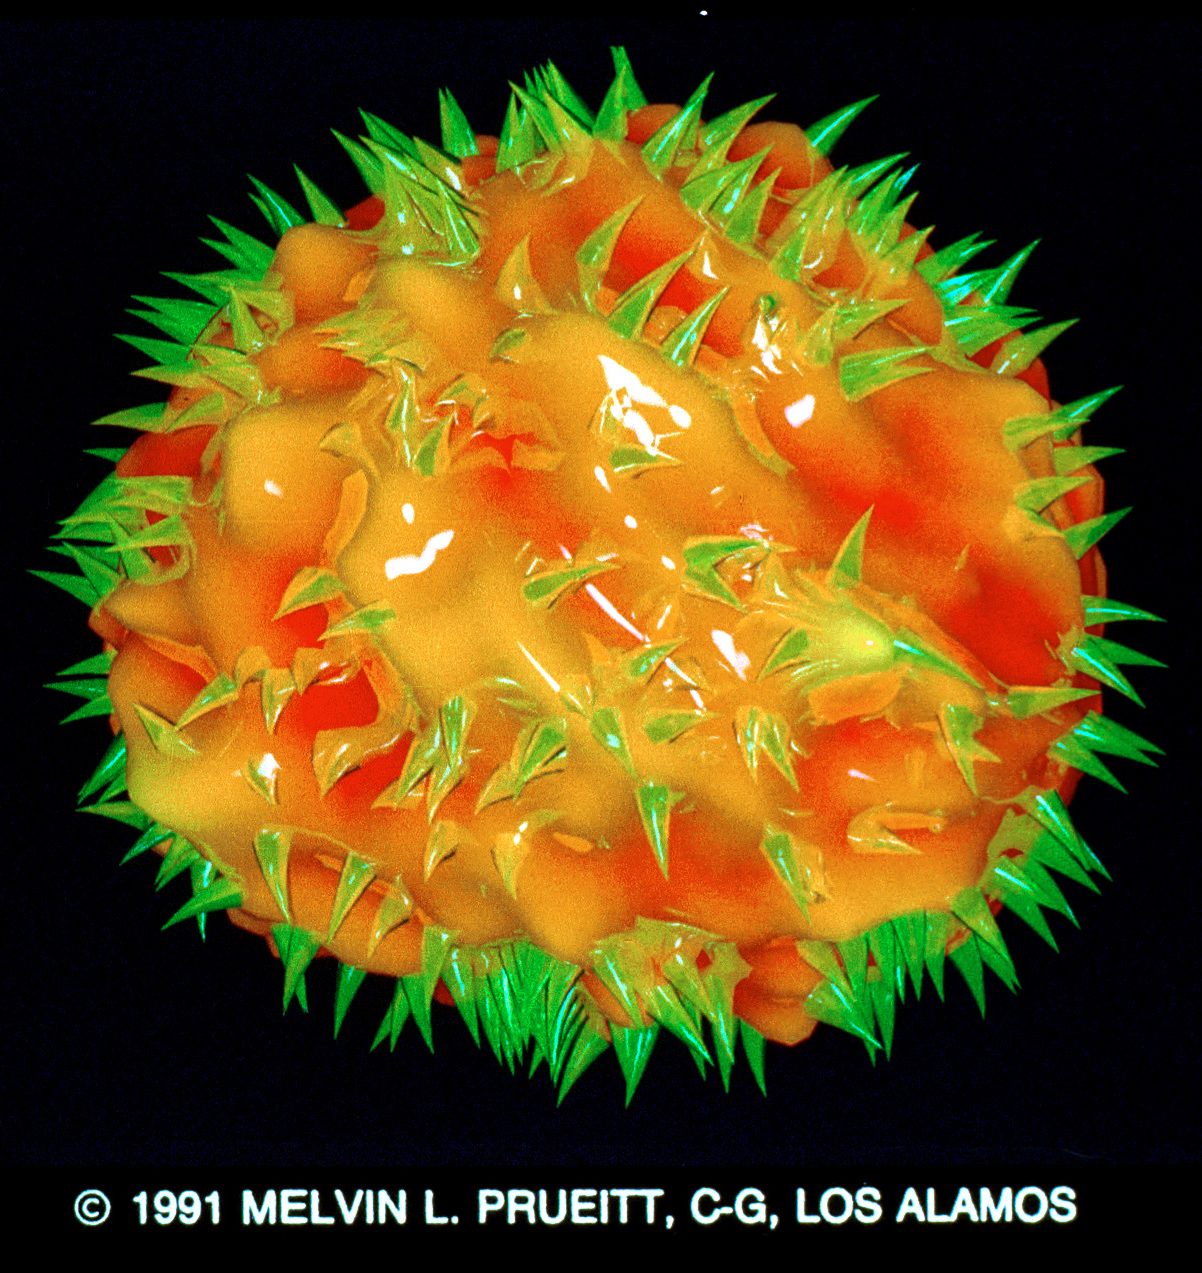
61&62. Human Ovum in Follicle by Melvin L. Prueitt. The images illustrate ray tracing and texture mapping. Data supplied by Babetta Marrone. They were created on a Cray YMP and Dicomed film recorder using SCOPE, the author’s own program. Contact: Melvin L. Prueitt, C-6 Computer Graphics, MS-B272, Los Alamos National Laboratory, Los Alamos, NM 87545; (505) 667-4452.
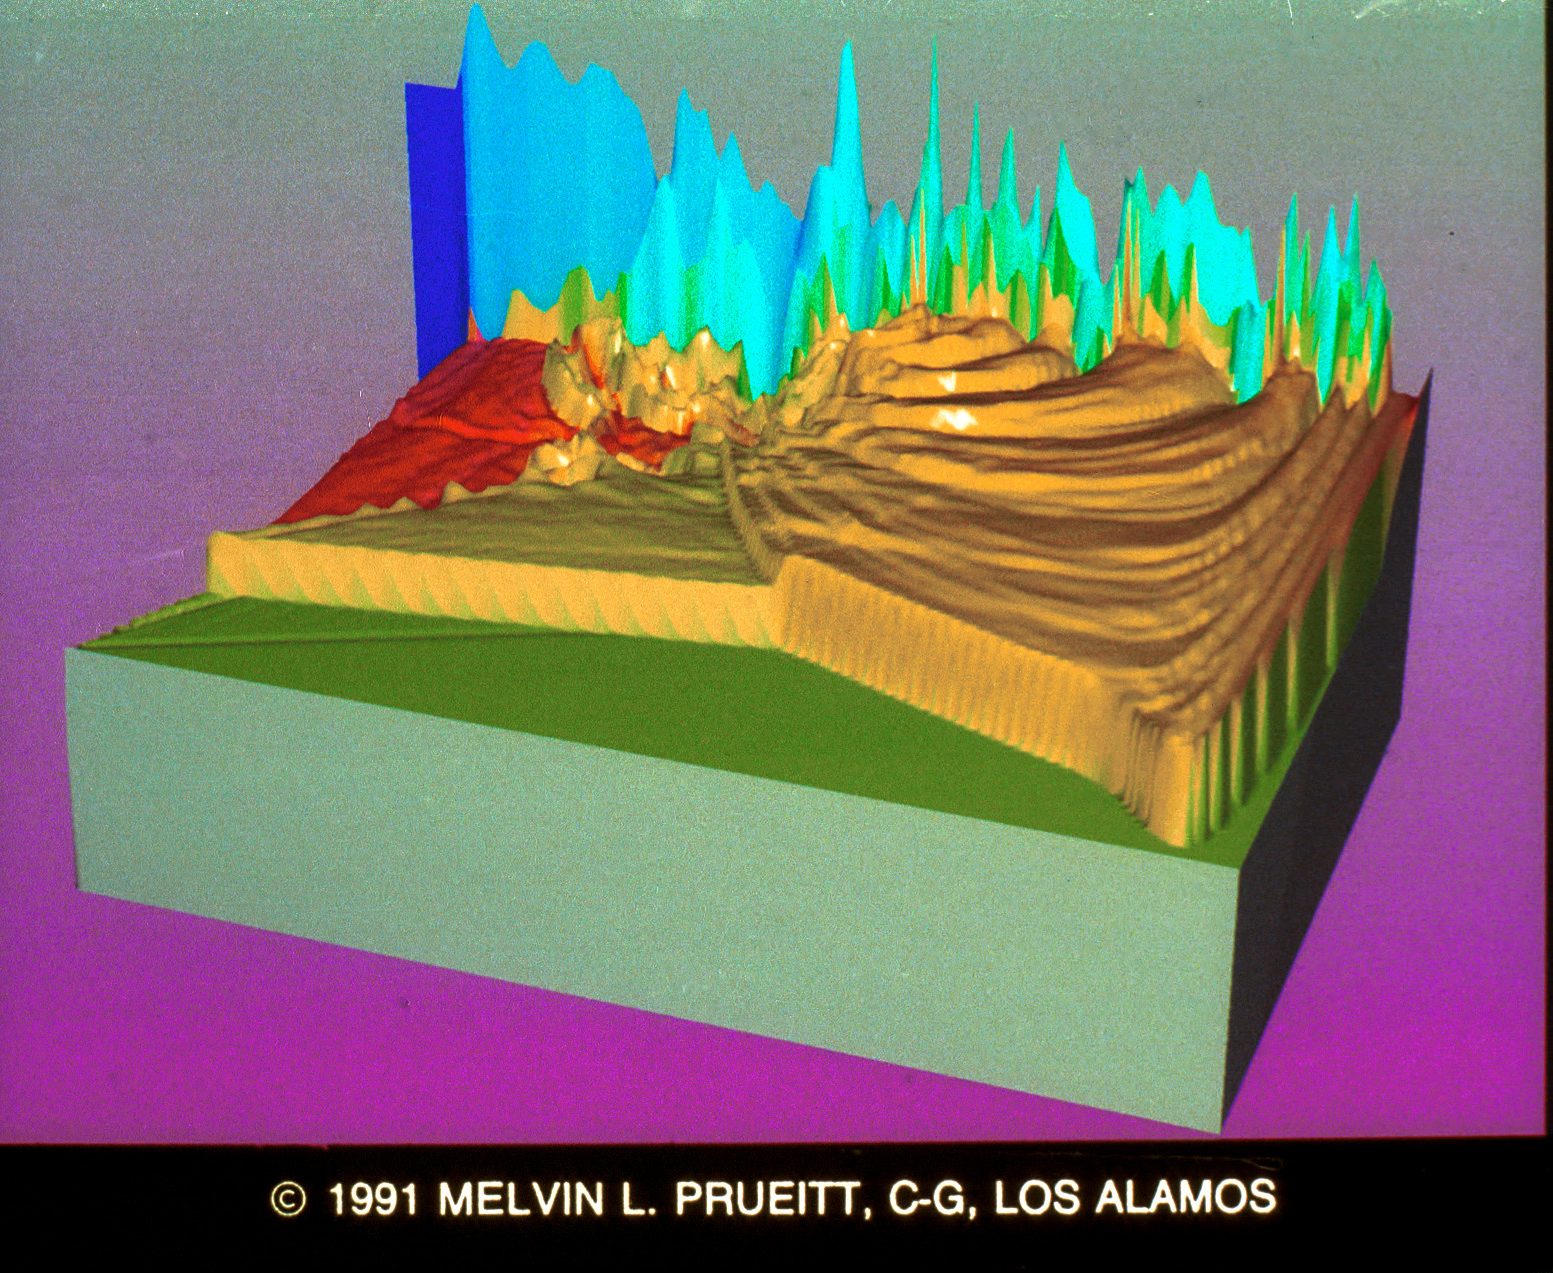
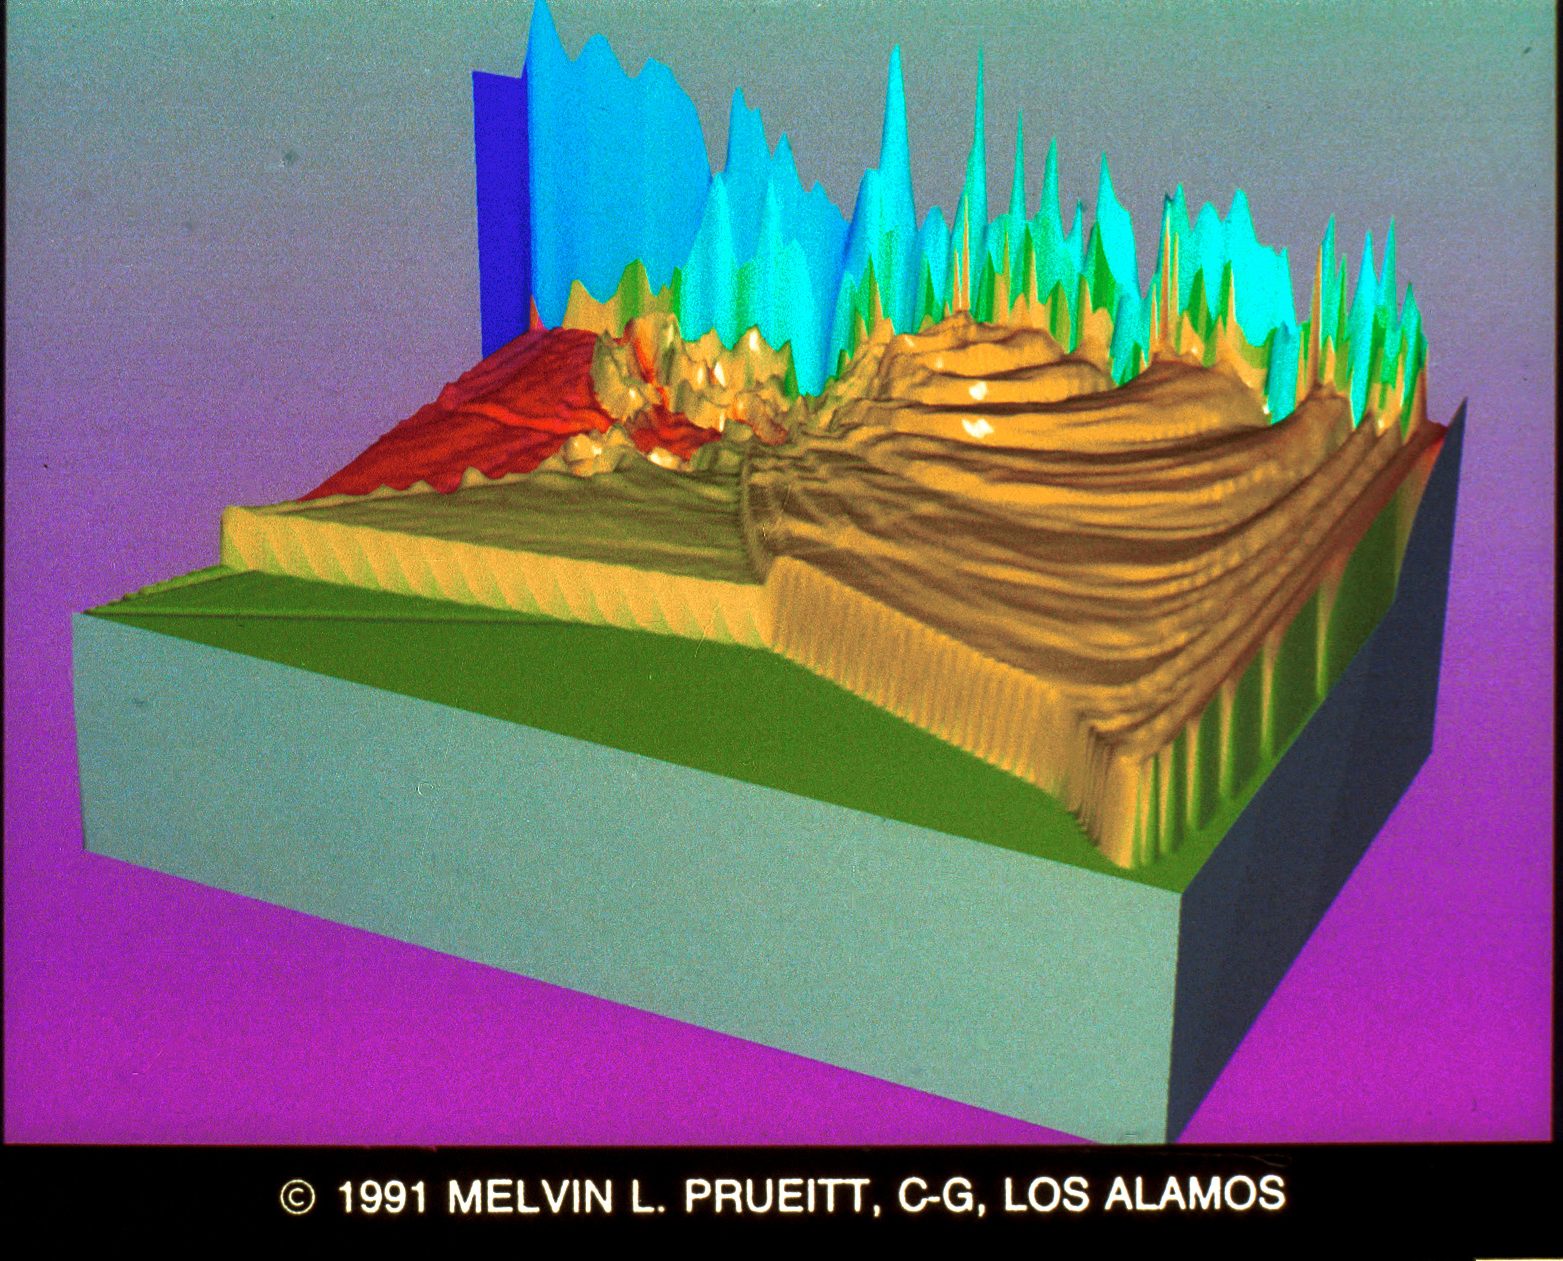
63&64. Nuclear Shock Wave by Melvin L. Prueitt. In these images, height of surface represents density in shock wave. Color represents temperature. Shock is proceeding to left. High peaks are along ground surface. Near points are at high altitude. Data supplied by Manuel Vigil. The images were created on a Cray YMP and Dicomed film recorder using SCOPE, the author’s own program. Contact: Melvin L. Prueitt, C-6 Computer Graphics, MS-B272, Los Alamos National Laboratory, Los Alamos, NM 87545; (505) 667-4452.
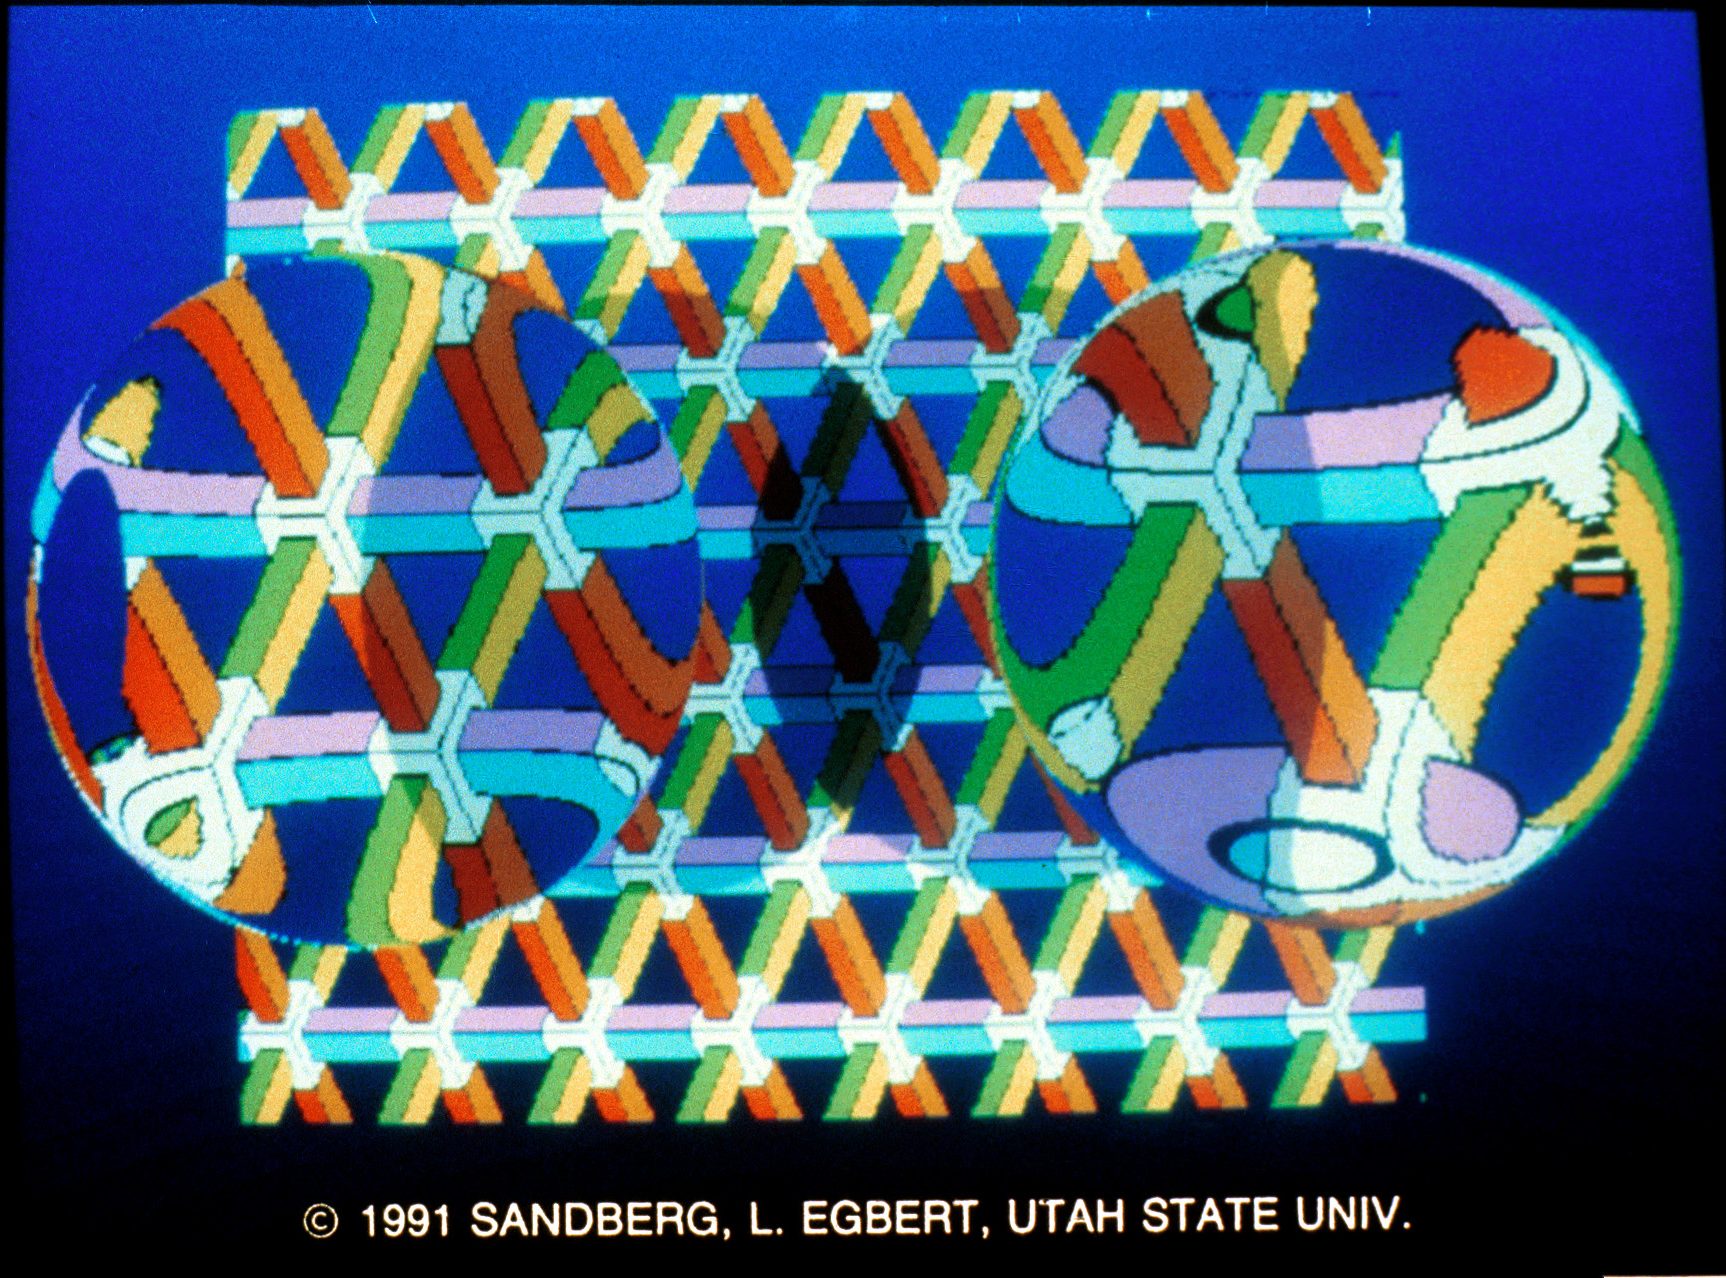
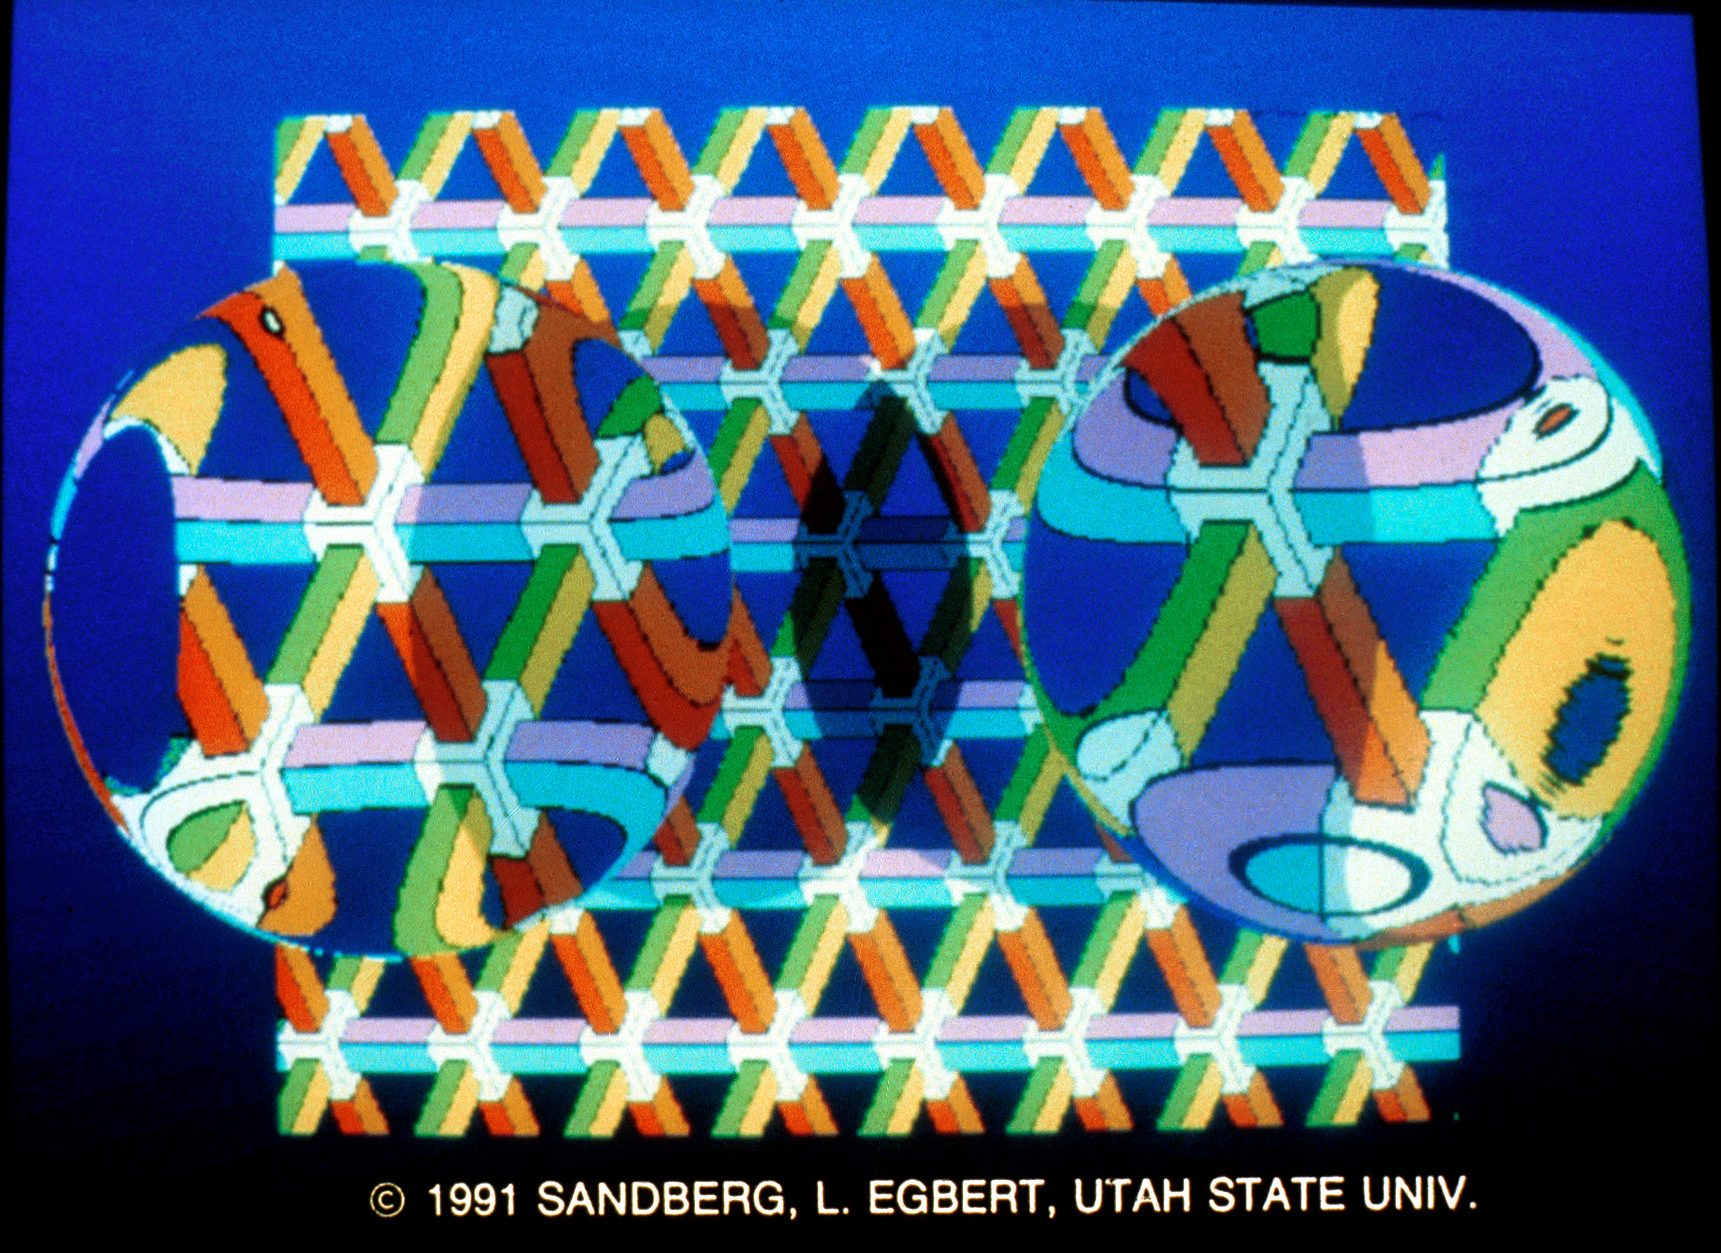
65&66. Magnified Grid by Jabe Sandberg, Larre Egbert. Two transparent spheres with different refractive indices were ray traced in stereo. They were created on a color Mac II using C compiler only. Contact: Larre Egbert, Utah State University, Computer Science Department, Logan, UT 84322-4205; (801) 750-3280.
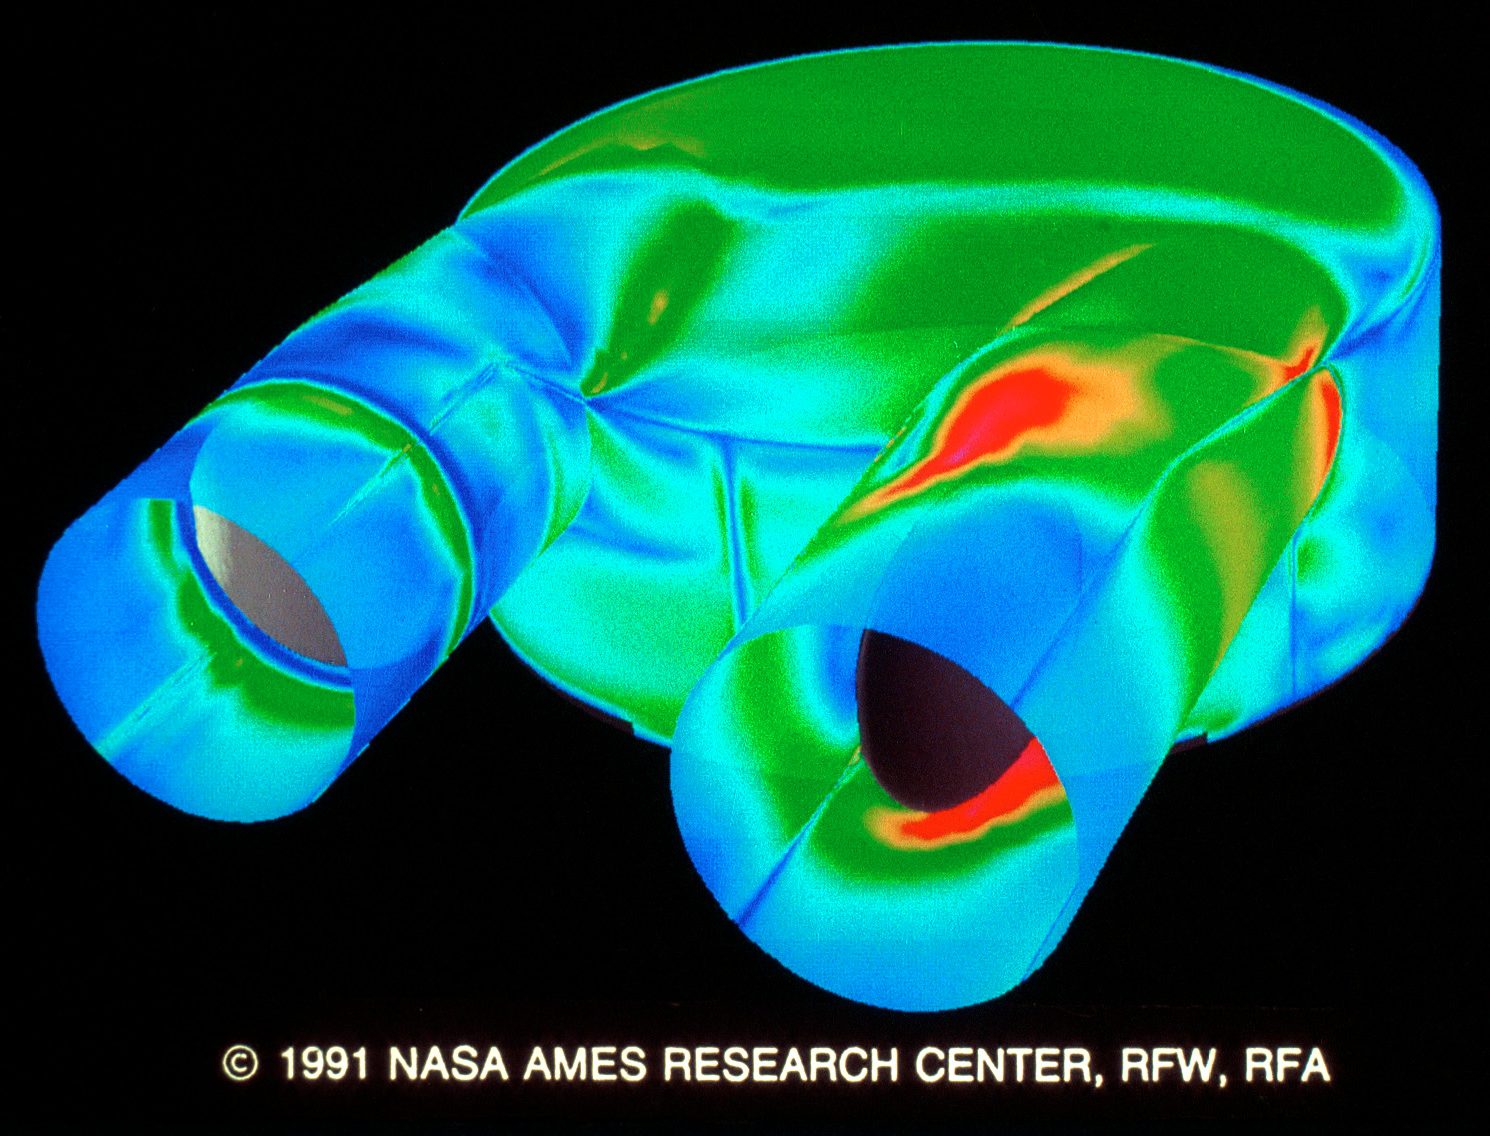
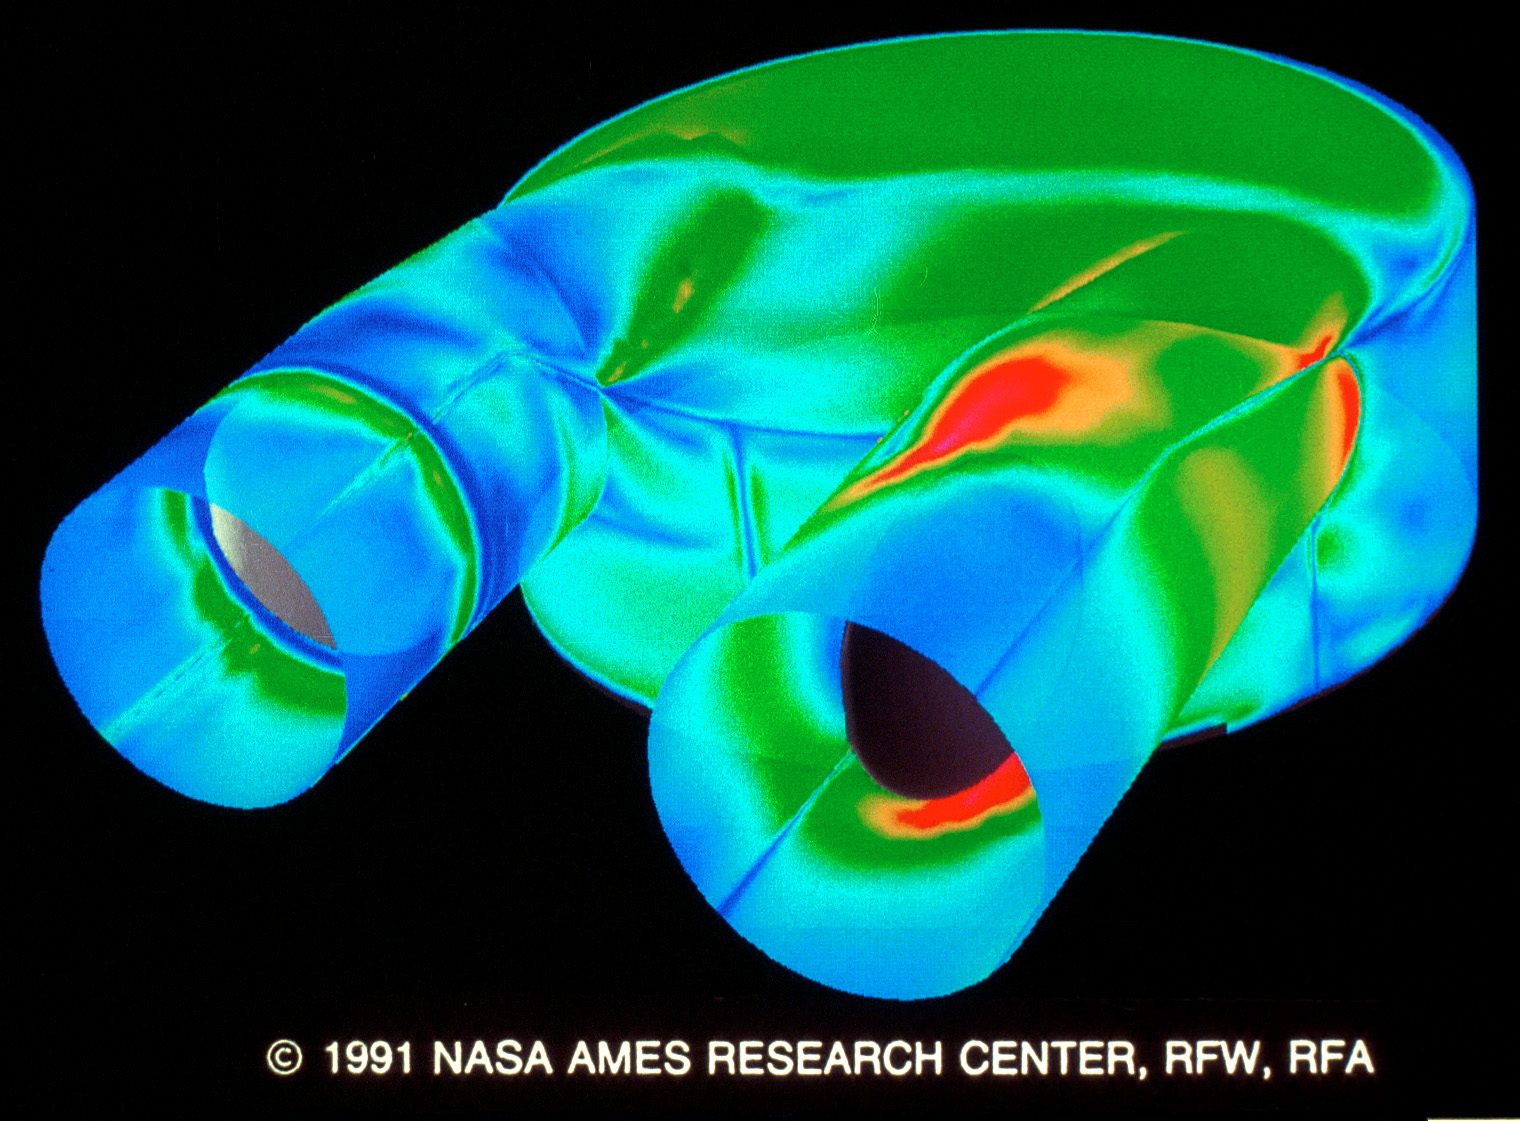
67&68. Flow through the Penn State Artificial Heart (Surfaces Colored by Vorticity Magnitude) by Cetin Kiris, Chris Gong, Dochan Kwak, Stuart Rogers. The stereo slides show the high shear regions which can damage the red blood cells in the blood flow. The surfaces of the artificial heart are colored by the vorticity magnitude in order to indicate high/low shear regions at cycle time of 0.375. At that time, the pusher plate is moving down in the main chamber, the inflow valve is open and the outflow valve closed. They were created on a Cray YMP and SGI 4D/70GT using PLOT3D, SURF and GAS. Contact: Chris Gong, Sterling Software at NASA Ames, MS 258-2, Moffett Field, CA 94035; (415) 604-4459.
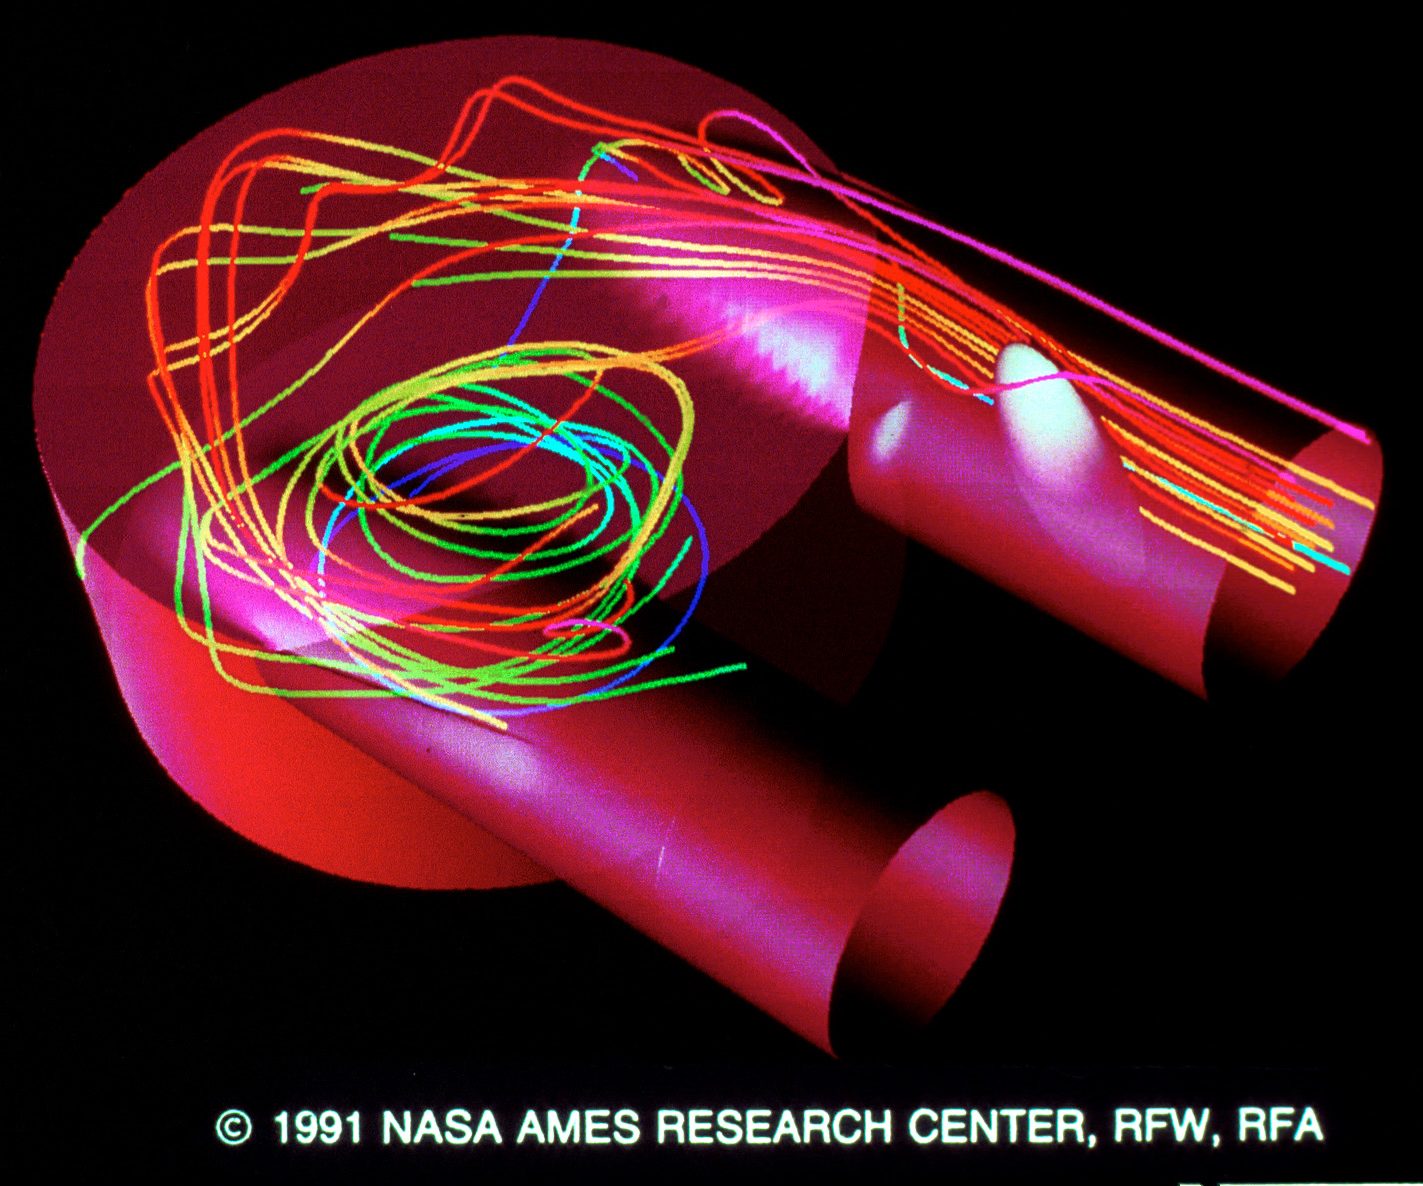
69&70. Flow through the Penn State Artificial Heart (Particle Traces) by Cetin Kiris, Chris Gong, Dochan Kwak, Stuart Rogers. The stereo slides show the swirling motion of the flow, and the formation of a core vortex inside the chamber are illustrated using particle traces colored by height. Secondary and separated regions can cause blood clotting. They were created on a Cray YMP and SGI 4D/ 70GT using PLOT3D, SURF and GAS. Contact: Chris Gong, Sterling Software at NASA Ames, MS 258-2, Moffett Field, CA 94035; (415) 604-4459.
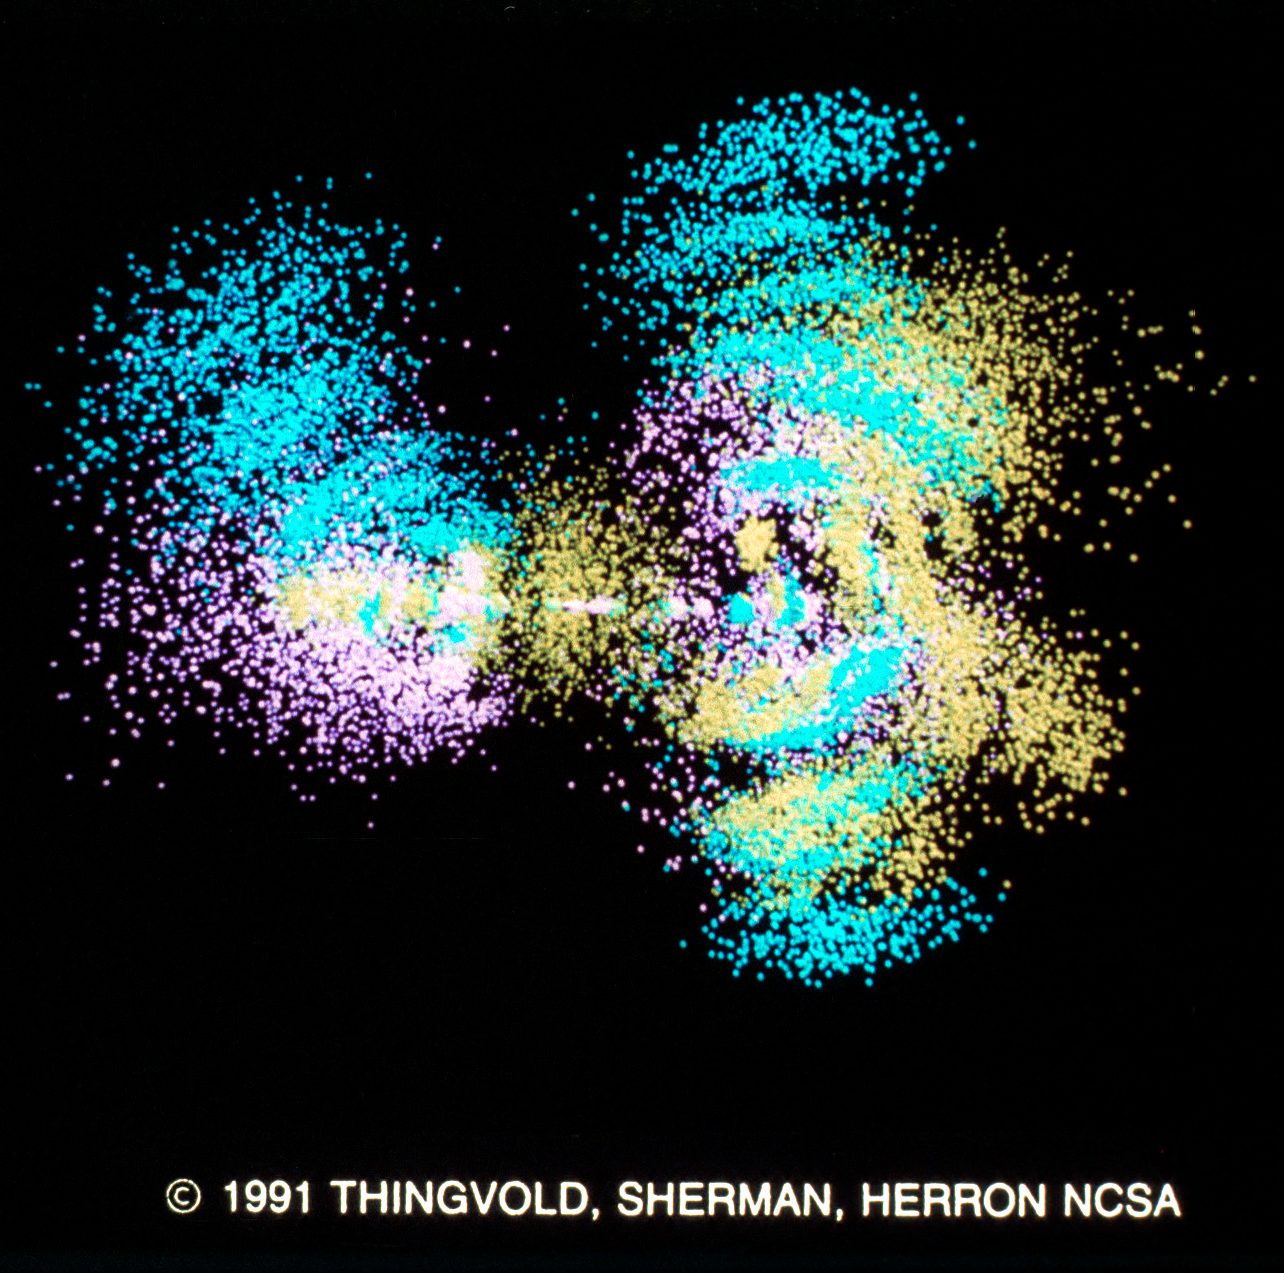
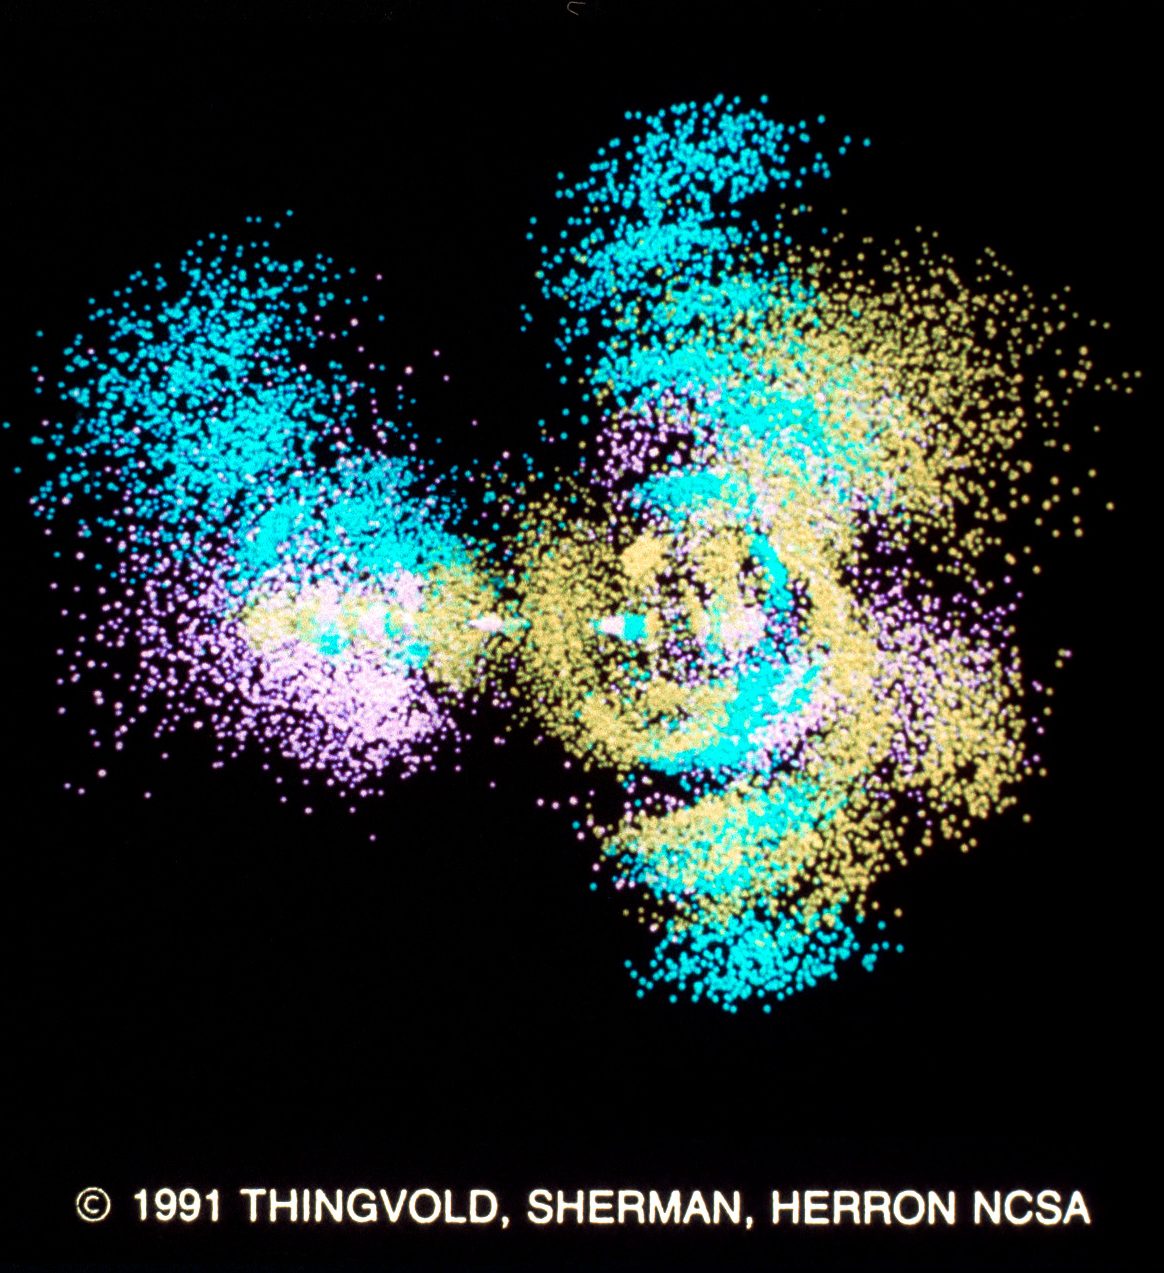
71&72. Temporal Displacement of Leakotriene by Jeffrey A. Thingvold, William R. Sherman, David K. Herron. Many dynamic time steps for each of the three molecules were rendered together with scaled down atoms, then superimposed to compare the shapes of the molecules over time. The images were created on a SGI 4D/240GTX using Wavefront Advanced Visualizer and various in-house software. Contact: Jeffrey Thingvold, NCSA at the University of Illinois at Urbana-Champaign, 605 E. Springfield Ave., Champaign, IL 61820; (217) 244-1996.
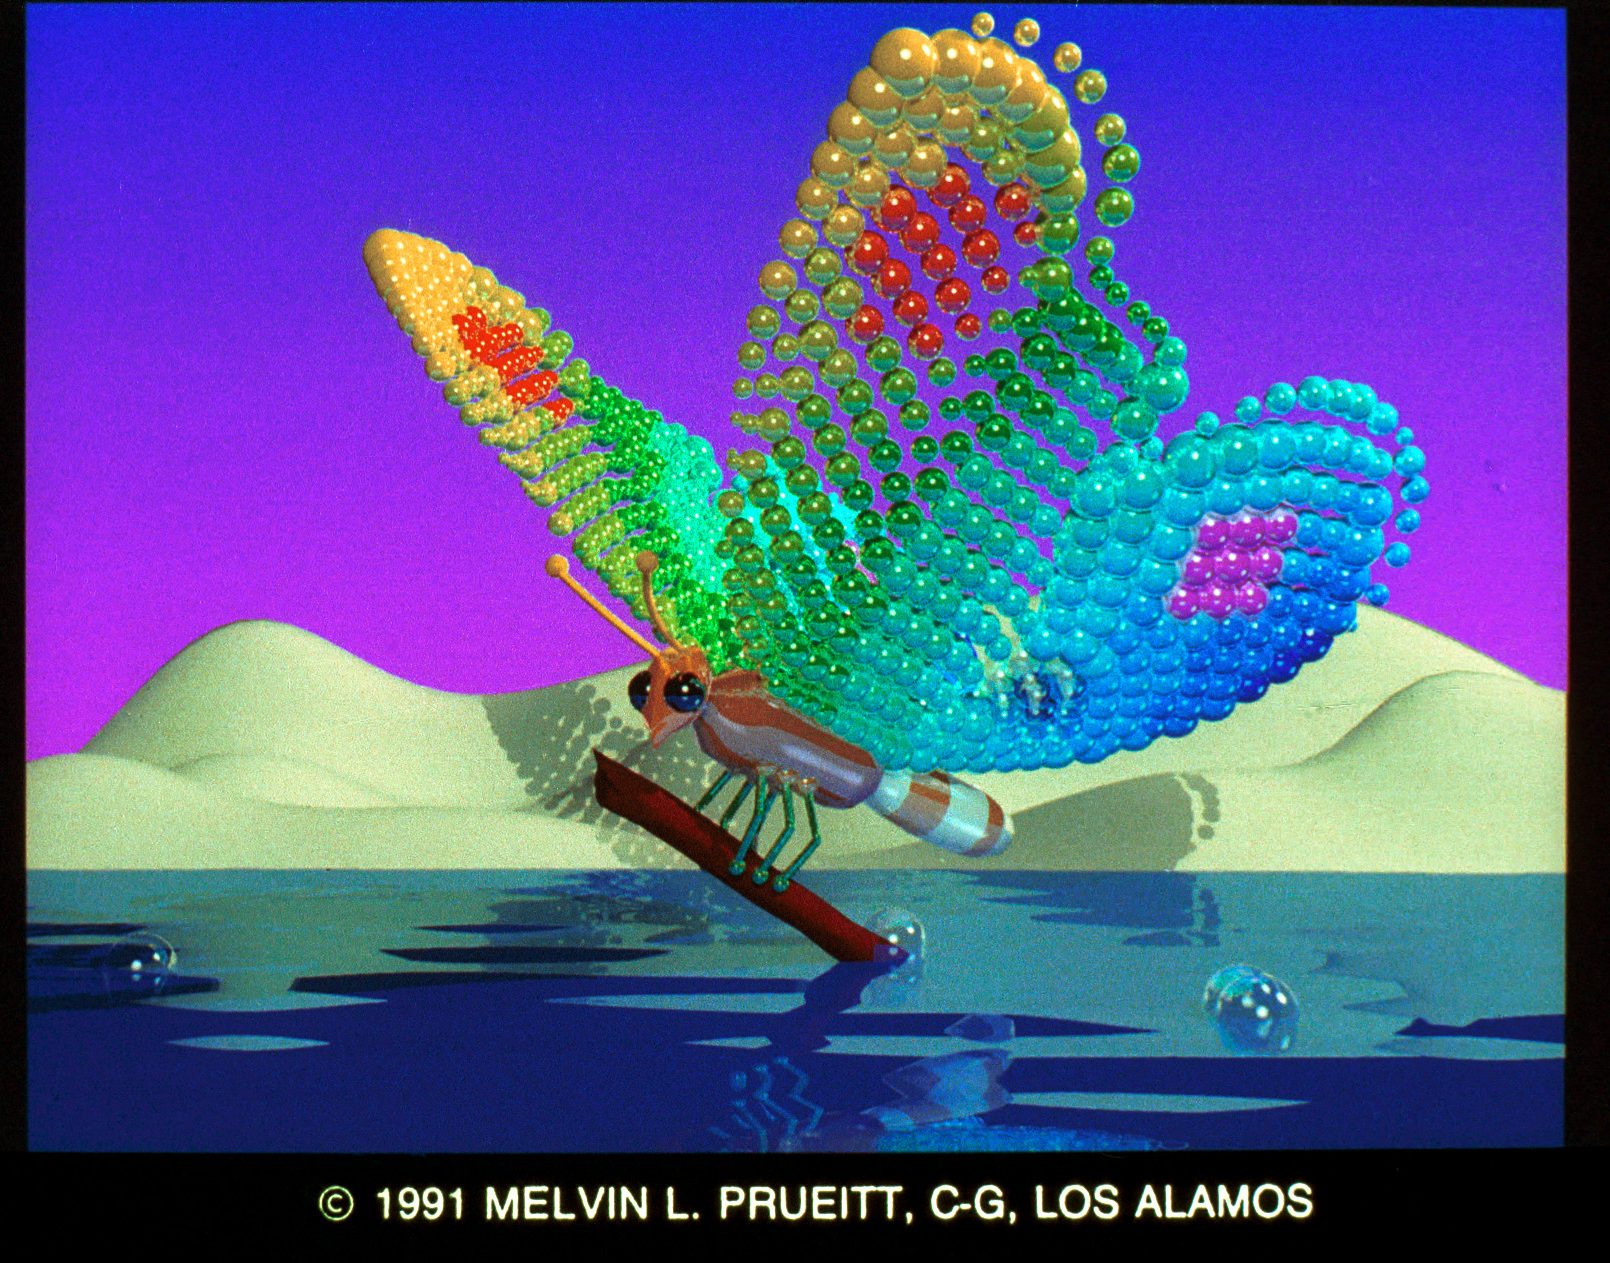
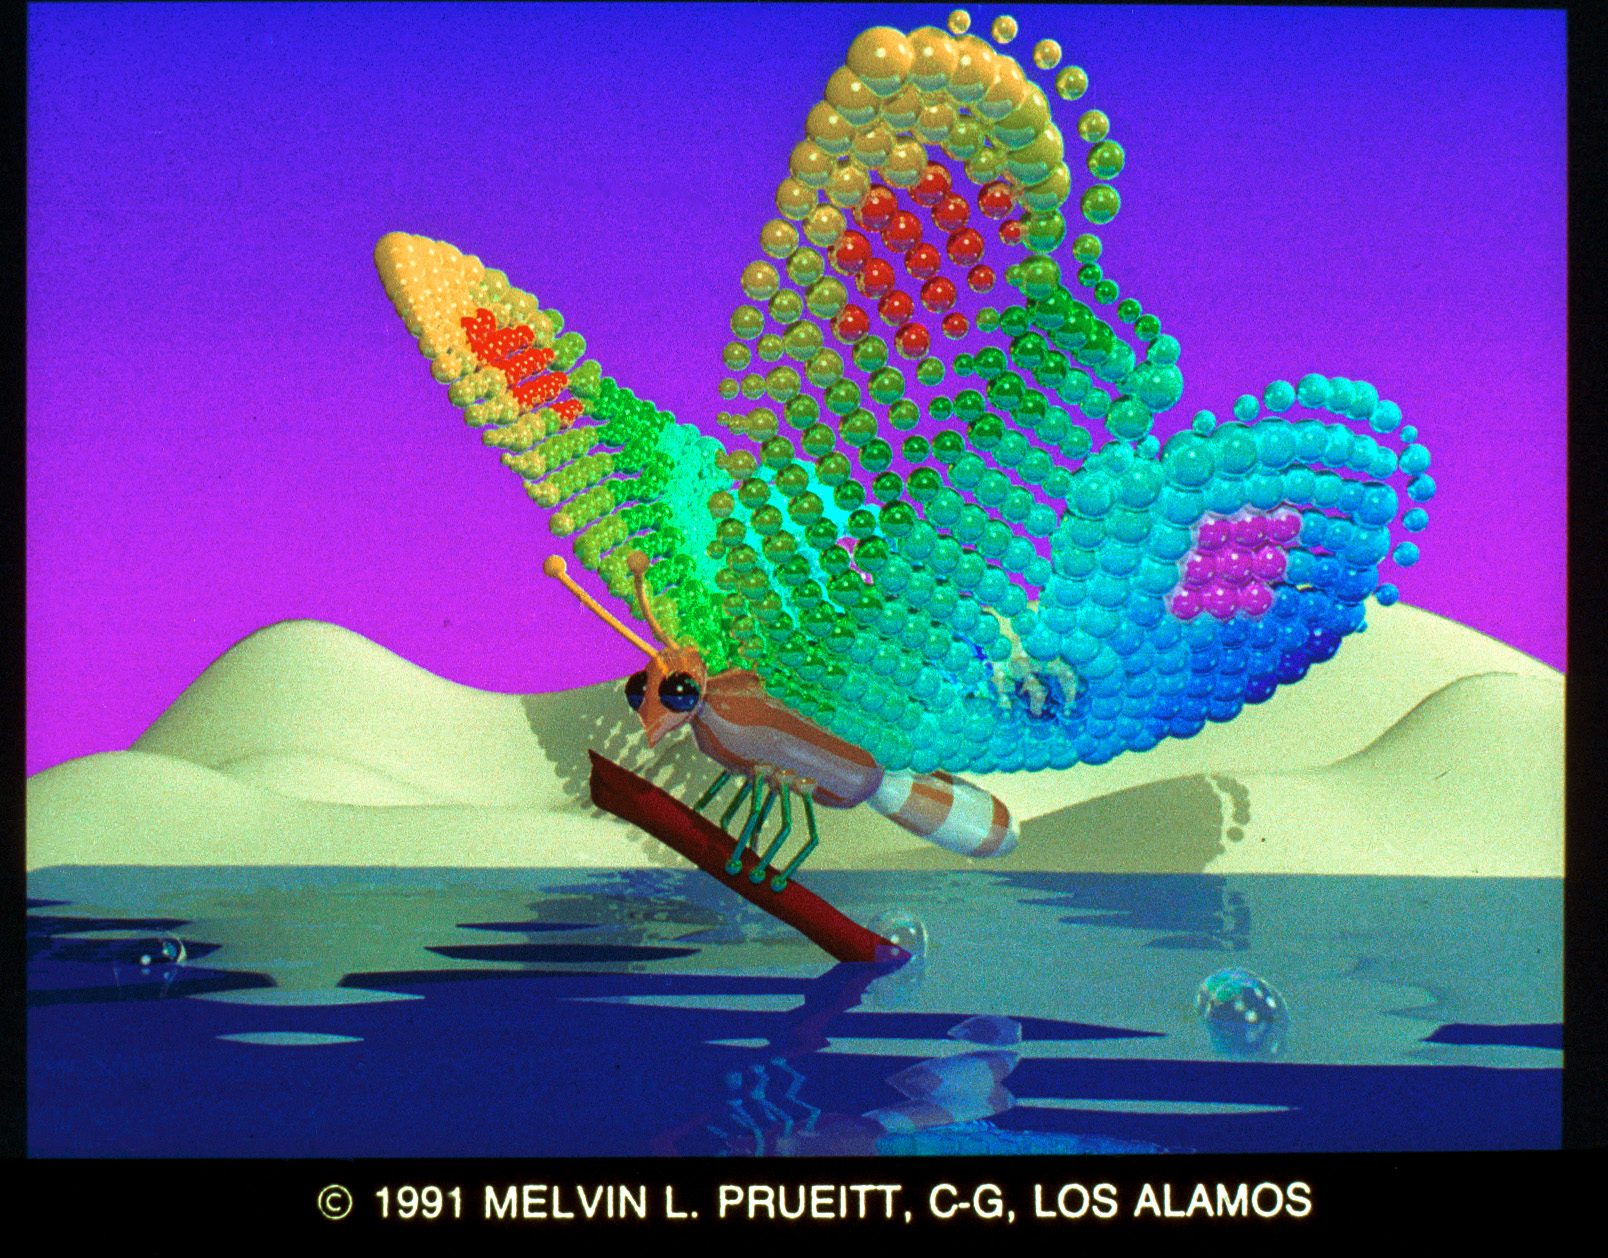
73&74. Contemplating Lift-Off by Melvin L. Prueitt. The slides show ray tracing and were created on a Cray YMP and Dicomed film recorder using SCOPE, the author’s own program. Contact: Melvin L. Prueitt, C-6 Computer Graphics, MS-B272, Los Alamos National Laboratory, Los Alamos, NM 87545; (505) 667-4452.
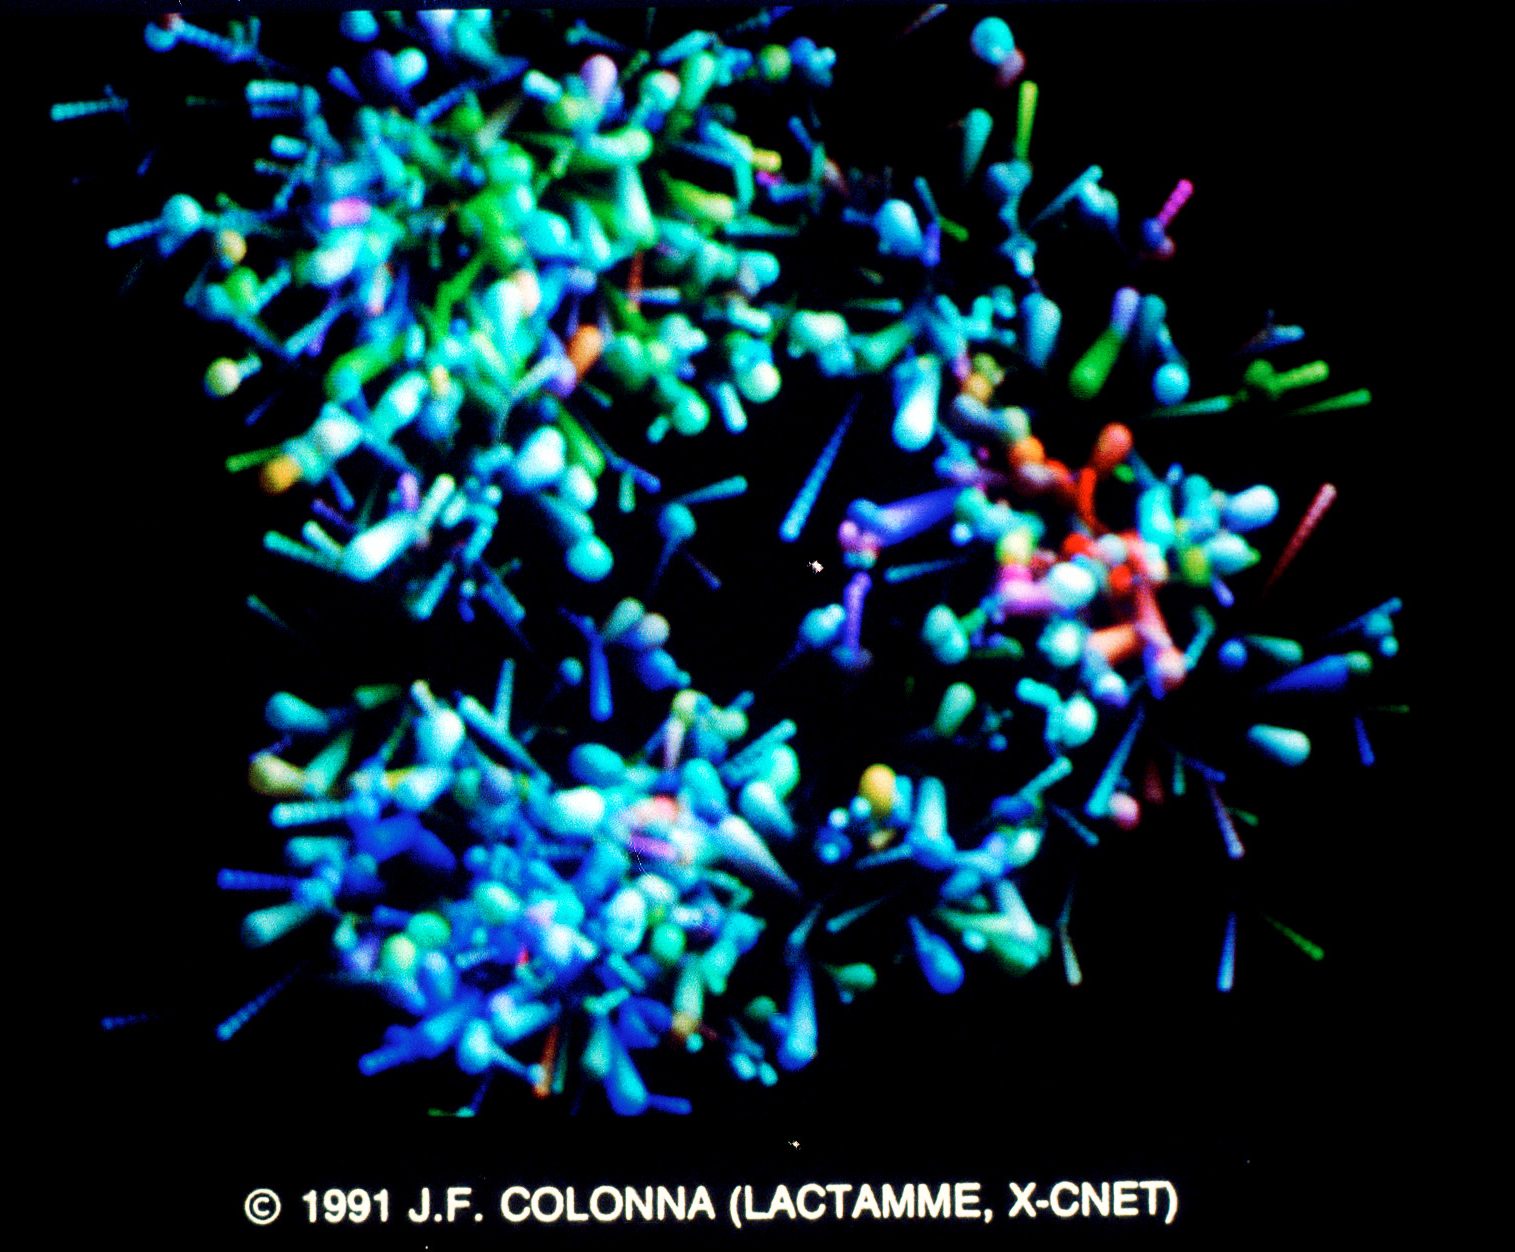
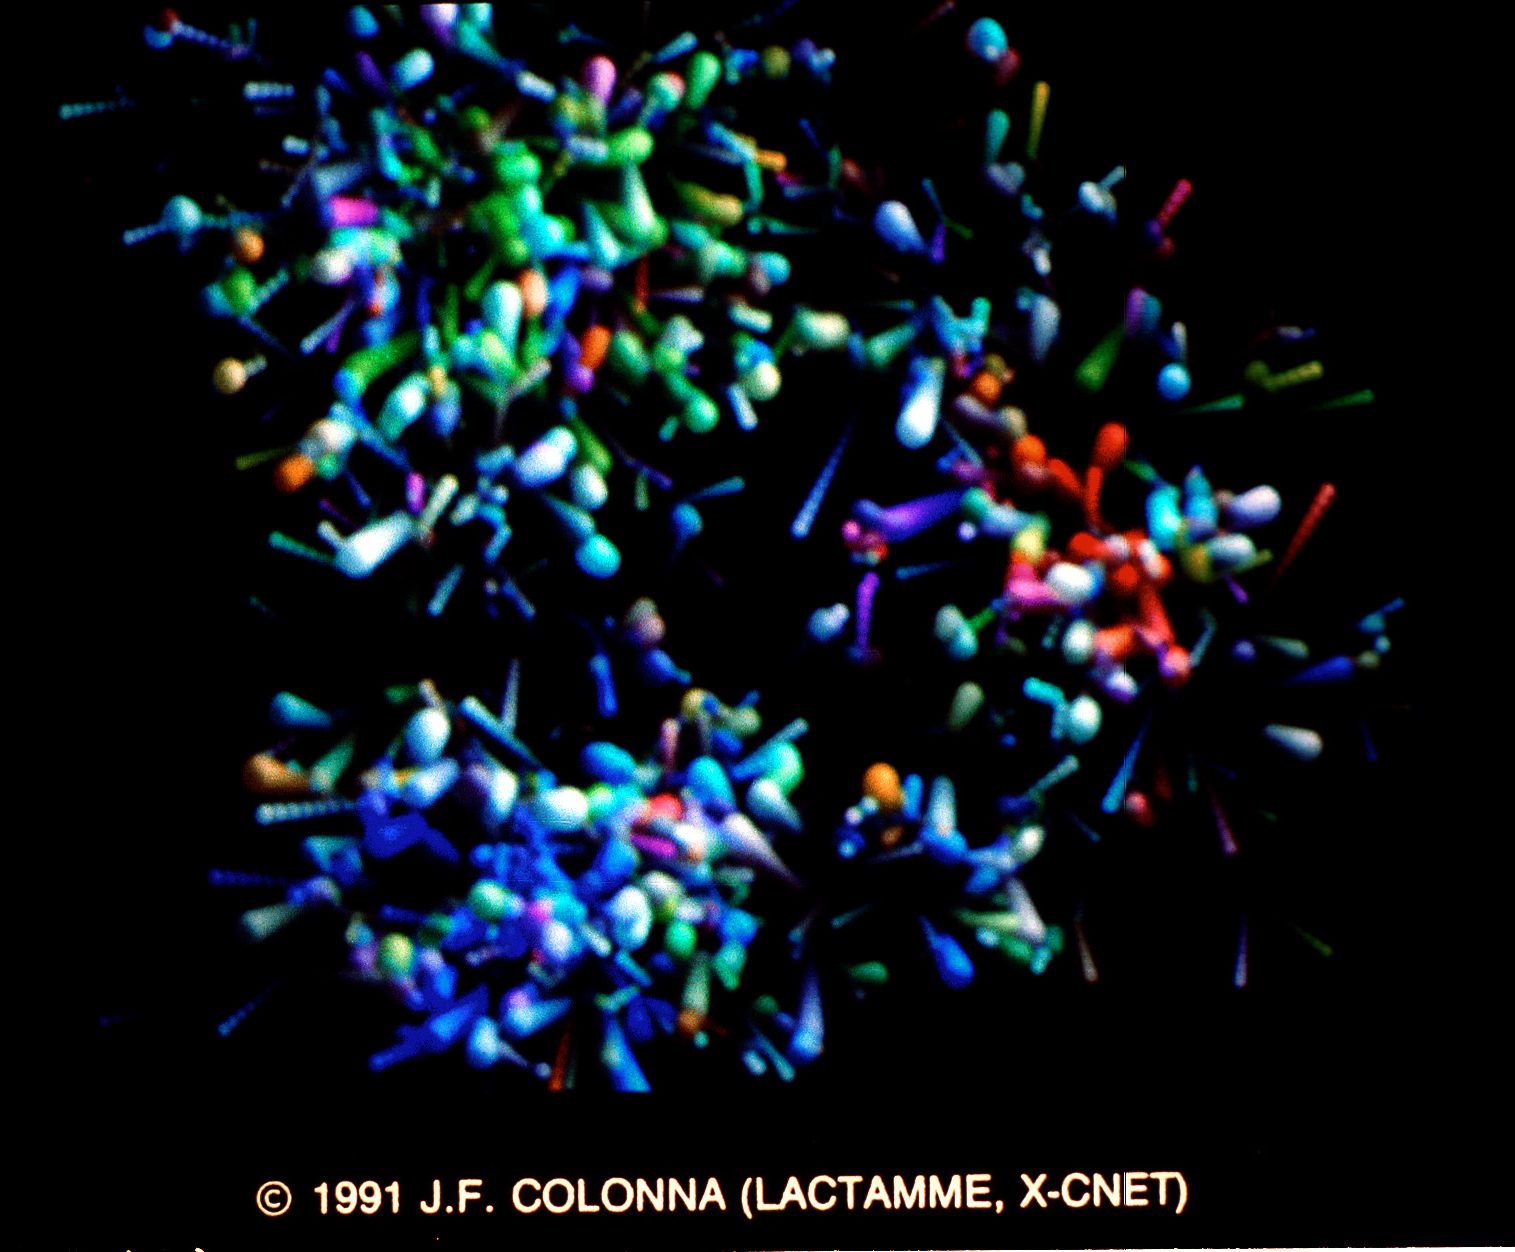
75&76. Quark Structure of the Proton by Jean-Francois Colonna. The slide pair shows 10–25seconds in the life of a proton· and includes motion blur and fuzzy effects. This is the first time such simulation and visualization have been done. The images were created on a Bull DPX 5000 and SGI 4D/20 using the author’s own software. Contact: Jean-Francois Colonna, Lactamme, Ecole Polytechnique, 91128 Palaiseau Cedex, France; 33-1-09-33-40-53.
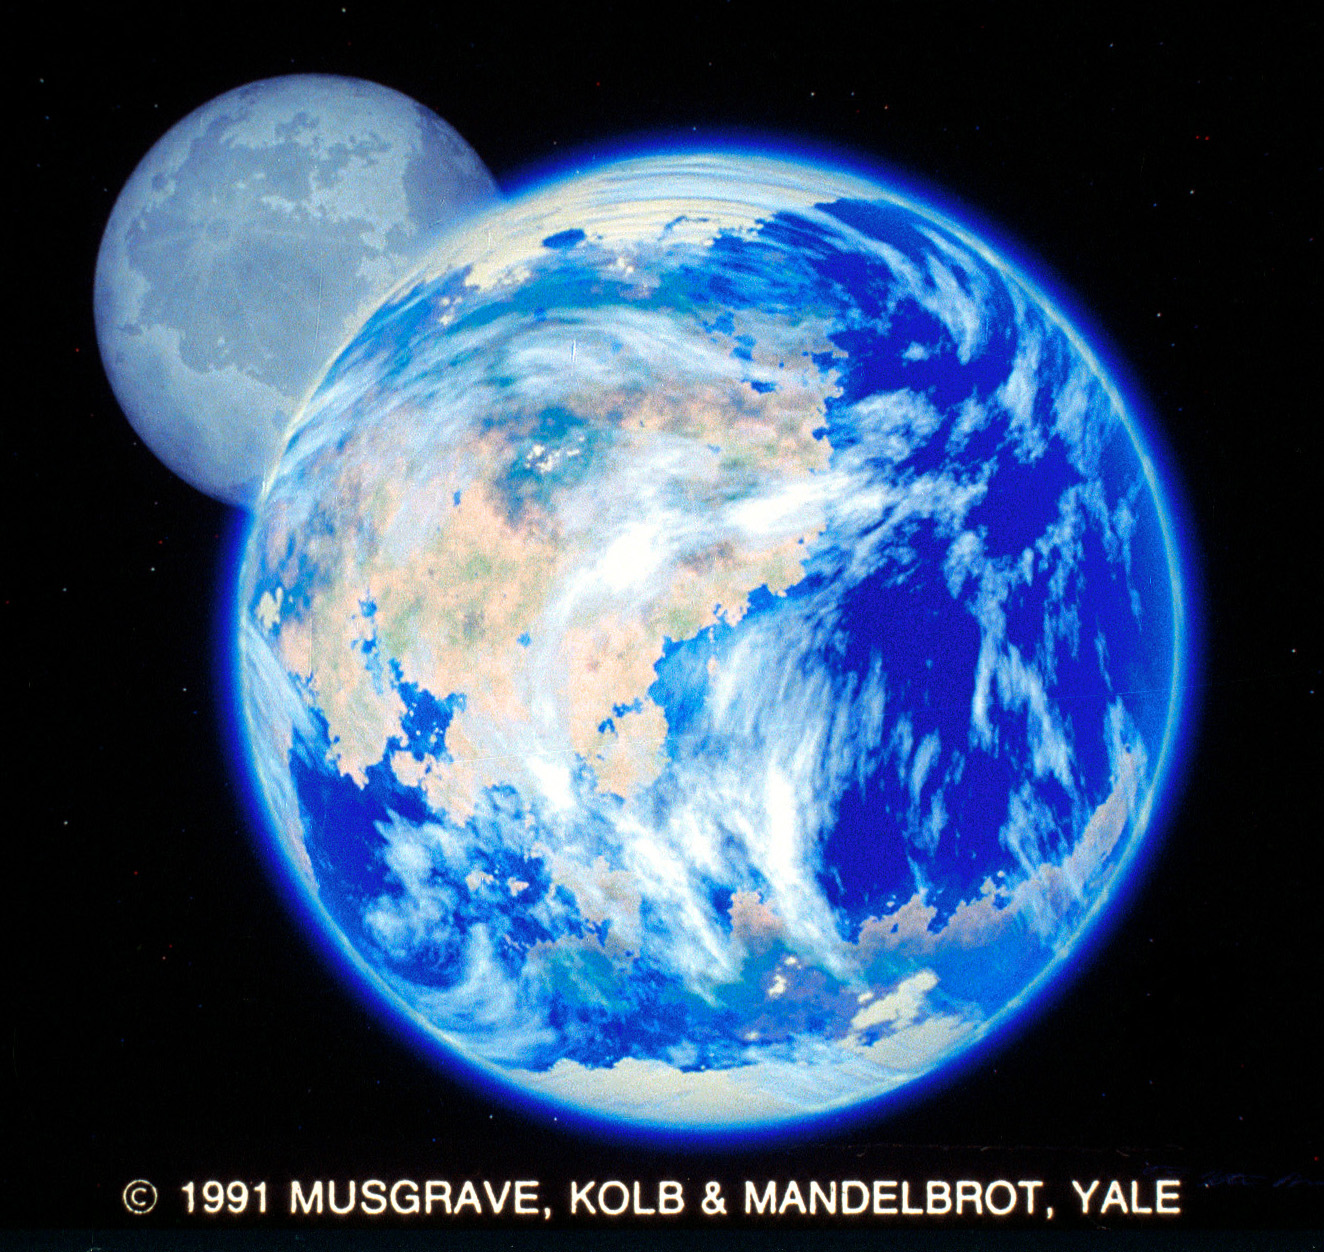
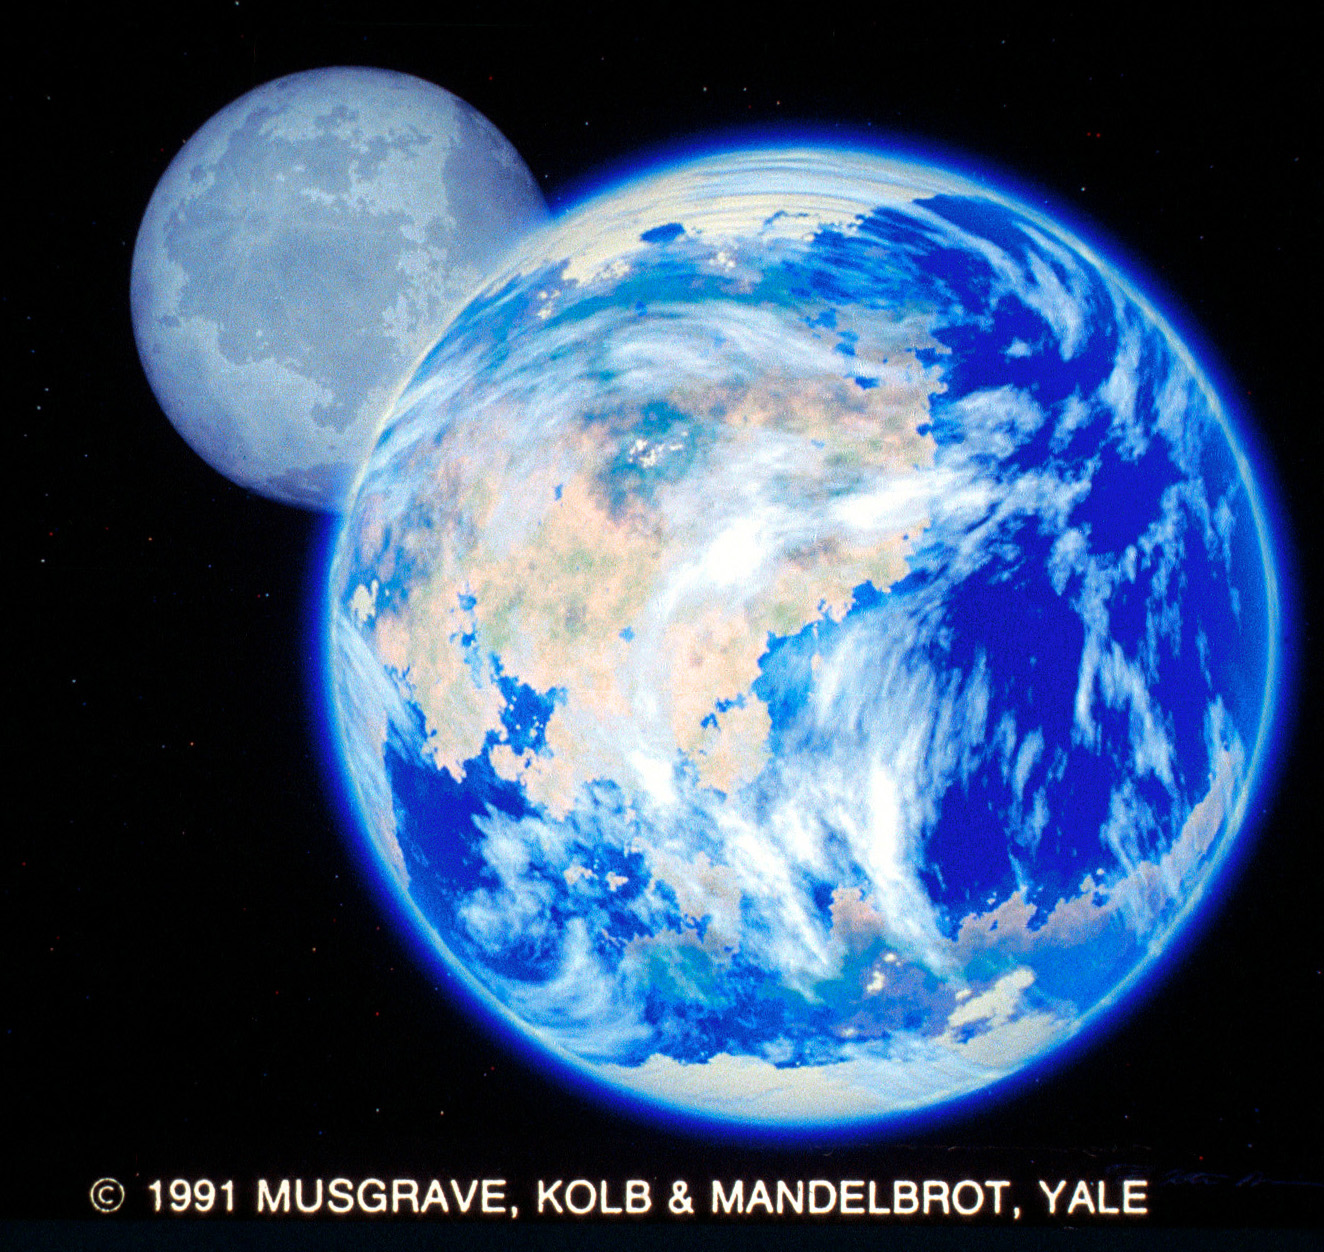
77&78. Gaea & Selene by F.K. Musgrave, C.E. Kolb, B .B. Mandelbrot. Three spheres, three fractal procedural textures and an atmospheric model are combined in a ray-traced simulation of an earthlike planet and a moonlike satellite. (The three spheres are the moon, earth and the clouds.) Note the scattering model used in the atmosphere, which causes the polar caps to appear yellowish and the moon to appear as through smog, near the limb of the planet. As the models are entirely procedural, they can be rendered with any level of detail. Thus they are suitable for a continuous zoom or fly-by animation. The images were created on an Apollo DNIOOOO using Rayshade and C-Linda. Contact: Ken Musgrave, Yale University Math Department, Box 2155 Yale Station, New Haven, CT 06520; (203) 432-4016.
Publication Documents:
1991 Stereo Slide Set Images: