“1989 Stereo Slide Set”, 1989
Title:
- 1989 Stereo Slide Set
Year:
- 1989
Conference:
Description:
The stereo slide set has 76 slides, two each of 36 images. One slide of each image is printed here in black and white to facilitate locating information about the images. The full color 35mm slide set can be ordered from: ACM order department, P.O. Box 64145, Baltimore, MD 21264; 1-800-342-6626. The ACM order number for the SIGGRAPH ’89 stereo slide set is 915892. The cost is $38 for members; $49 for non-members.
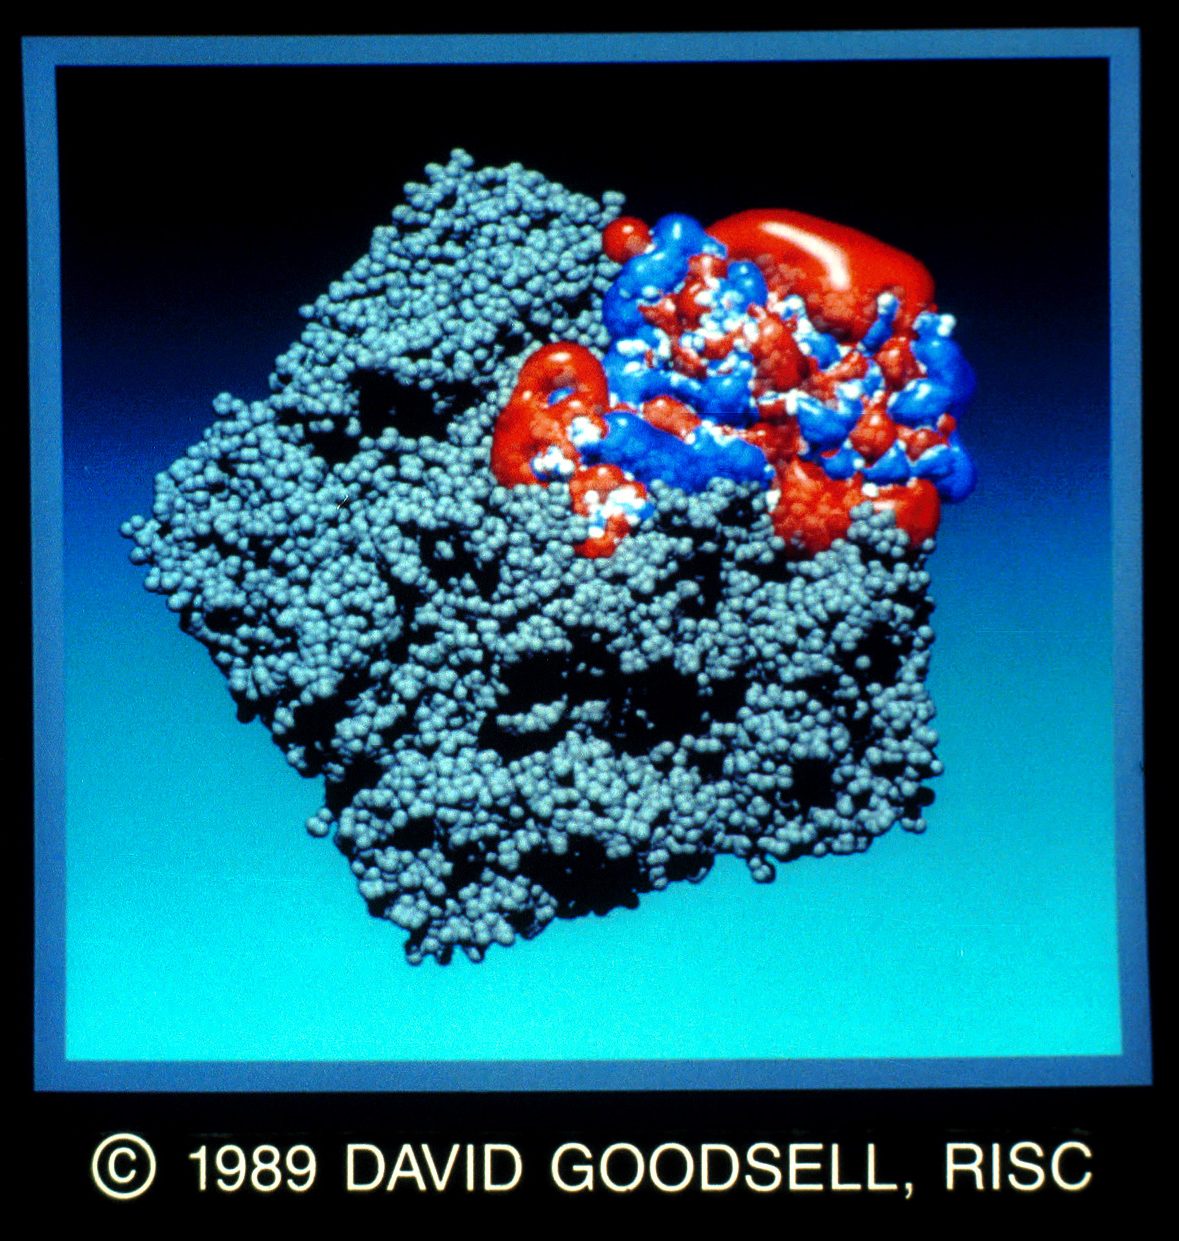
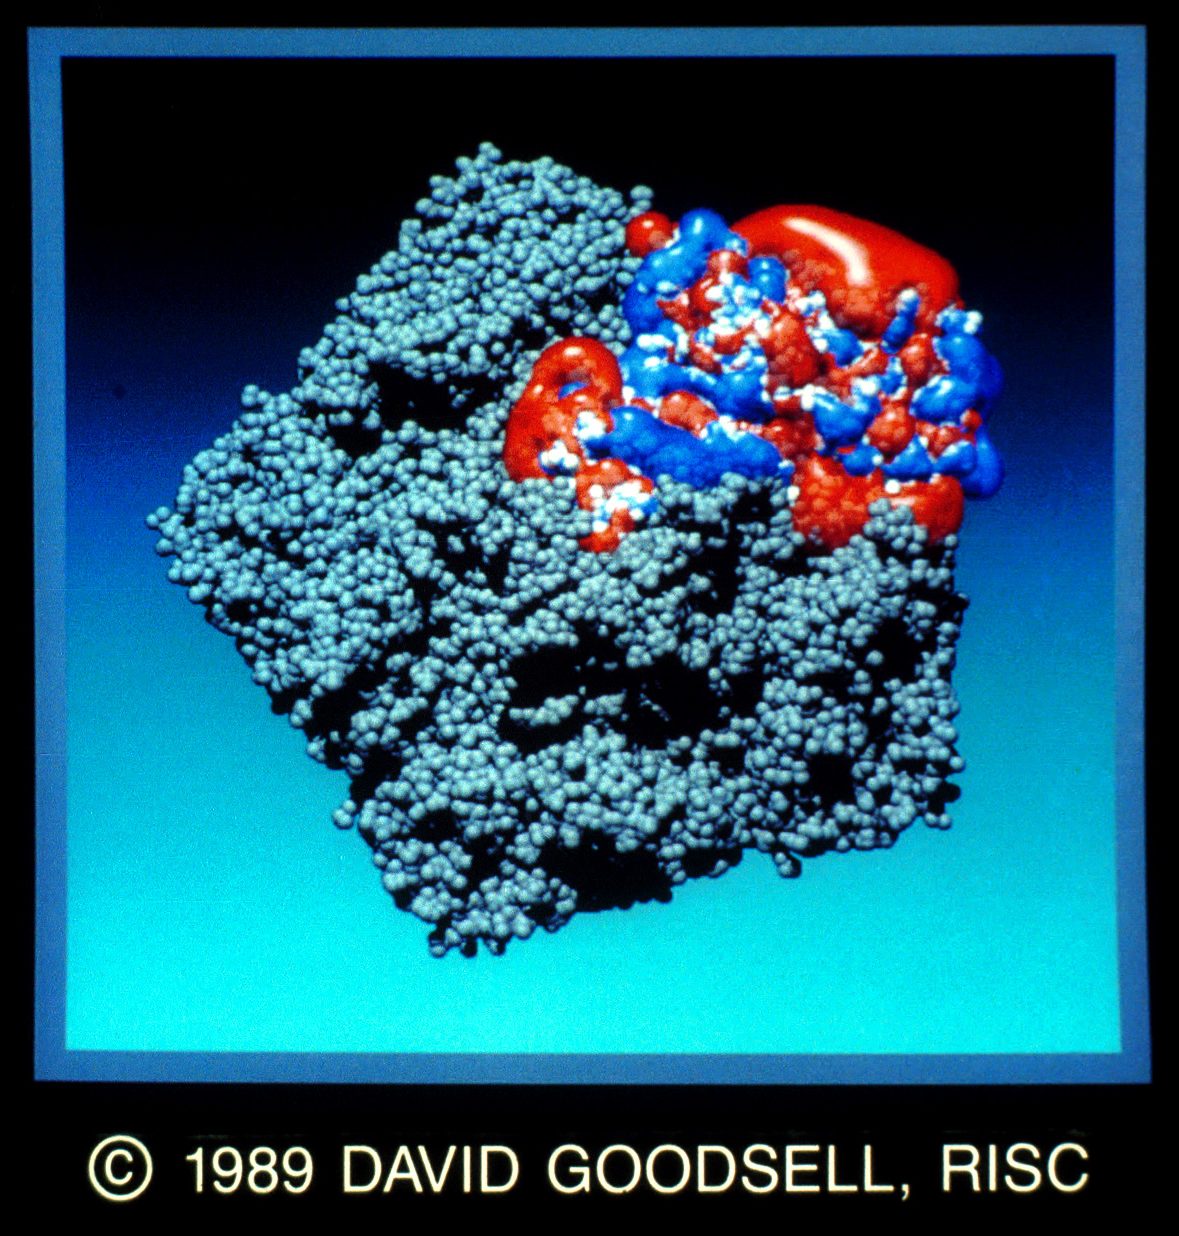
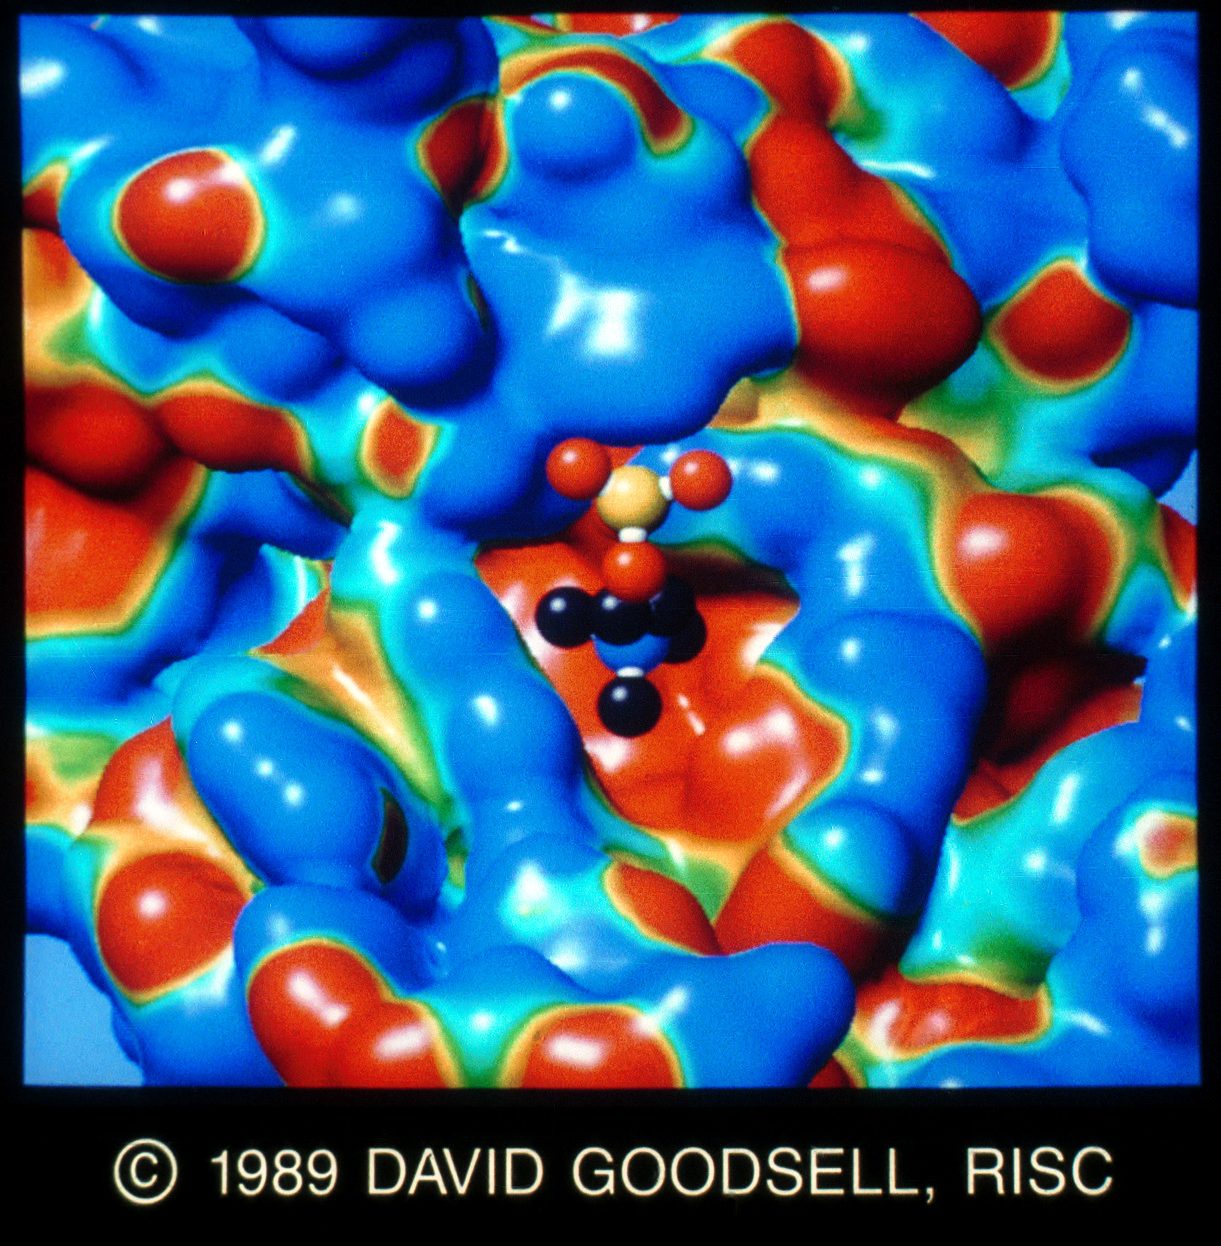
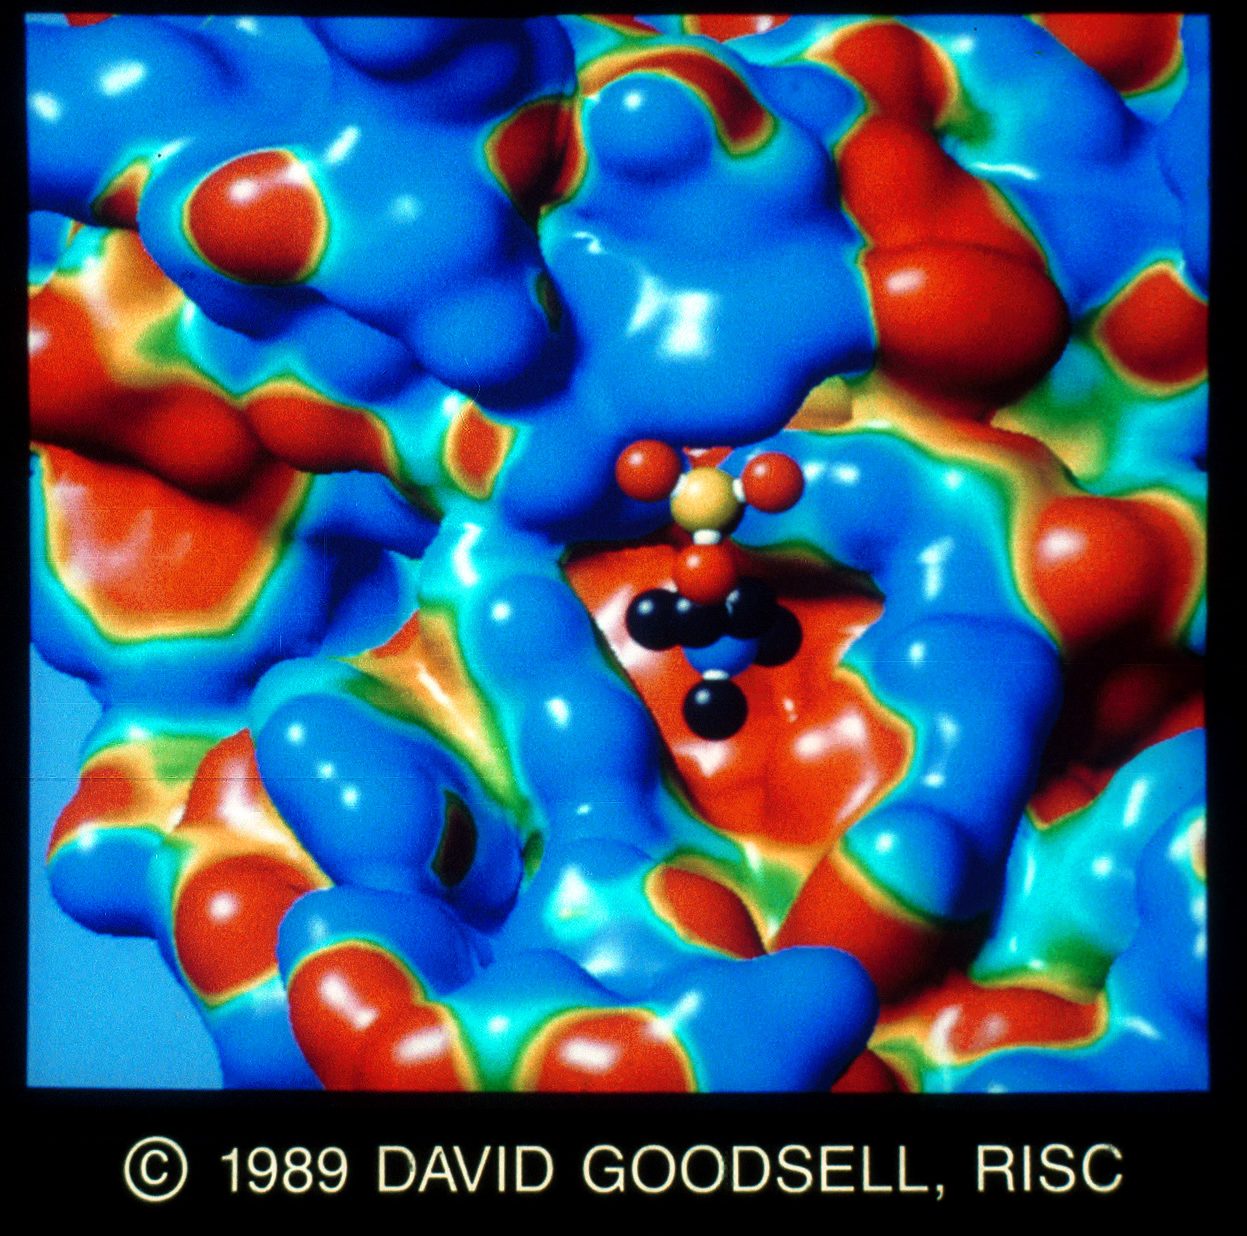
1&2. Antibody Binding Site by D. Goodsell and A. Olson. The RMSVOLUME software package, an in-house volume rendering program (J. Mol. Graphics 7, (1989), 41-47) was used on a Convex C1, C2 and Sun with TAAC1 to make the image. Volume rendering with three-dimensional texture mapping is used to visualize the active site of an antibody molecule. Contact: David Goodsell, Department of Molecular Biology MB5, Research Institute of Scripps Clinic, La Jolla, CA 92037, (619) 554-4392.
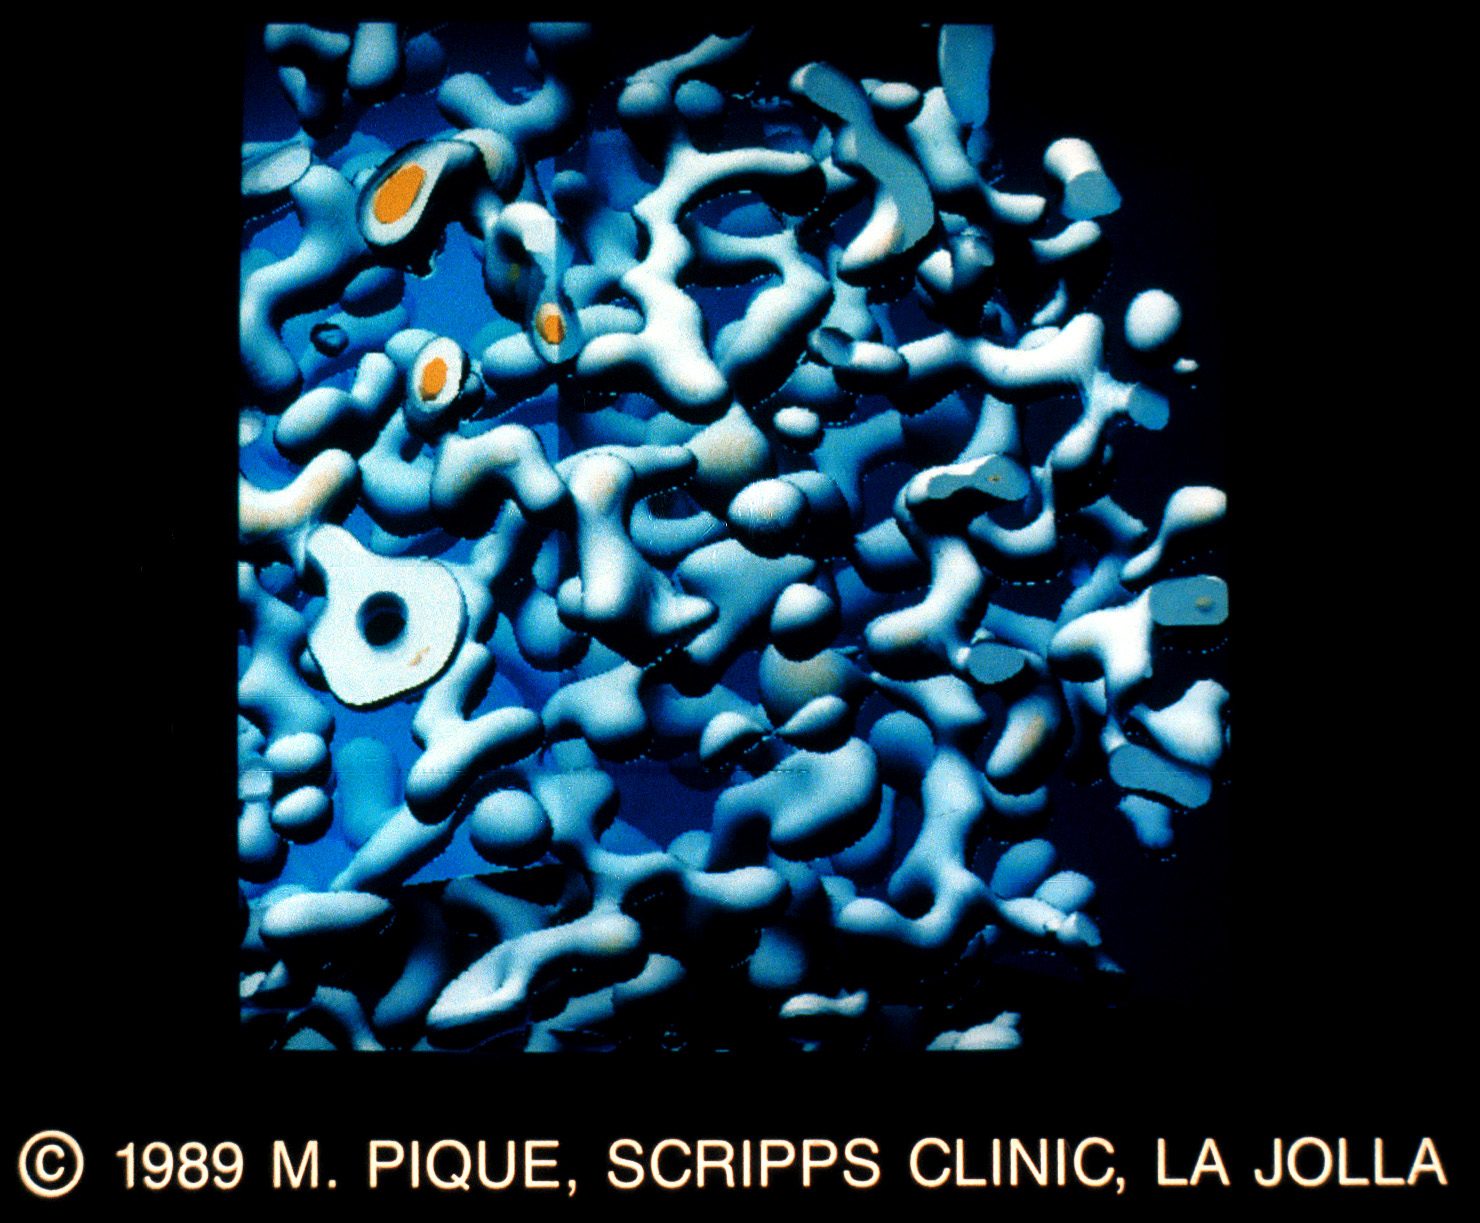
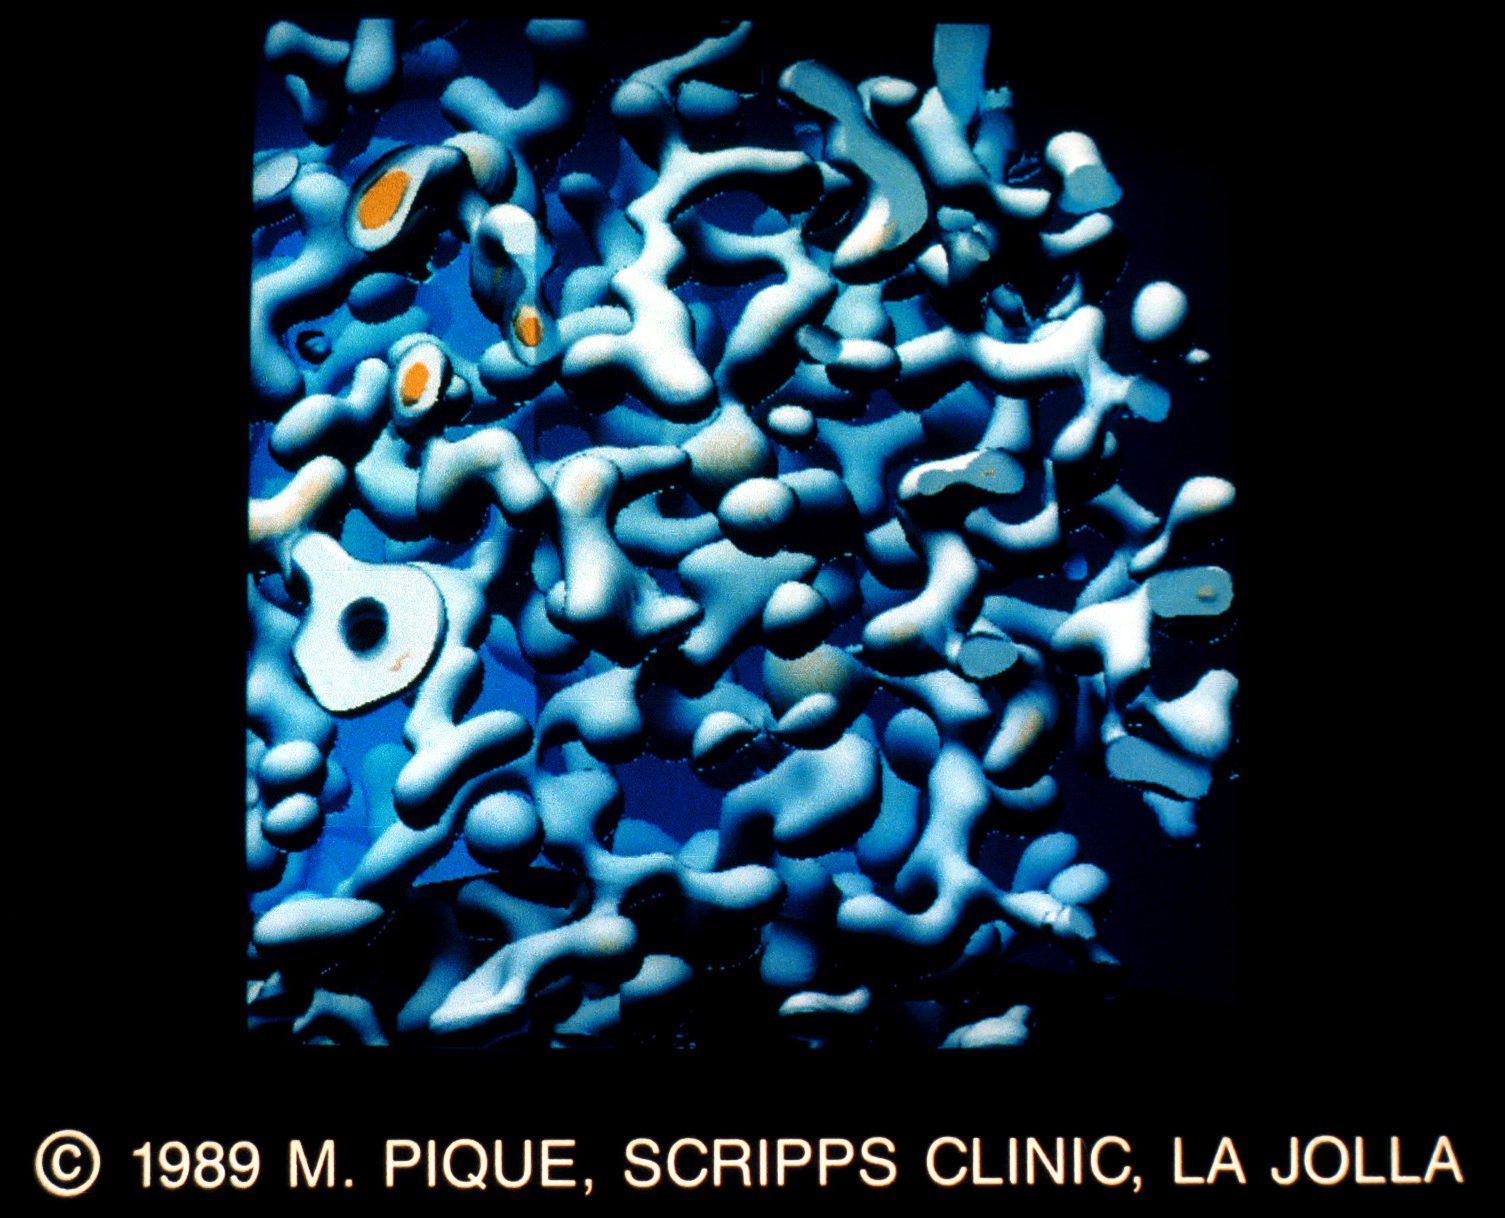
3&4. Active Site of Enzyme by Michael Pique and Duncan McRee. Close up view ofthe electron density of the SOD (superoxide dismutase) enzyme as determined by X-ray crystallography. In this 1.8 Angstrom resolution map, the copper (center sphere) and zinc (below and to right) atoms and connections to protein sidechains show clearly. Rendered in six minutes on Sun 3/160 TAAC1. The images were generated using Voxvu volume visualization tool by Sun Microsystems Application Accelerator Group. Contact: Michael Pique, Department of Molecular Biology MB5, Research Institute of Scripps Clinic, La Jolla, CA 92037, (619) 554-9775.
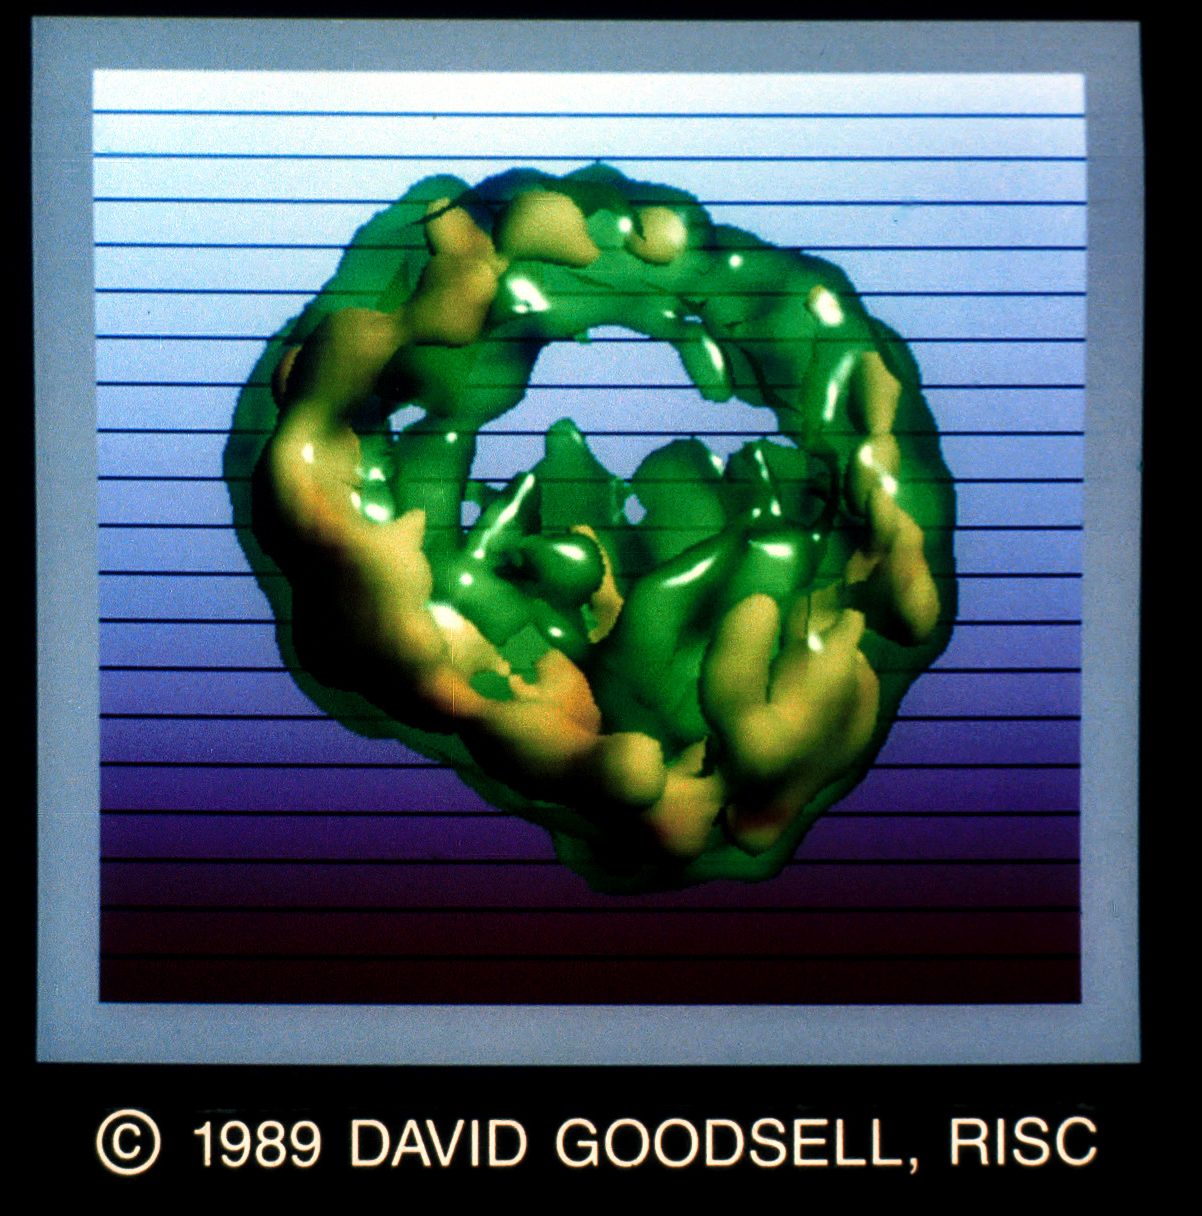
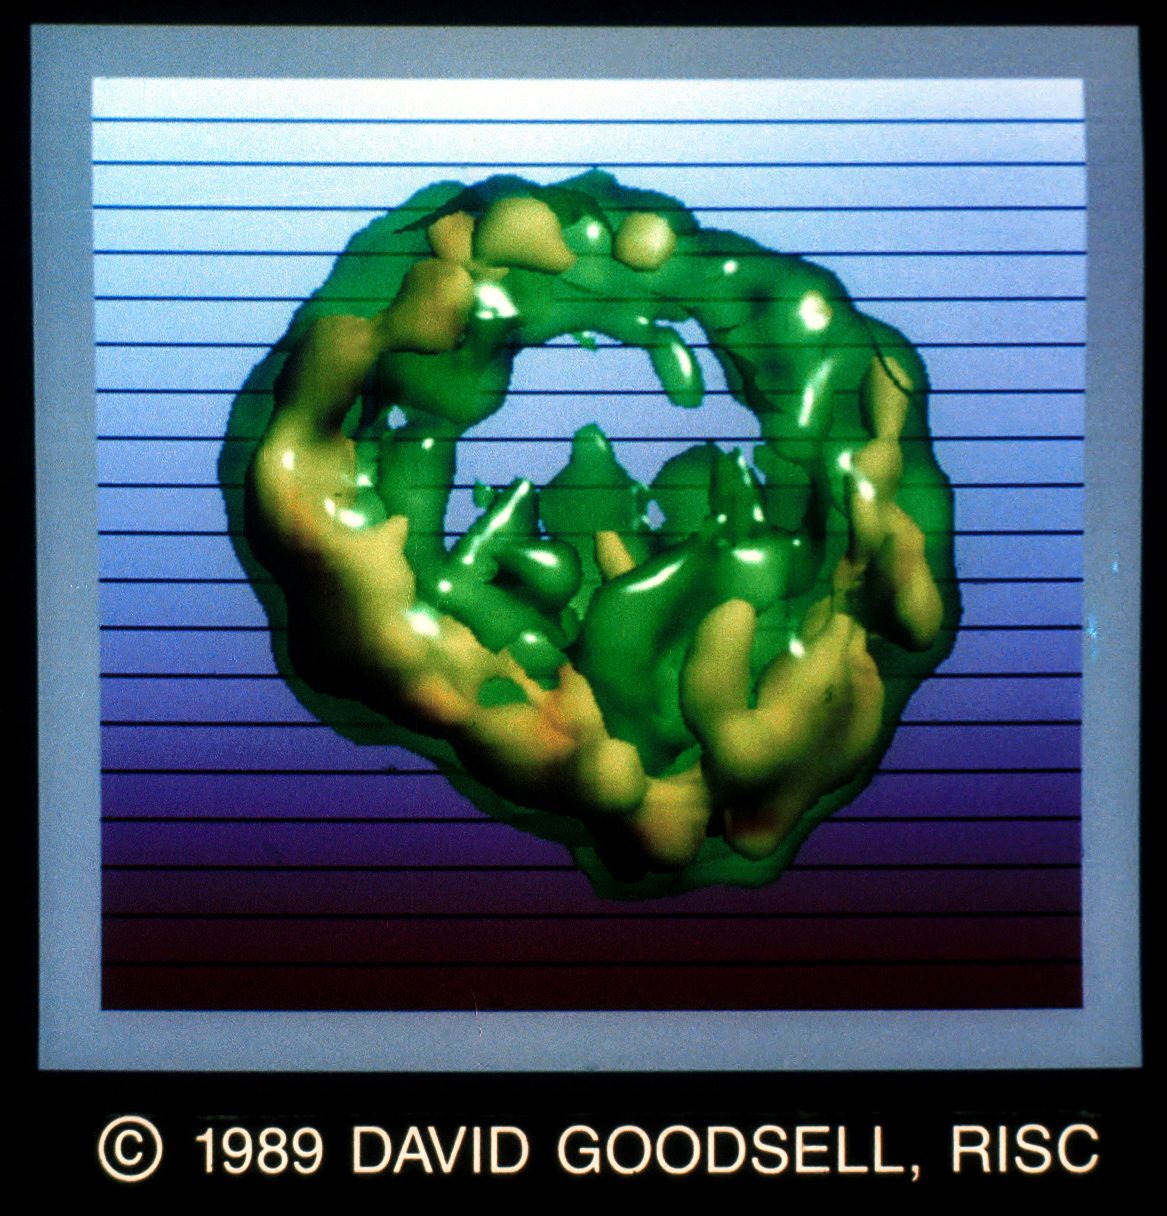
5&6. Ribonuclear Protein Particle by D. Goodsell and A. Olson. The RMSVOLUME software package, an in-house volume rendering program (J. Mol. Graphics 7, (1989), 41-47) was used on a Convex Cl, C2 and Sun with TAAC1 to make the image. Volume rendered image of a ribonuclear protein particle. The 3D density data is obtained from electron microscopy. Two transparent contours surround the bulk ofthe molecular mass. Data courtesy of U. Skoglund. Contact: David Goodsell, Department of Molecular Biology MB5, Research Institute of Scripps Clinic, La Jolla, CA 92037, (619) 554-4392.
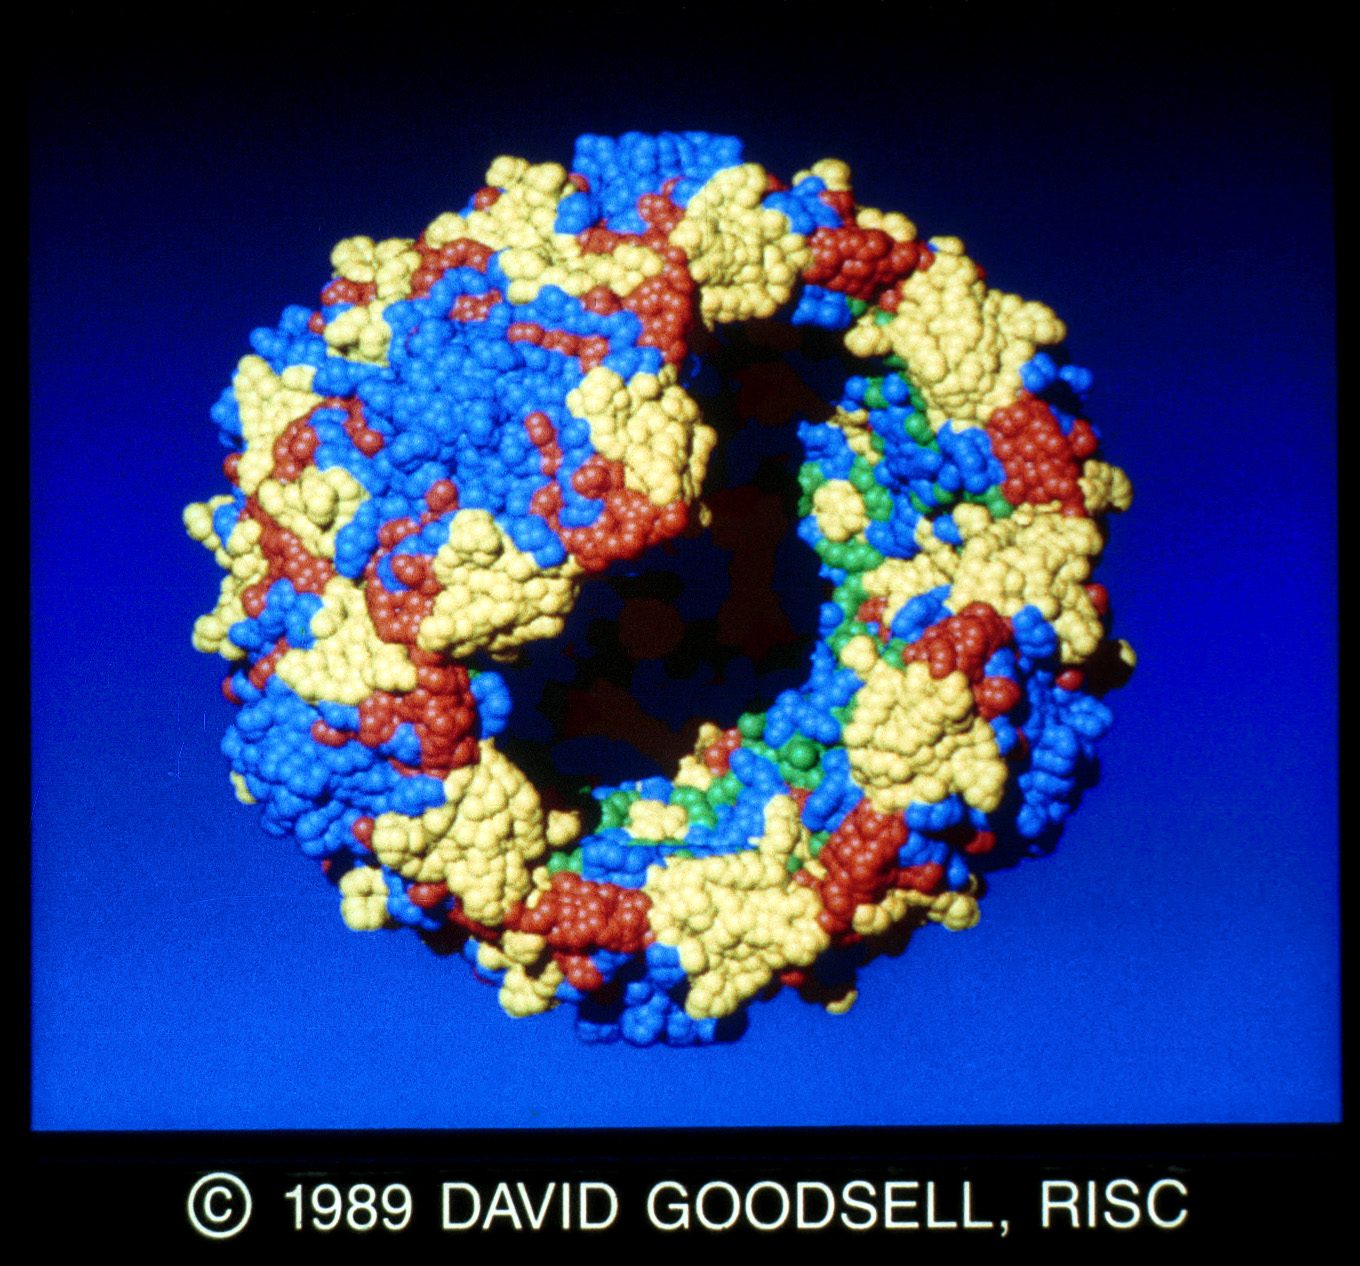
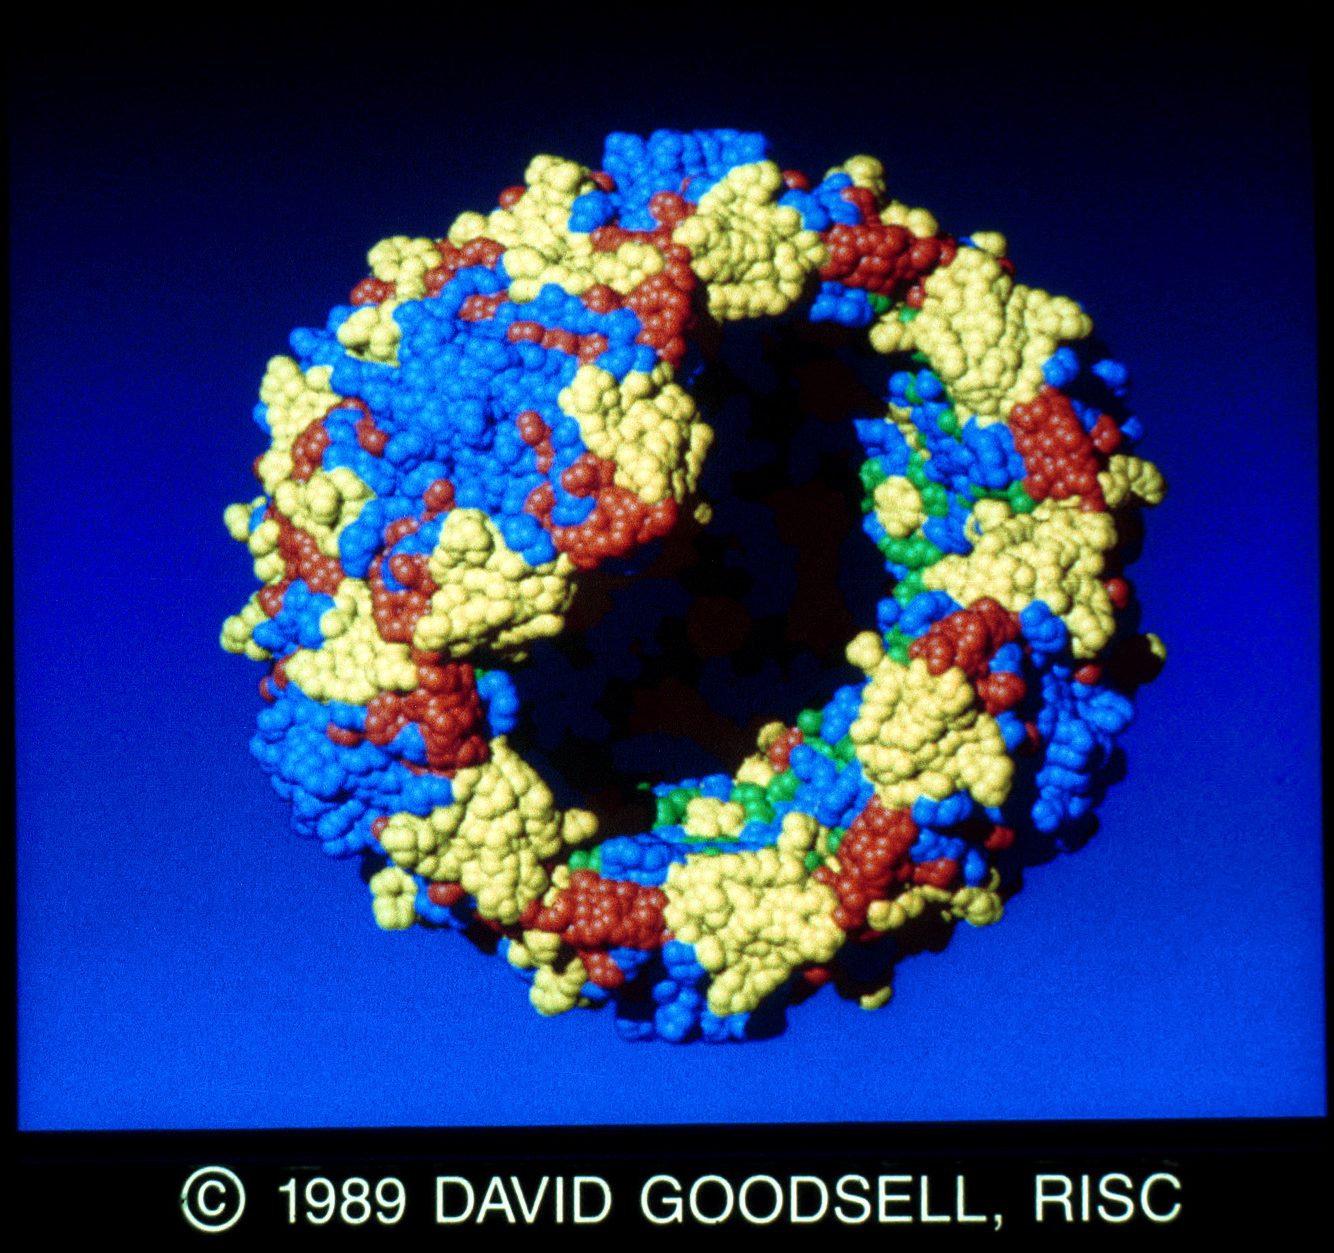
7&8. Polio Virus by D. Goodsell and A. Olson. The RMSVOLUME software package, an in-house volume rendering program (J. Mol. Graphics 7, (1989), 41-47) was used on a Convex C1, C2 and Sun with TAACI to make the image. The polio viral capsid is shown as a collection of spheres centered on alpha carbon positions. Two pentamers are removed to show the interior. Coordinates courtesy of J. Hogle. Contact: David Goodsell, Department ofMolecular Biology MB5, Research Institute of Scripps Clinic, La Jolla, CA 92037, (619) 554-4392.
9&10. Polio Virus by D. Goodsell and A. Olson. The RMSVOLUME software package, an in-house volume rendering program (J. Mol. Graphics 7, (1989), 41-47) was used on a Convex Cl, C2 and Sun with TAAC1 to make the image. Volume rendering is used to study the electrostatics around a polio virus pentamer. Positive potential is shown in blue, negative in red. Coordinates courtesy of J. Hogle. Contact: David Goodsell, Department of Molecular Biology MB5, Research Institute of Scripps Clinic, La Jolla, CA 92037, (619) 554-4392.
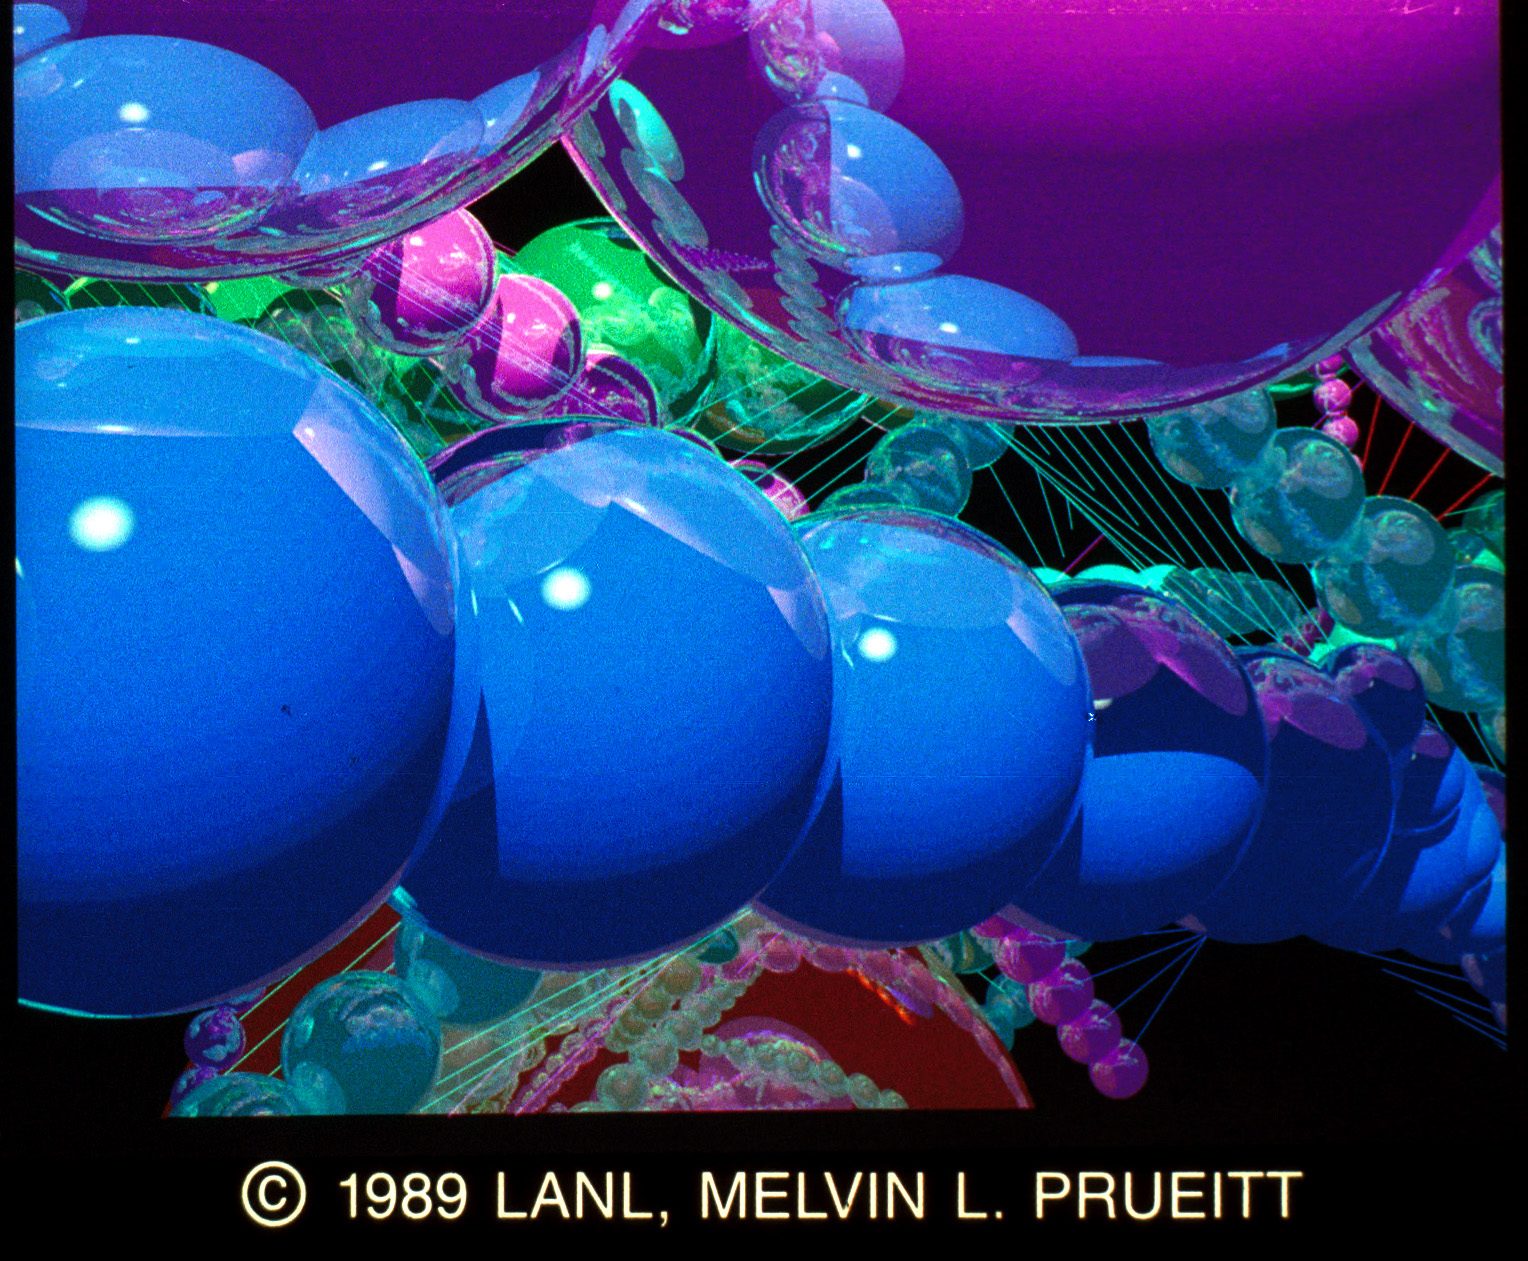
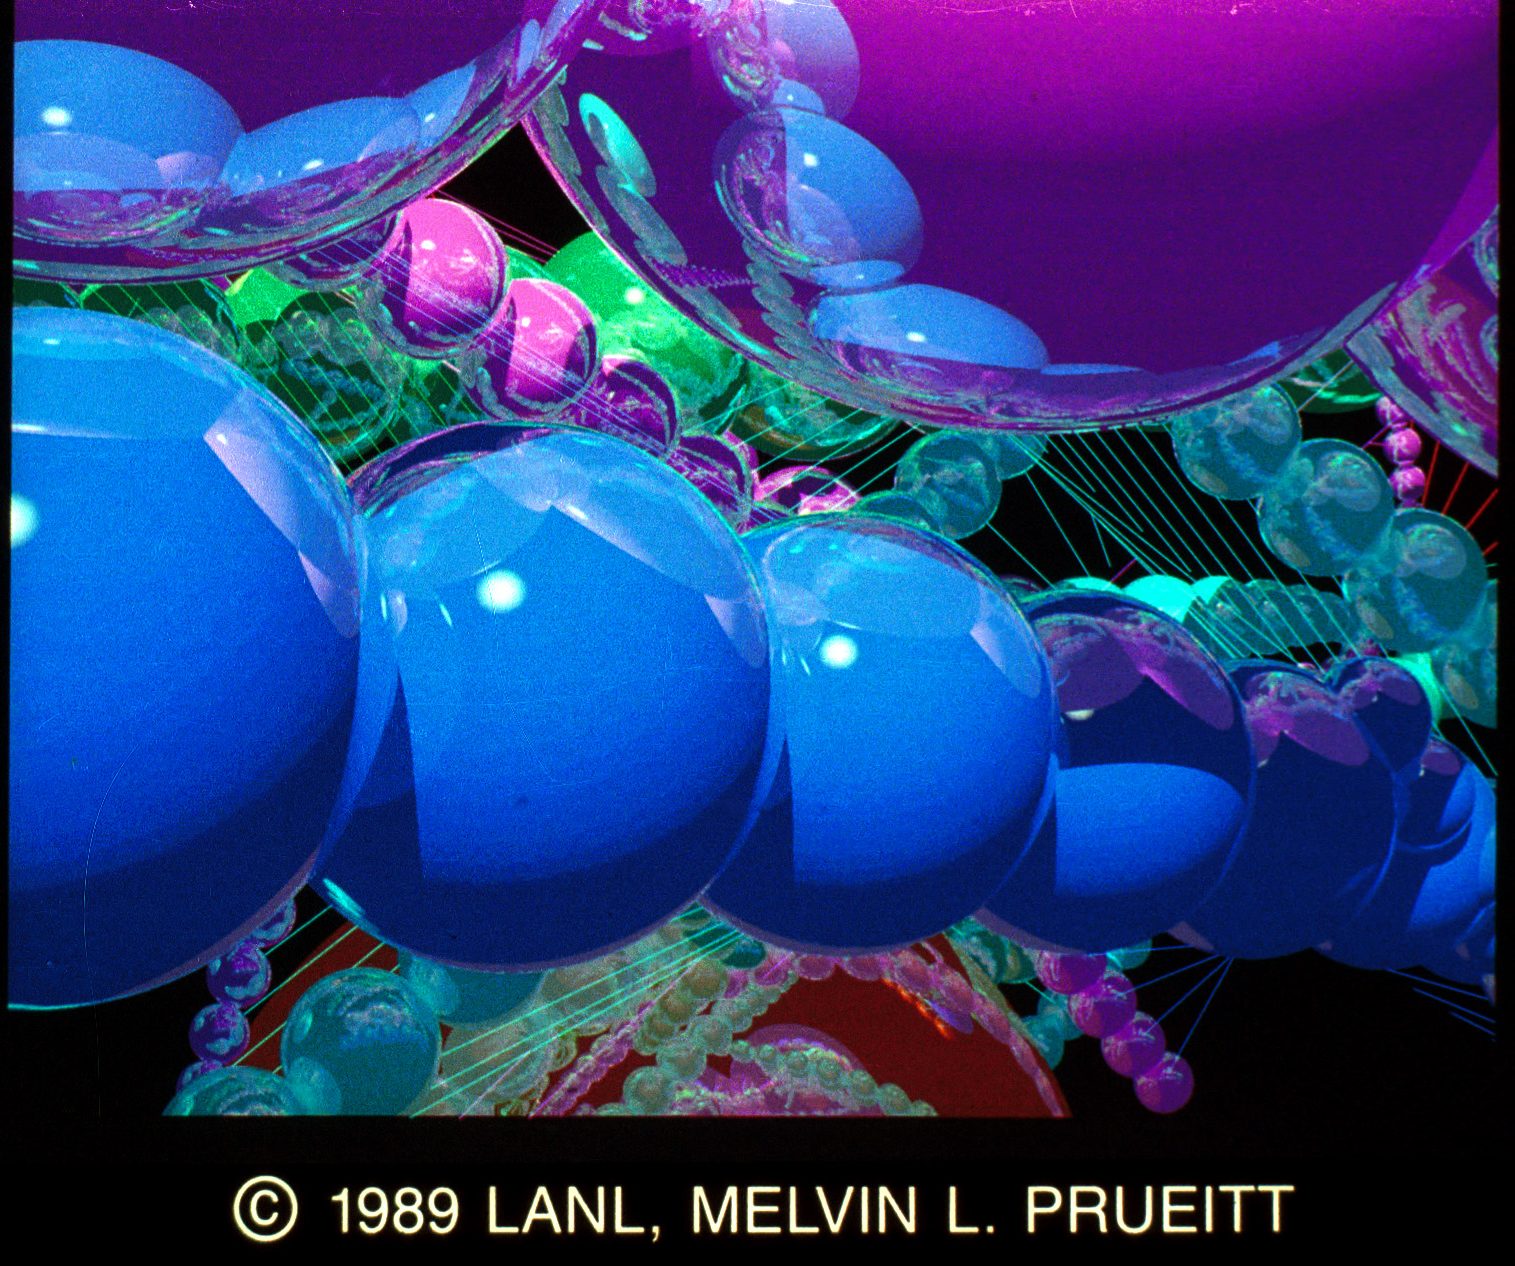
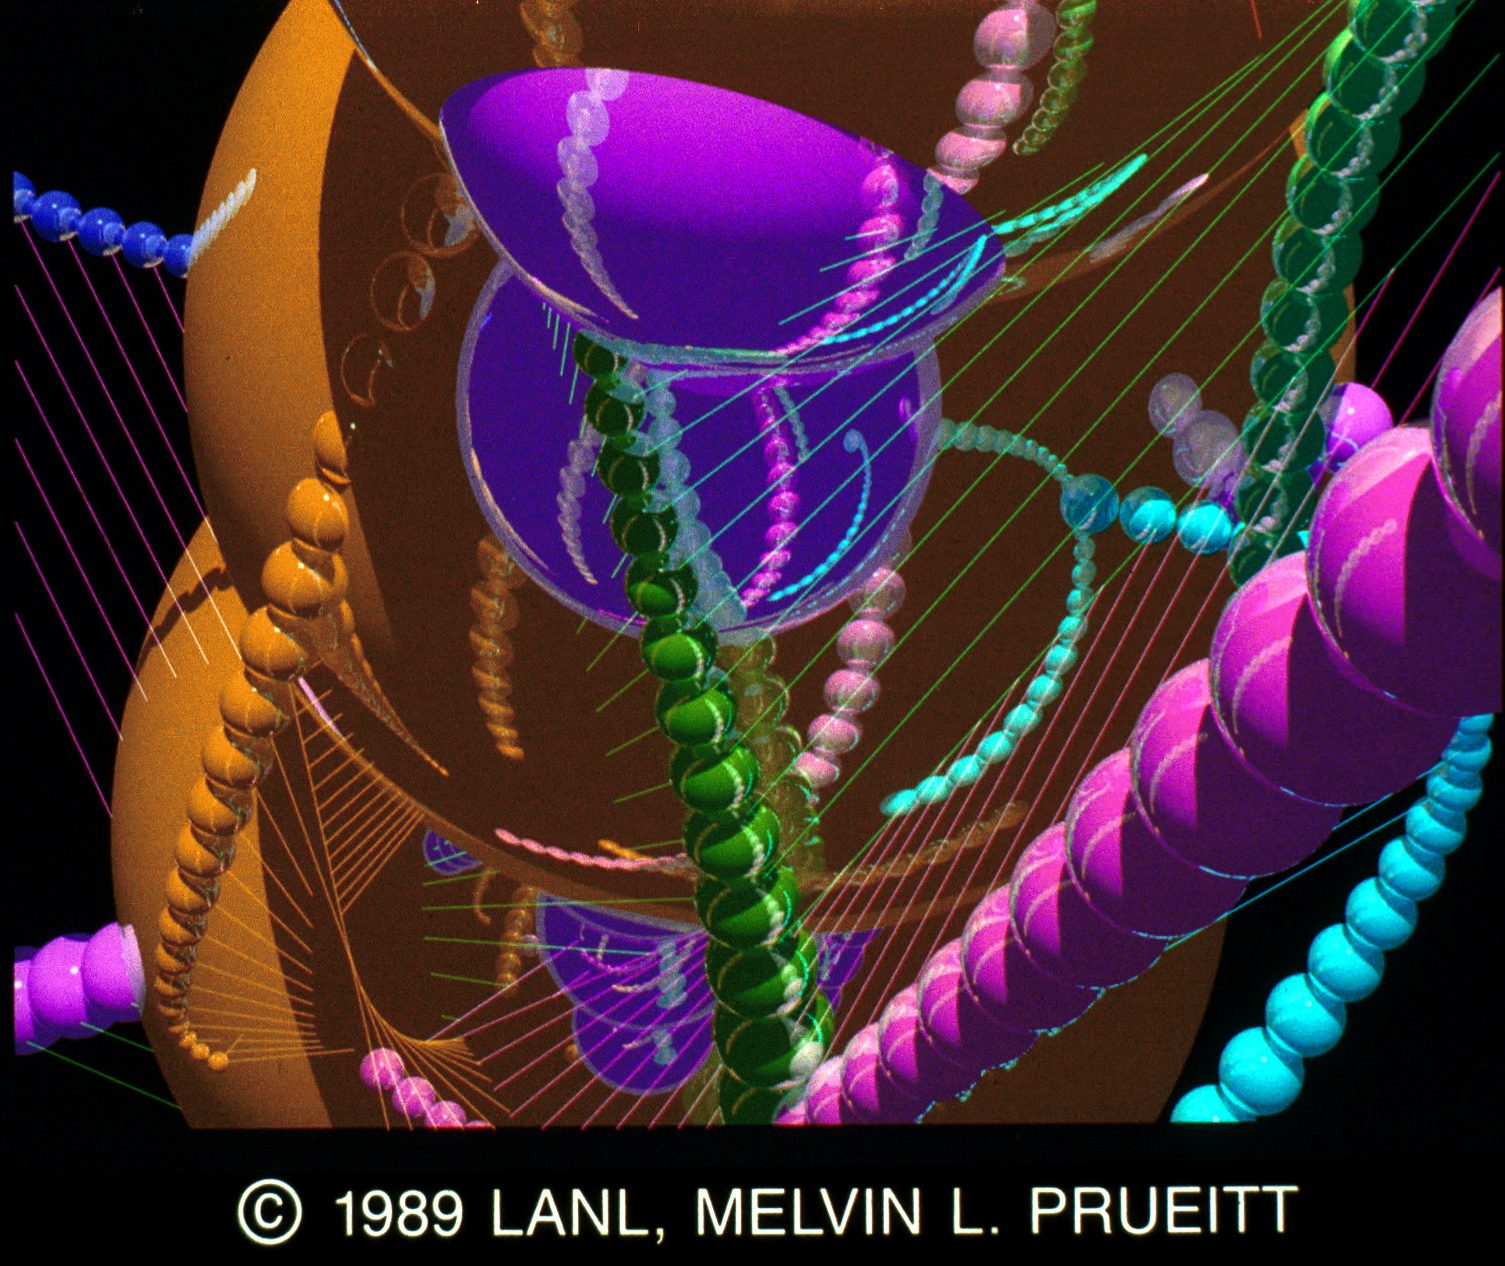
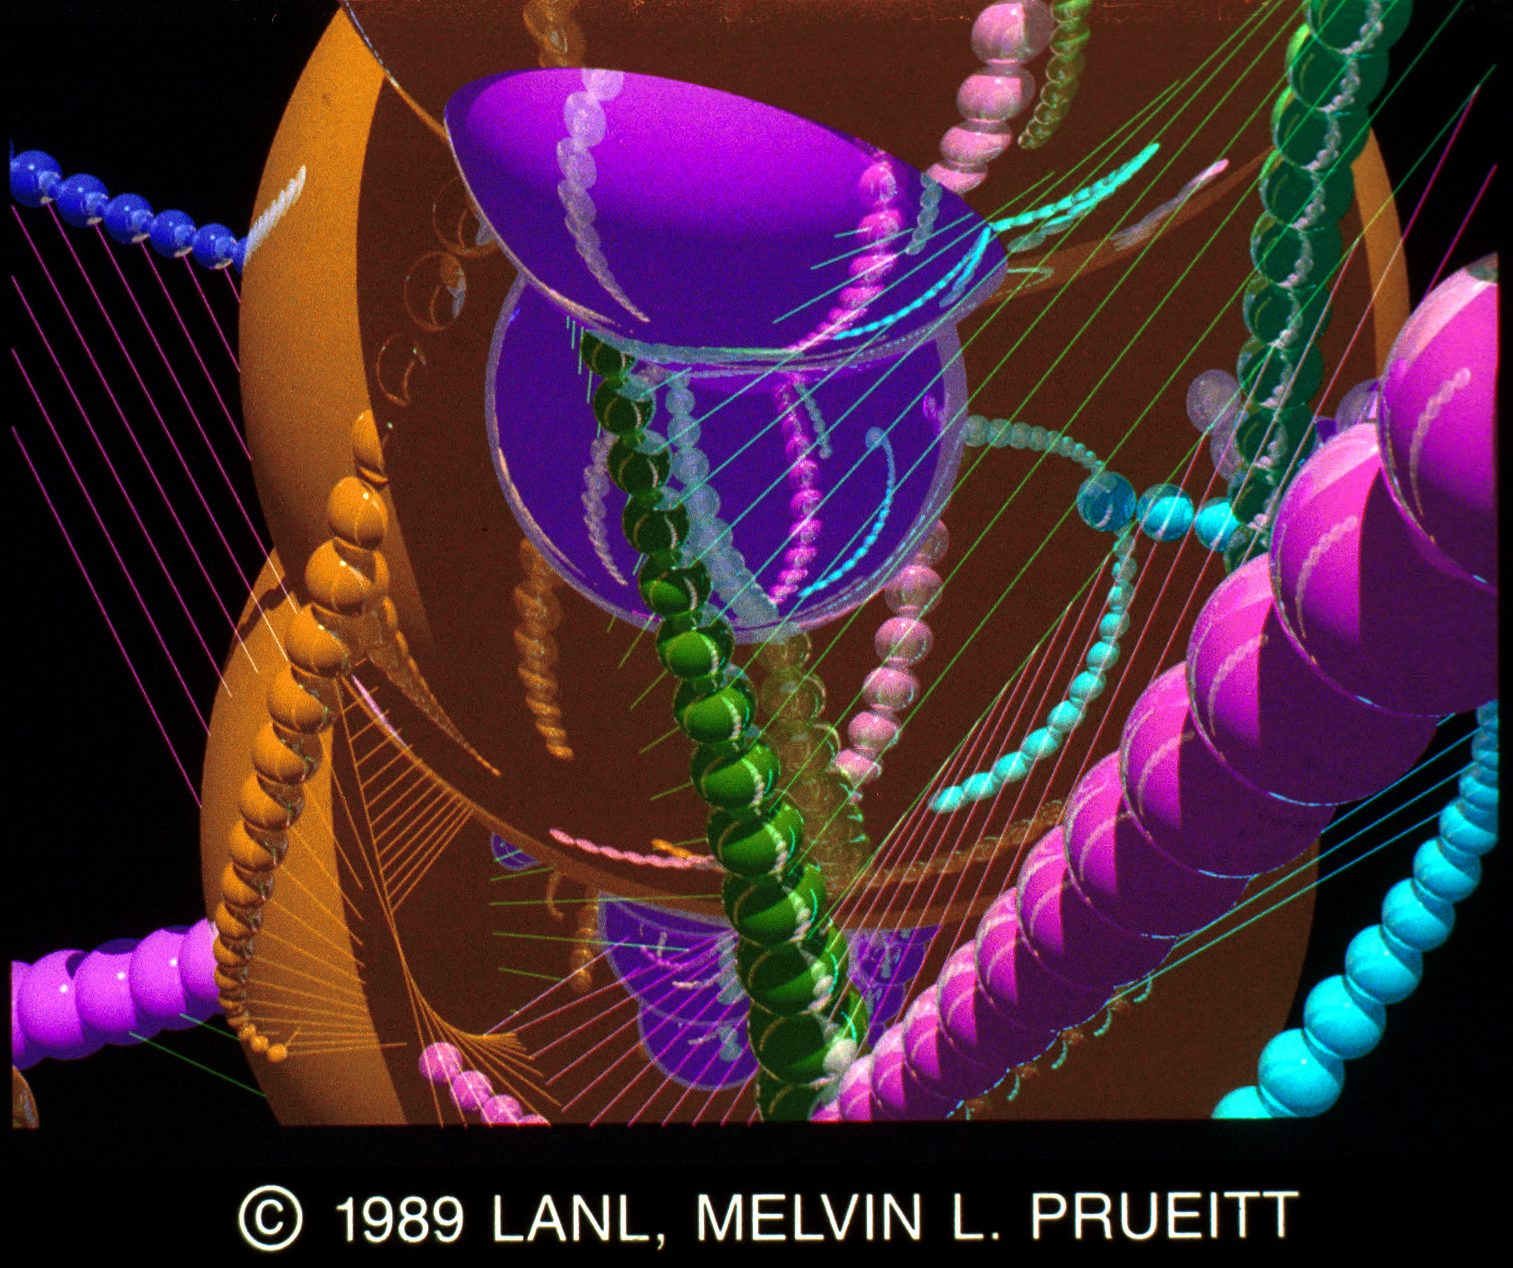
11&12. Yellow Space by Melvin L. Prueitt. The images were created using the author’s own software (KALS 111) running on the Cray computer and imaged on the Dicomed film recorder. Contact: Melvin L. Prueitt, Los Alamos National Laboratory, P.O. Box 1663, MS B-272, Los Alamos, NM 87545, (505) 667-4452.
13&14. Blue Space by Melvin L. Prueitt. The images were created using the author’s own software (KALS 111) running on the Cray computer and imaged on the Dicomed film recorder. Contact: Melvin L. Prueitt, Los Alamos National Laboratory, P.O. Box 1663, MS B-272, Los Alamos, NM 87545, (505) 667-4452.
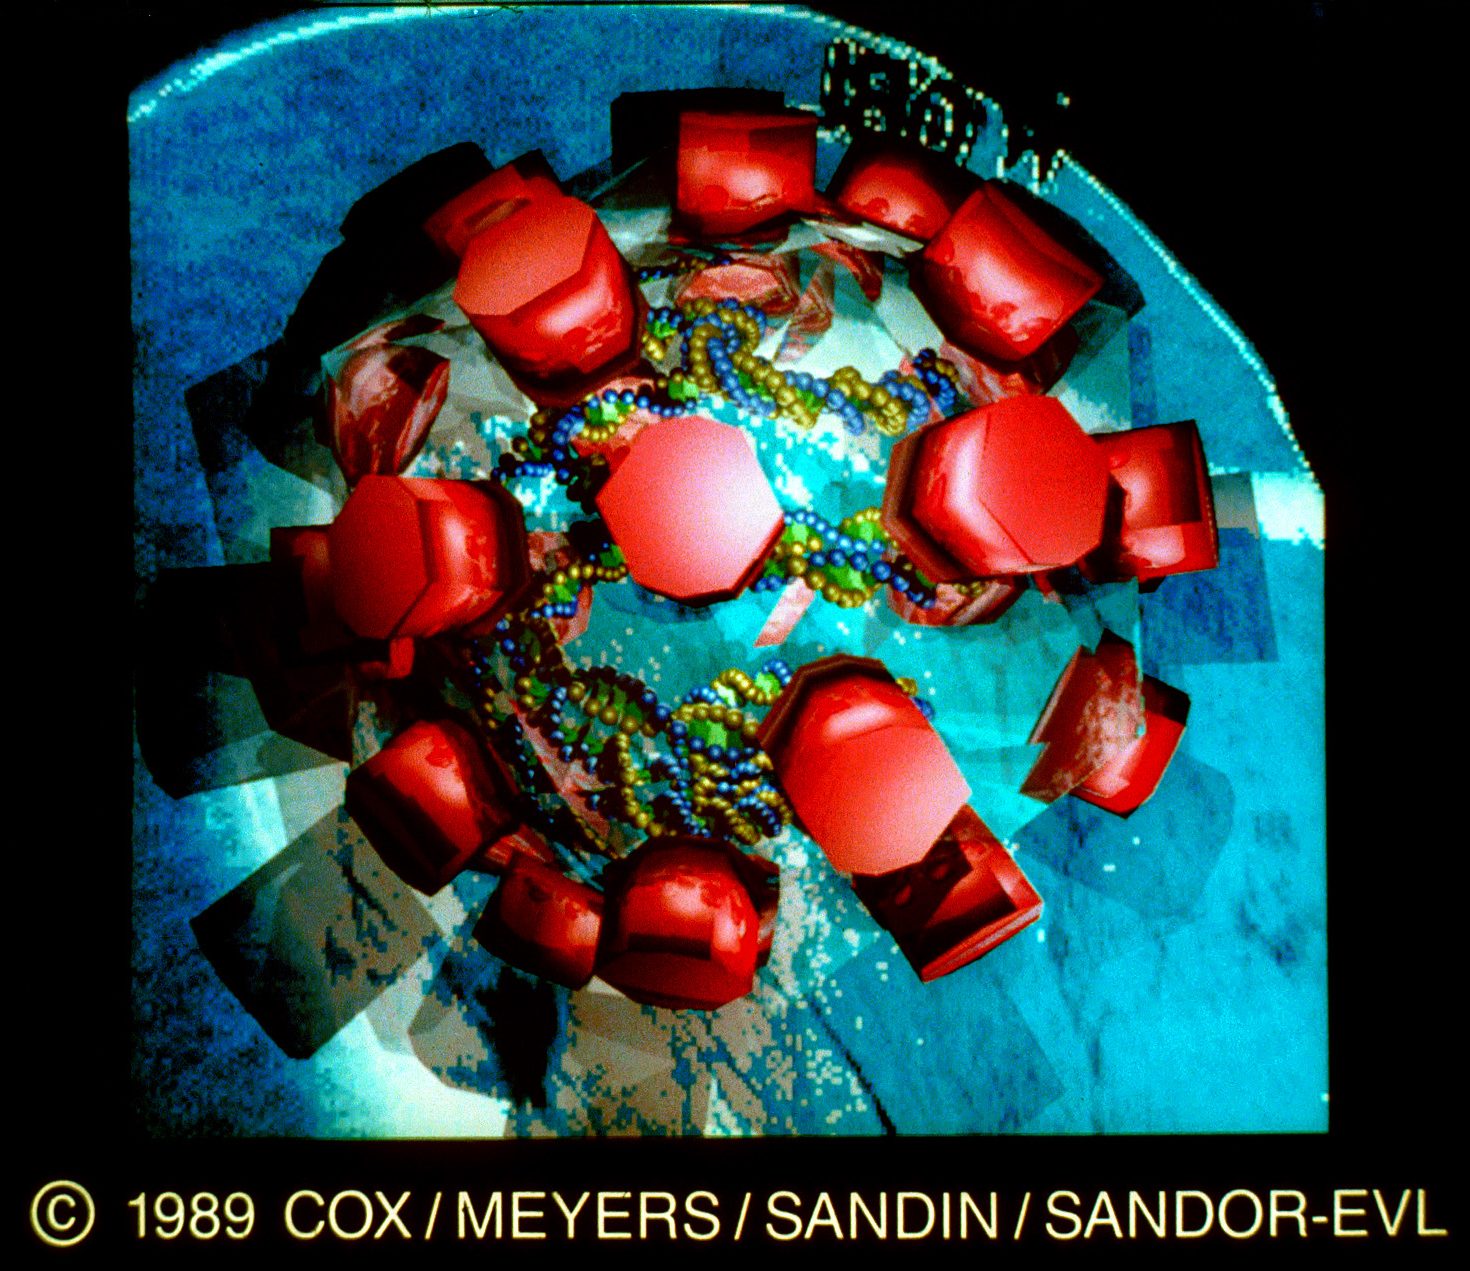
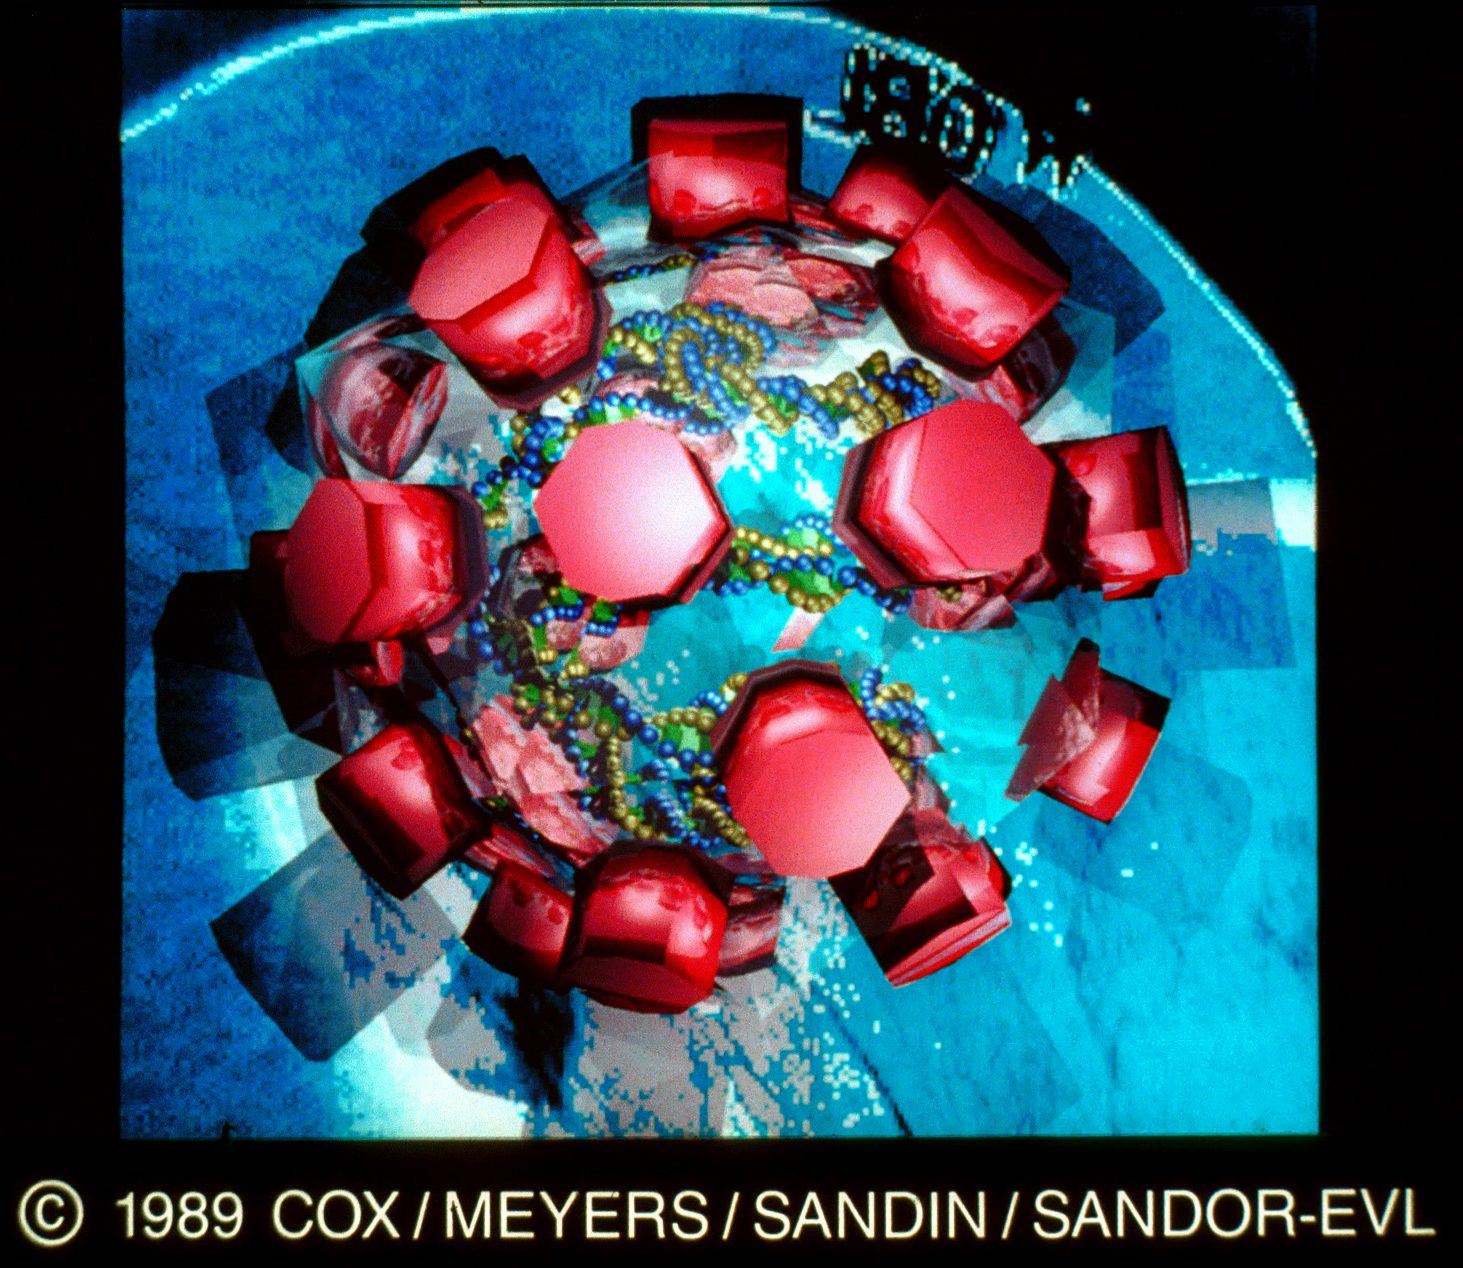
15&16. Papilloma Virus by Donna Cox, Stephen Meyers, Dan Sandin and Ellen Sandor. This visualization was created from visual data from electron microscope. Red capsids are aligned to a refracted, transparent icoahedral structure that is basic to many virus. The number of red capsomers were reduced to display the circular dsDNA. This virus is thought to be one of the major causes of cancer. Calculations were performed in the Electronic Visualization Laboratory, University of Illinois at Chicago, on the AT&T Pixel Machine. Initial collaborators were Stephen Meyers and Donna Cox. The resulting image was printed as a three-dimensional phscologram (a barrier strip method to create 3-D holographic-type transparencies). Dan Sandin and Ellen Sandor are the inventors of the phscologram process. Contact: Donna J. Cox, National Center for Supercomputing Applications, 605 East Springfield, Champaign, IL 61820, (217) 224-2005.
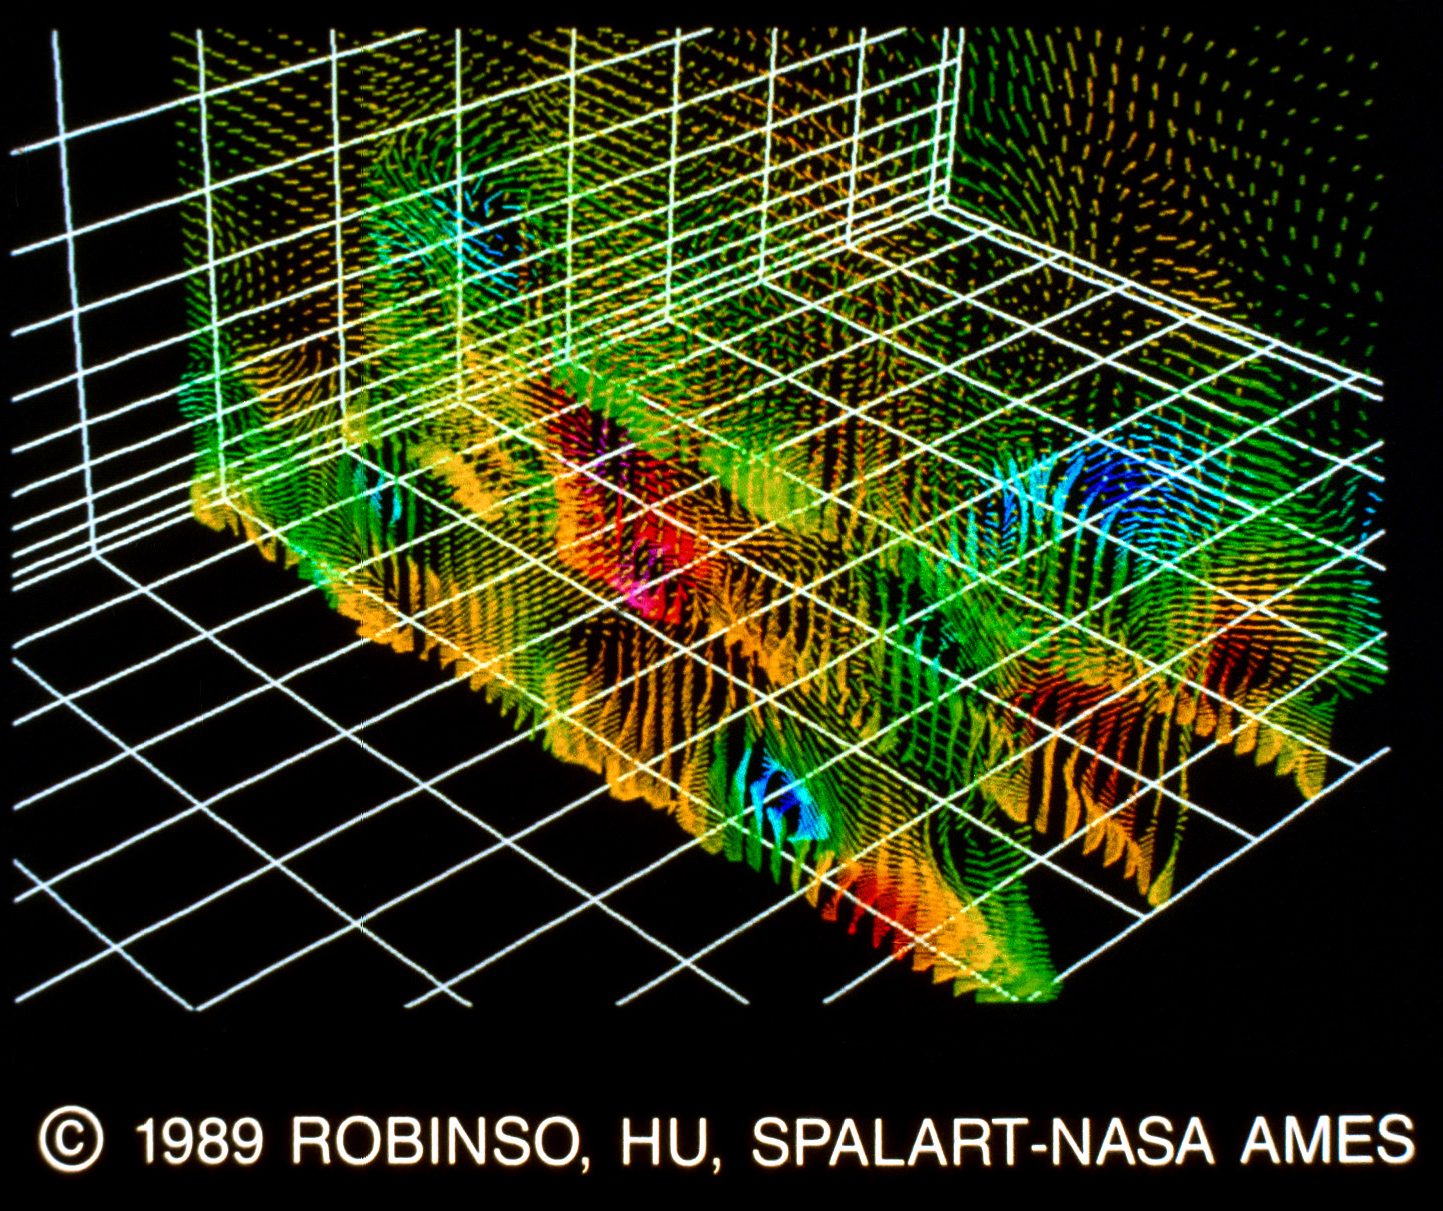
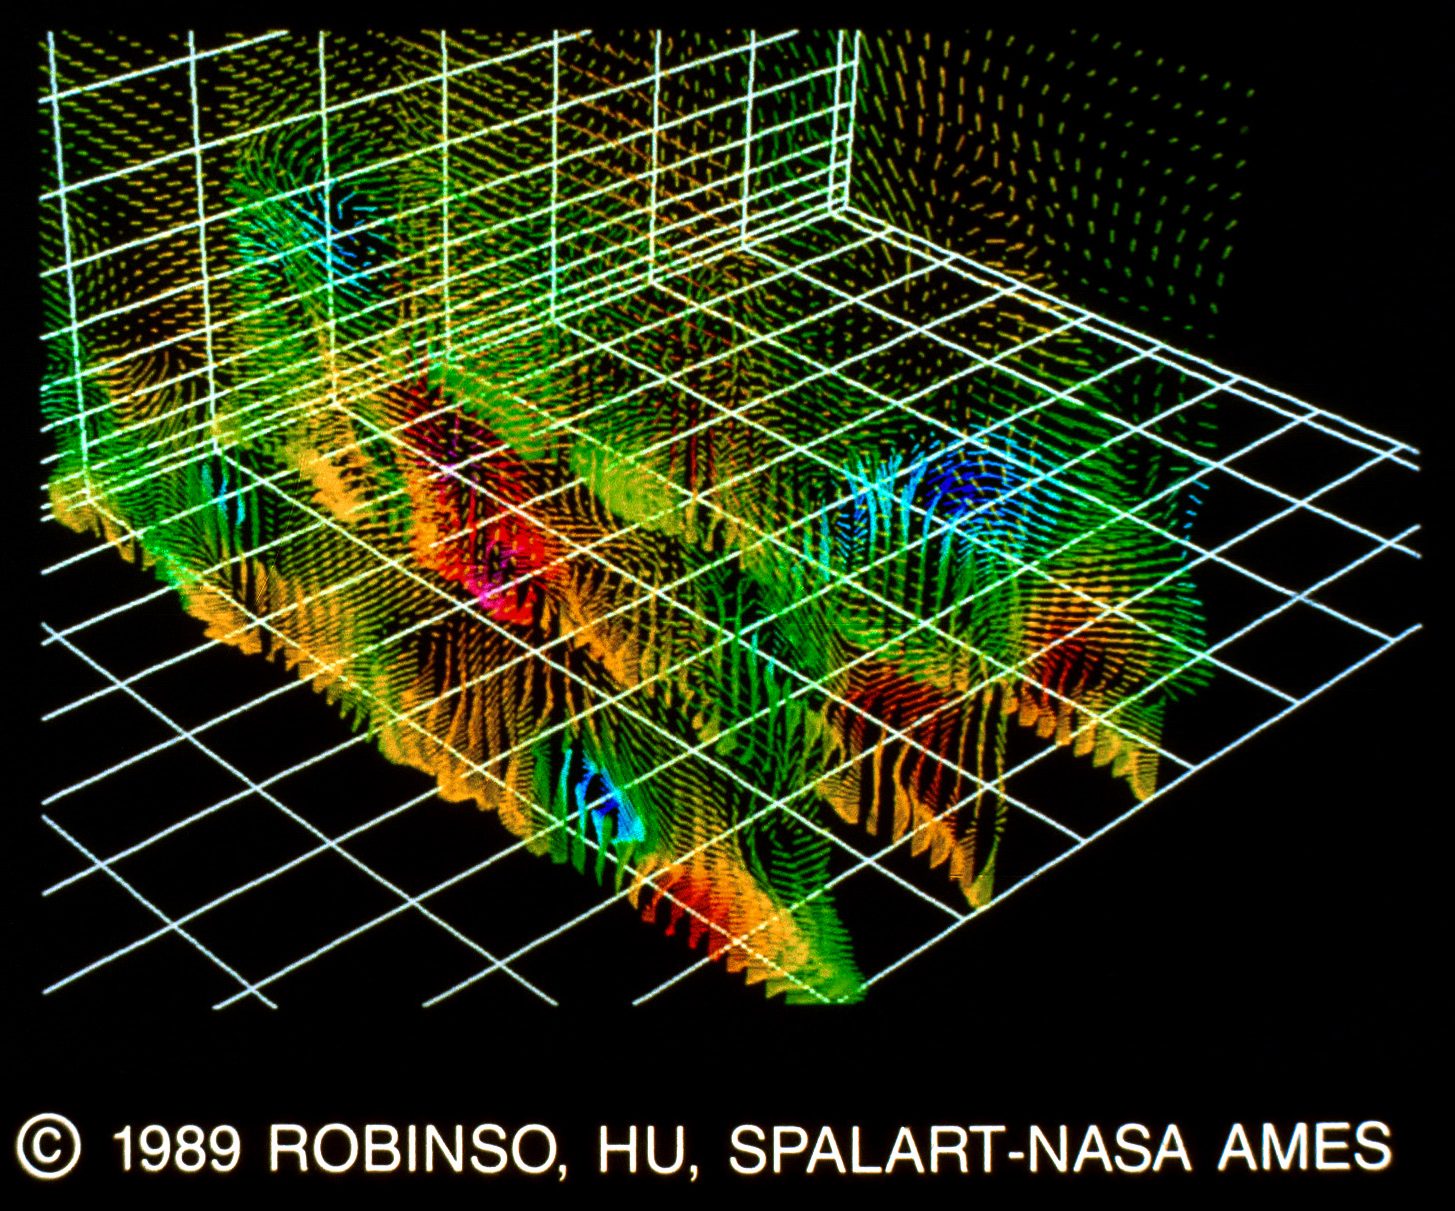
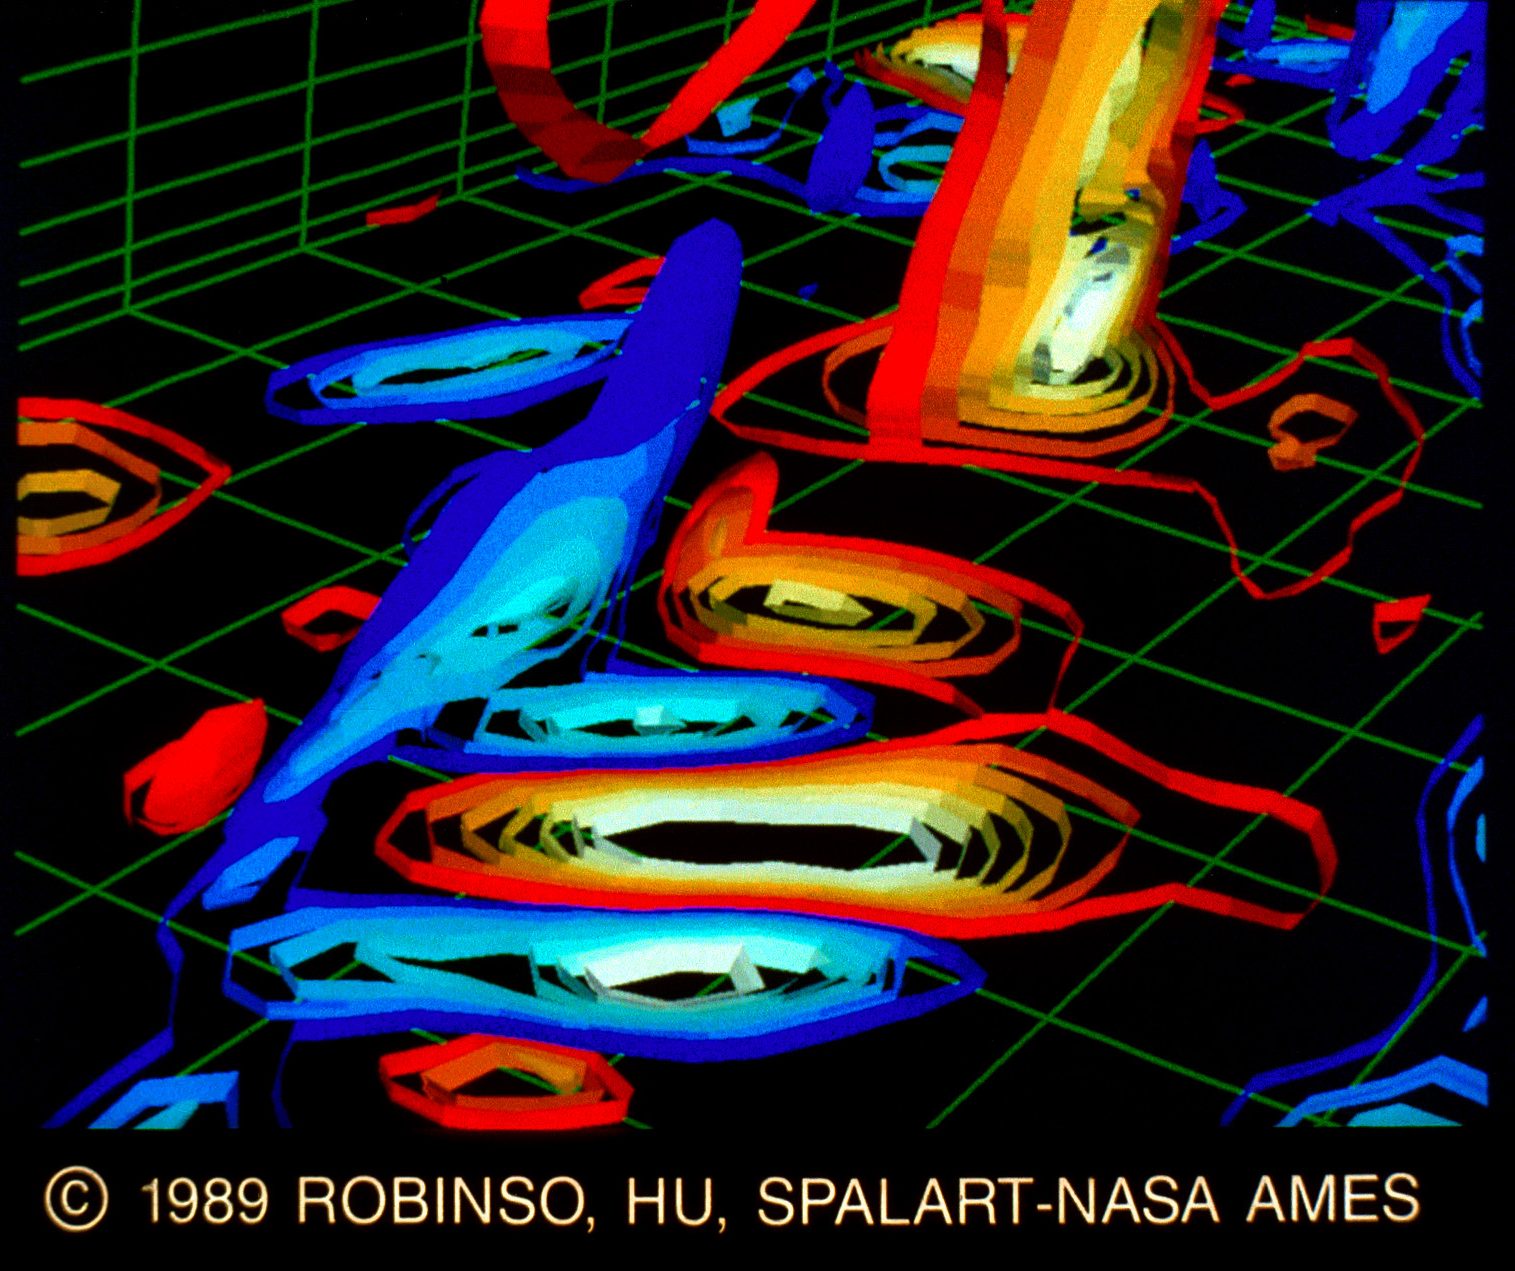
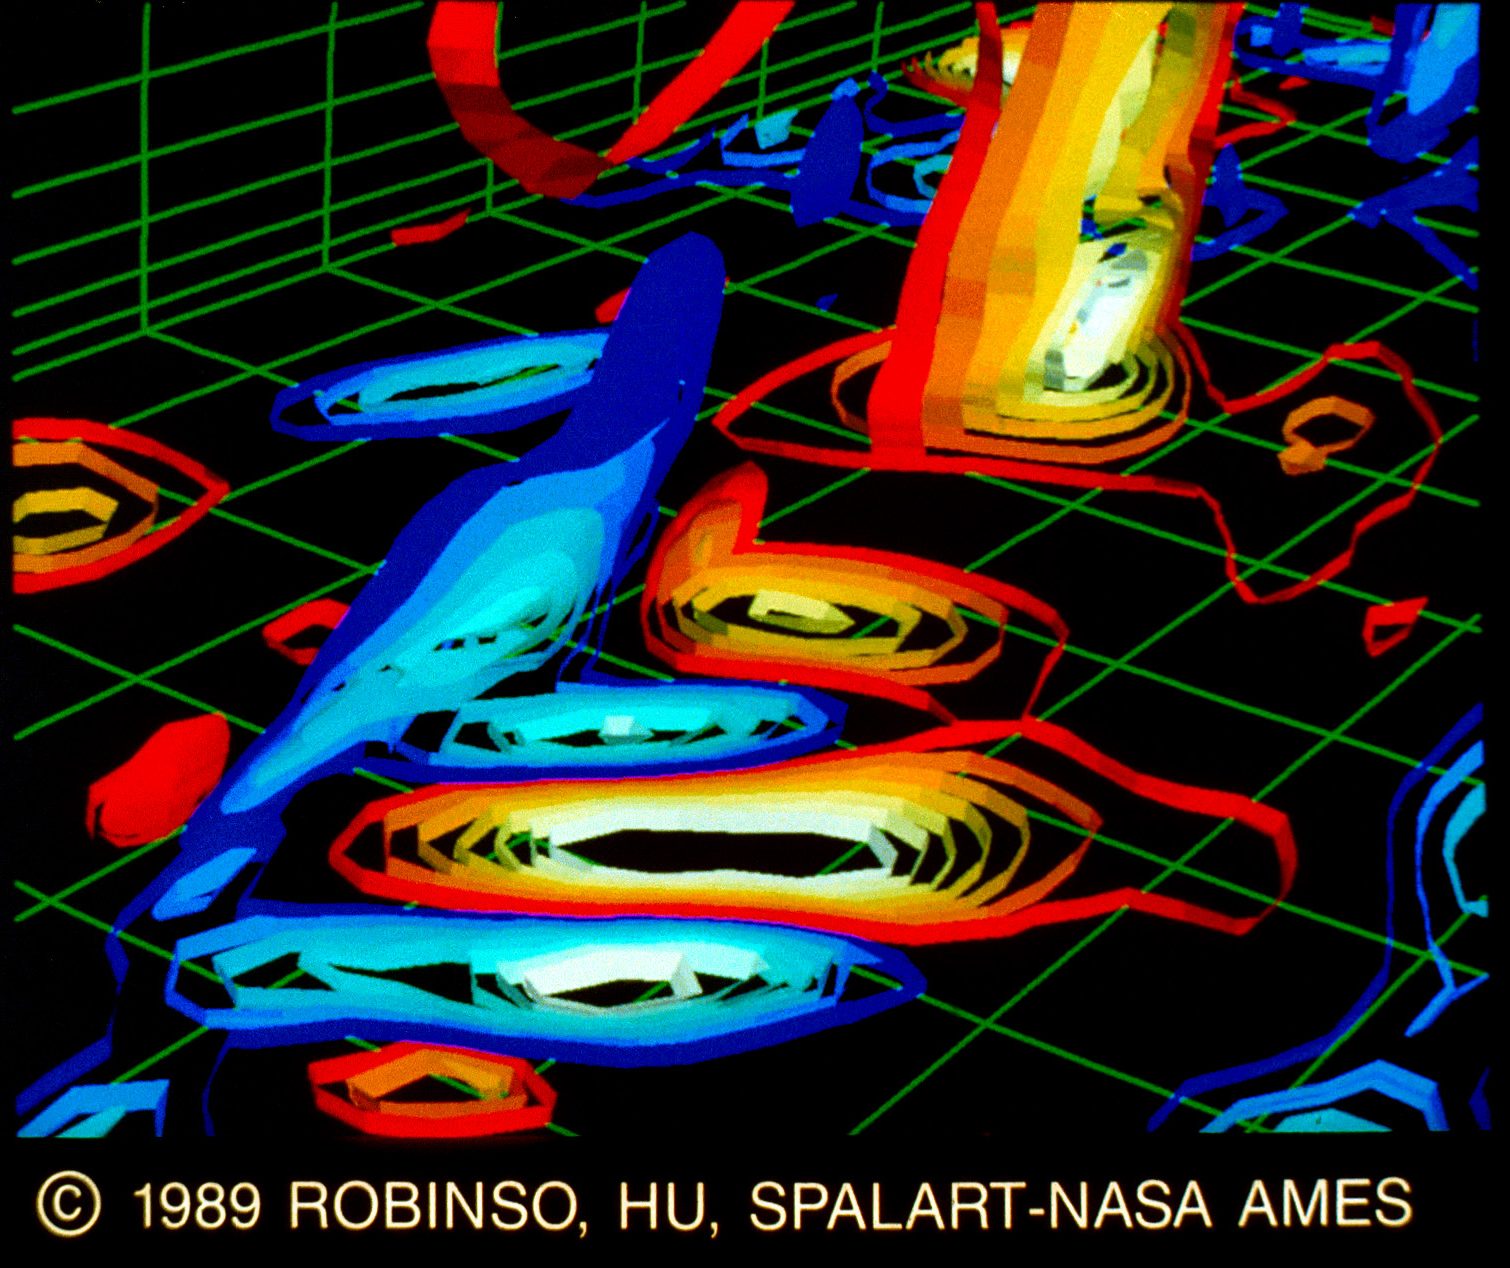
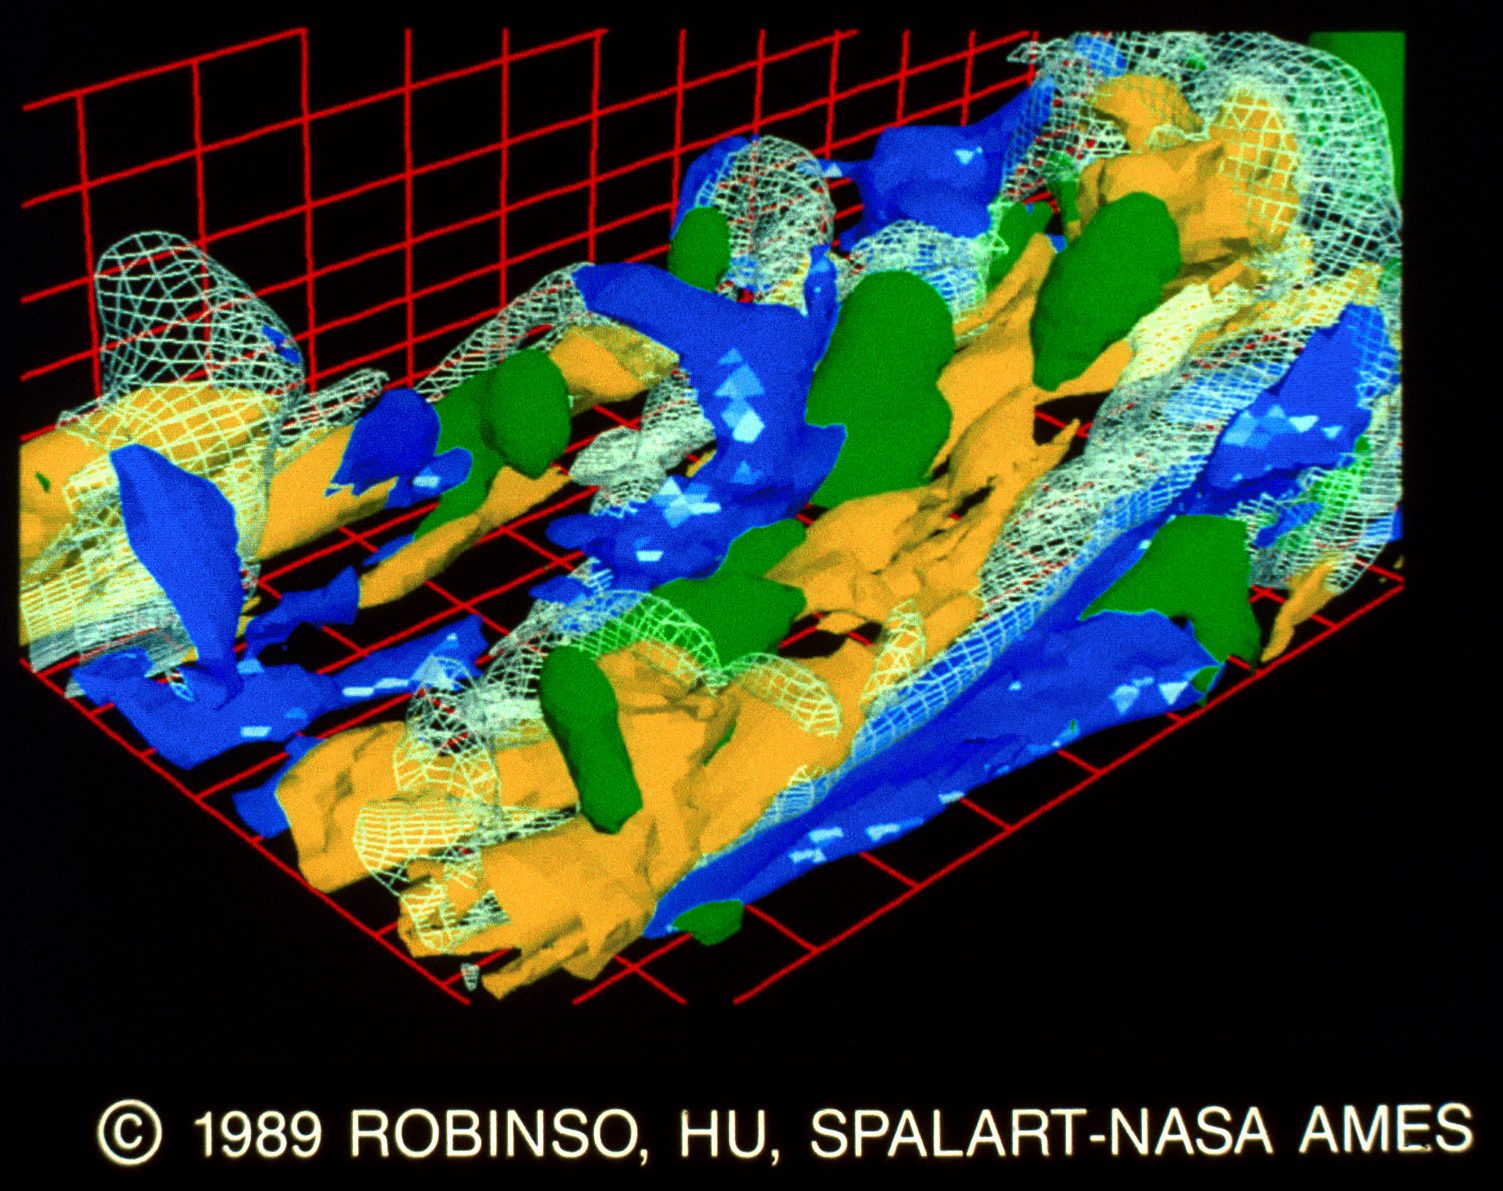
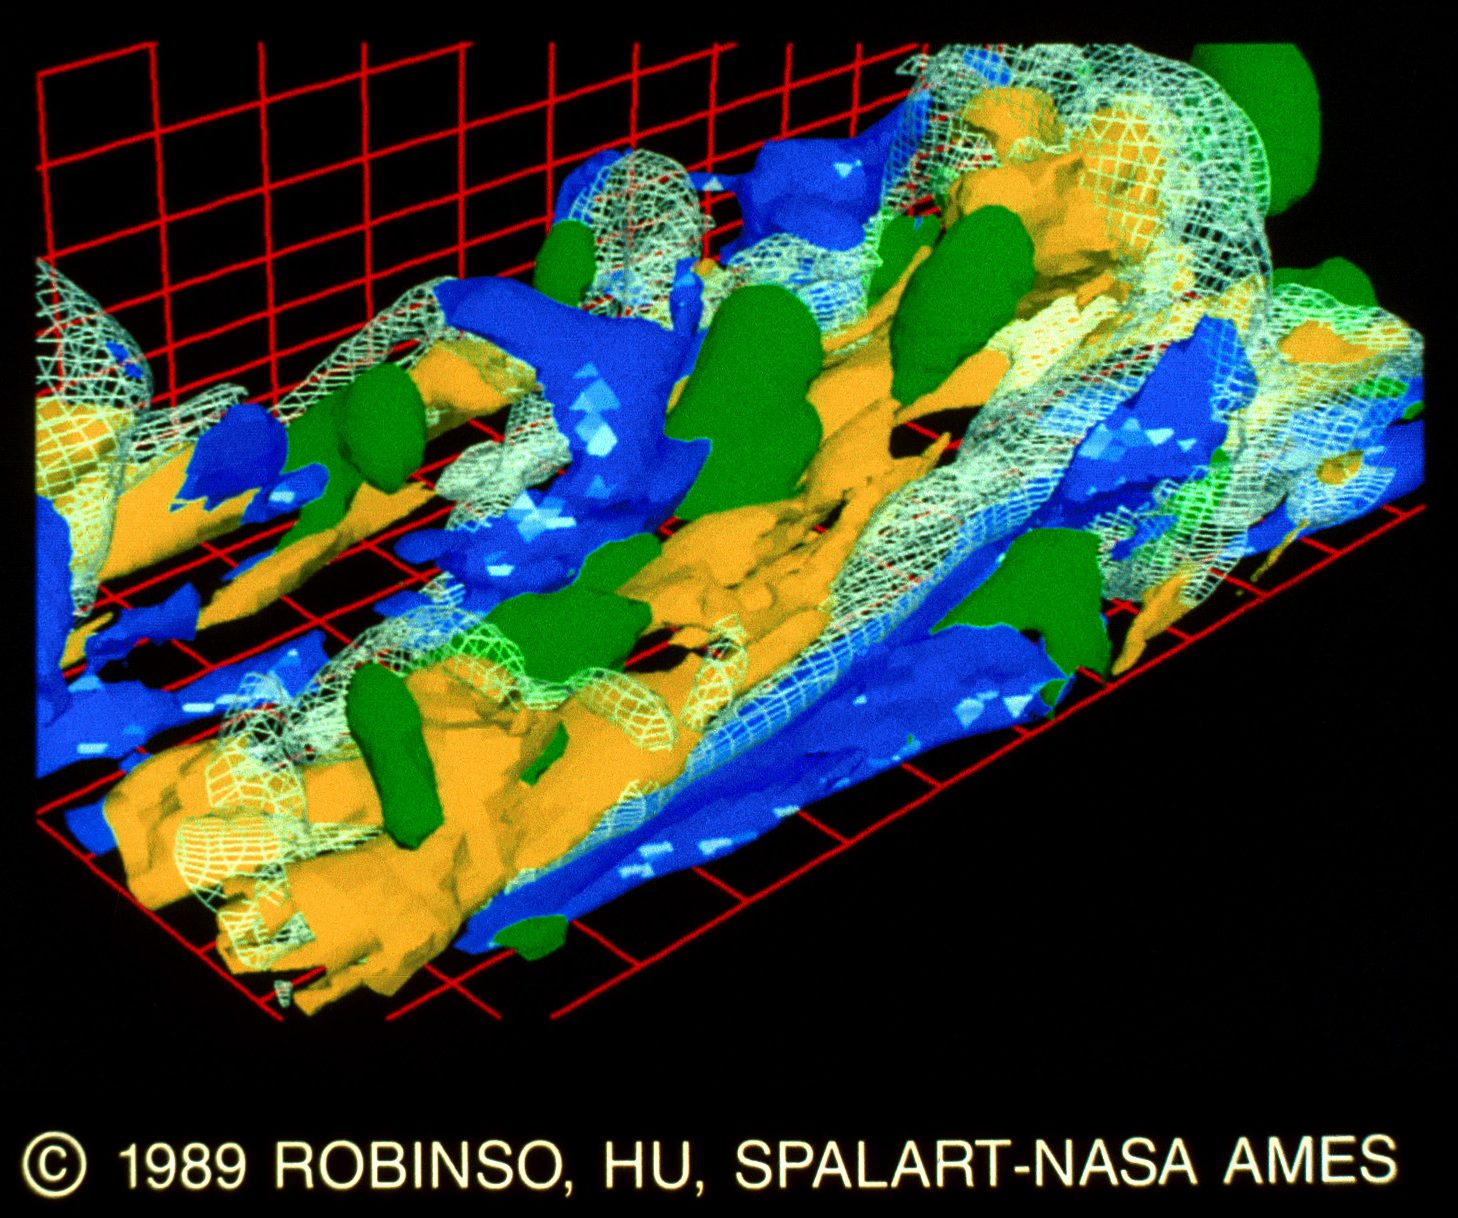
17&18. Numerical Turbulence #9 by S. K. Robinson, K. C. Hu and P. R. Spalart. The data is from a direct Navier-Stokes numerical simulation of a turbulent boundary layer on a flat surface. The analysis was by S. K. Robinson, the stereo software by K. C. Hu and the simulation was performed by P. R. Spalart. Hardware used included a Silicon Graphics Iris workstation and Dunn camera. Contact: Stephen K. Robinson, MS 229-1, NASA Ames Research Center, Moffett Field, CA 94035, (4 I 5) 694-6220.
19&20. Numerical Turbulence #5 by S. K. Robinson, K. C. Hu and P. R. Spalart. The data is from a direct Navier-Stokes numerical simulation of a turbulent boundary layer on a flat surface. The analysis was by S. K. Robinson, the stereo software by K. C. Hu and the simulation was performed by P. R. Spalart. Hardware used included a Silicon Graphics Iris workstation and Dunn camera. Contact: Stephen K. Robinson, MS 229-1, NASA Ames Research Center, Moffett Field, CA 94035, (415) 694-6220.
21&22. Numerical Turbulence #7 by S. K. Robinson, K. C. Hu and P. R. Spalart. The data is from a direct Navier-Stokes numerical simulation of a turbulent boundary layer on a flat surface. The analysis was by S. K. Robinson, the stereo software by K. C. Hu and the simulation was performed by P. R. Spalart. Hardware used included a Silicon Graphics Iris workstation and Dunn camera. Contact: Stephen K. Robinson, MS 229-1, NASA Ames Research Center, Moffett Field, CA 94035, (415) 694-6220.
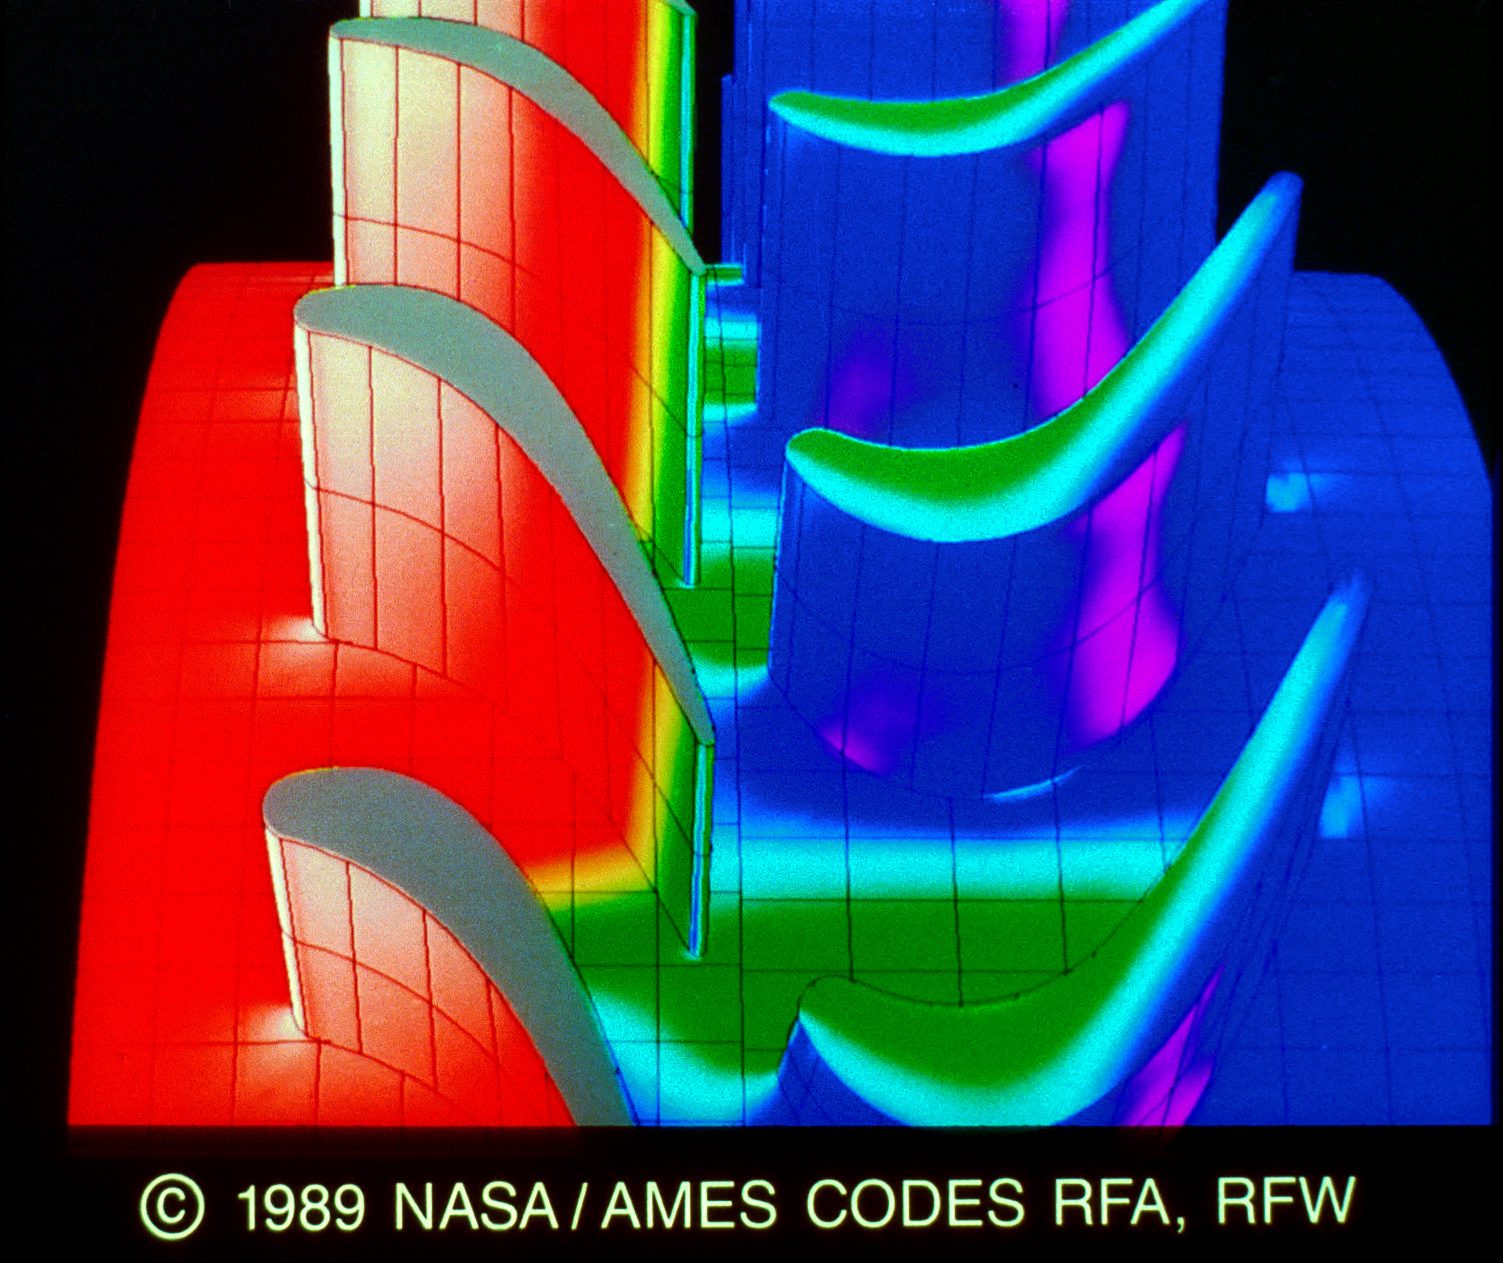
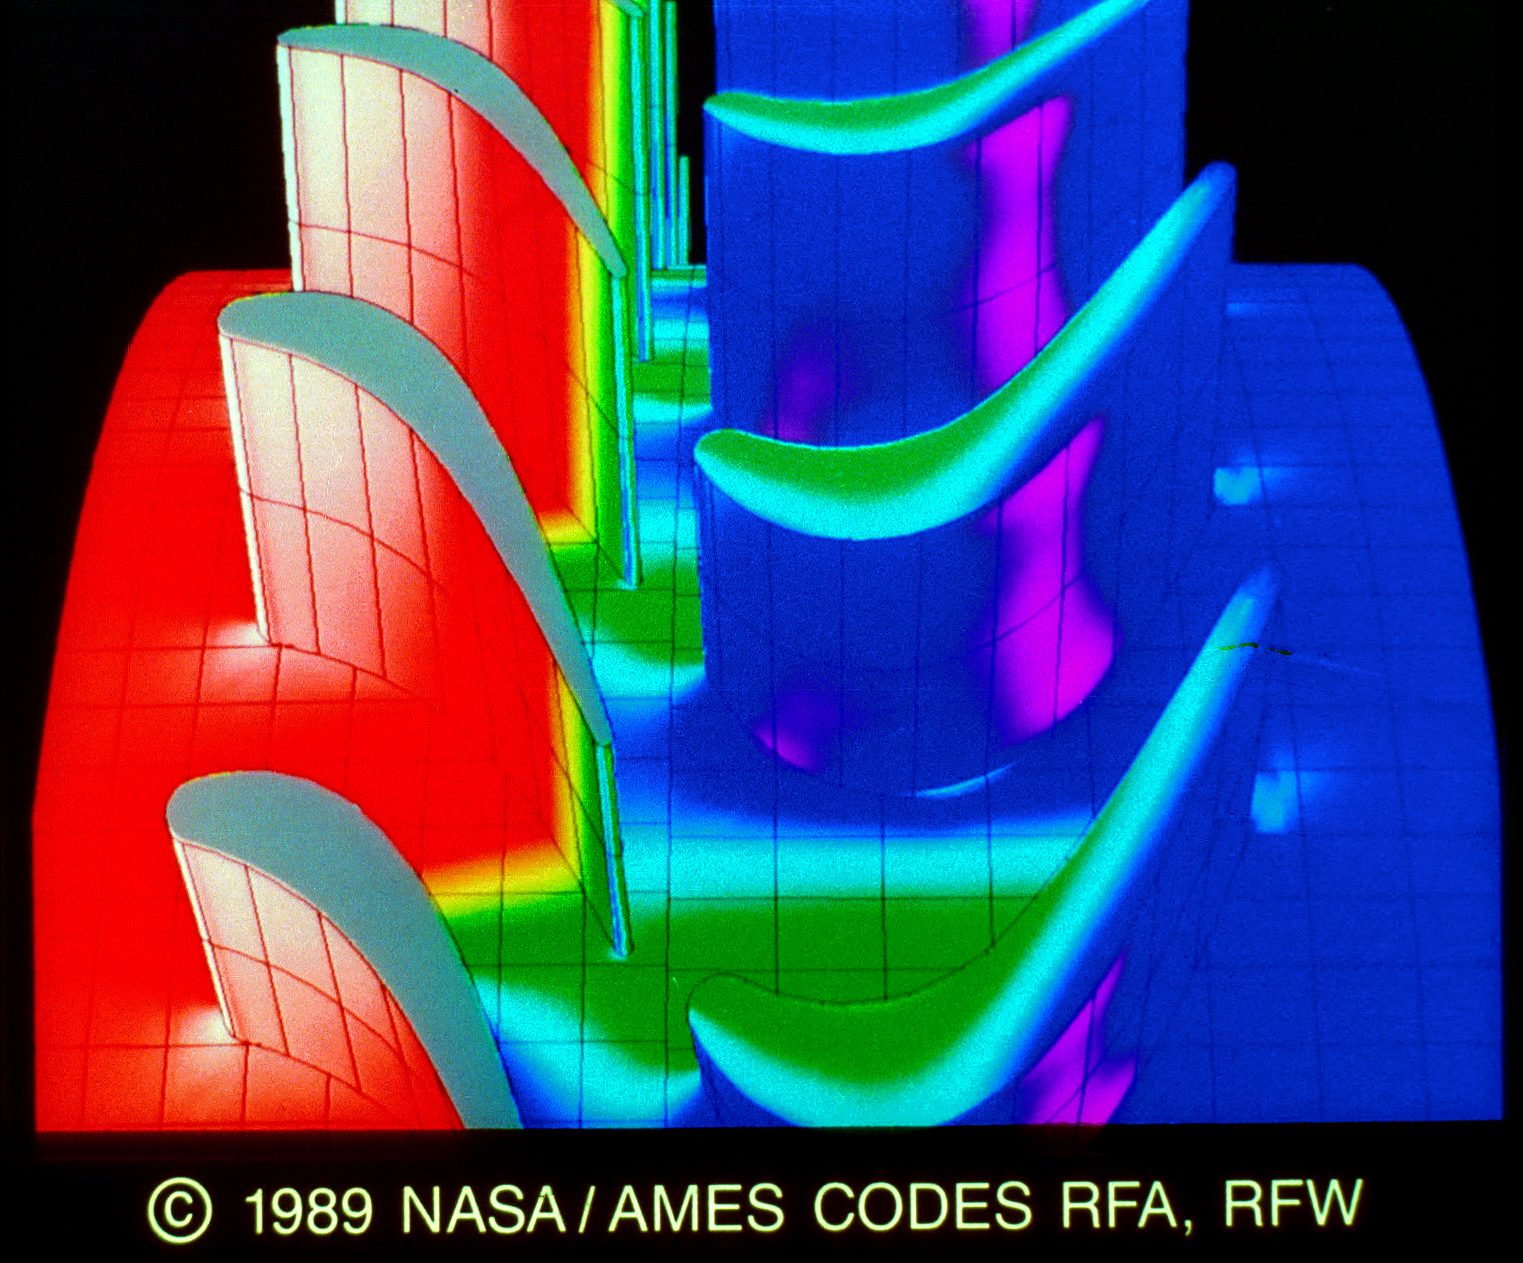
23&24. Pressure Distribution Inside the Rotor Stator by Man Mohan Rai and Paul Kelaita. These slides show the pressure distribution obtained from a full 3D simulation of the flow inside the rotor stator. This calculation includes rotors, stators, hub, casing and rotor-tip clearance. The color represents pressure. From highest to lowest the colors are: white, red, yellow, blue and purple. The scientists ran the ROTOR-3 code with a Mach number of 0.07. The images were created and displayed on a Silicon Graphics Iris 3130 using GAS (Graphics Animation System). Slides were taken with a Dunn 635 camera. Contact: Gordon V. Bancroft, MS-258-1, NASA Ames Research Center, Moffett Field, CA 94035.
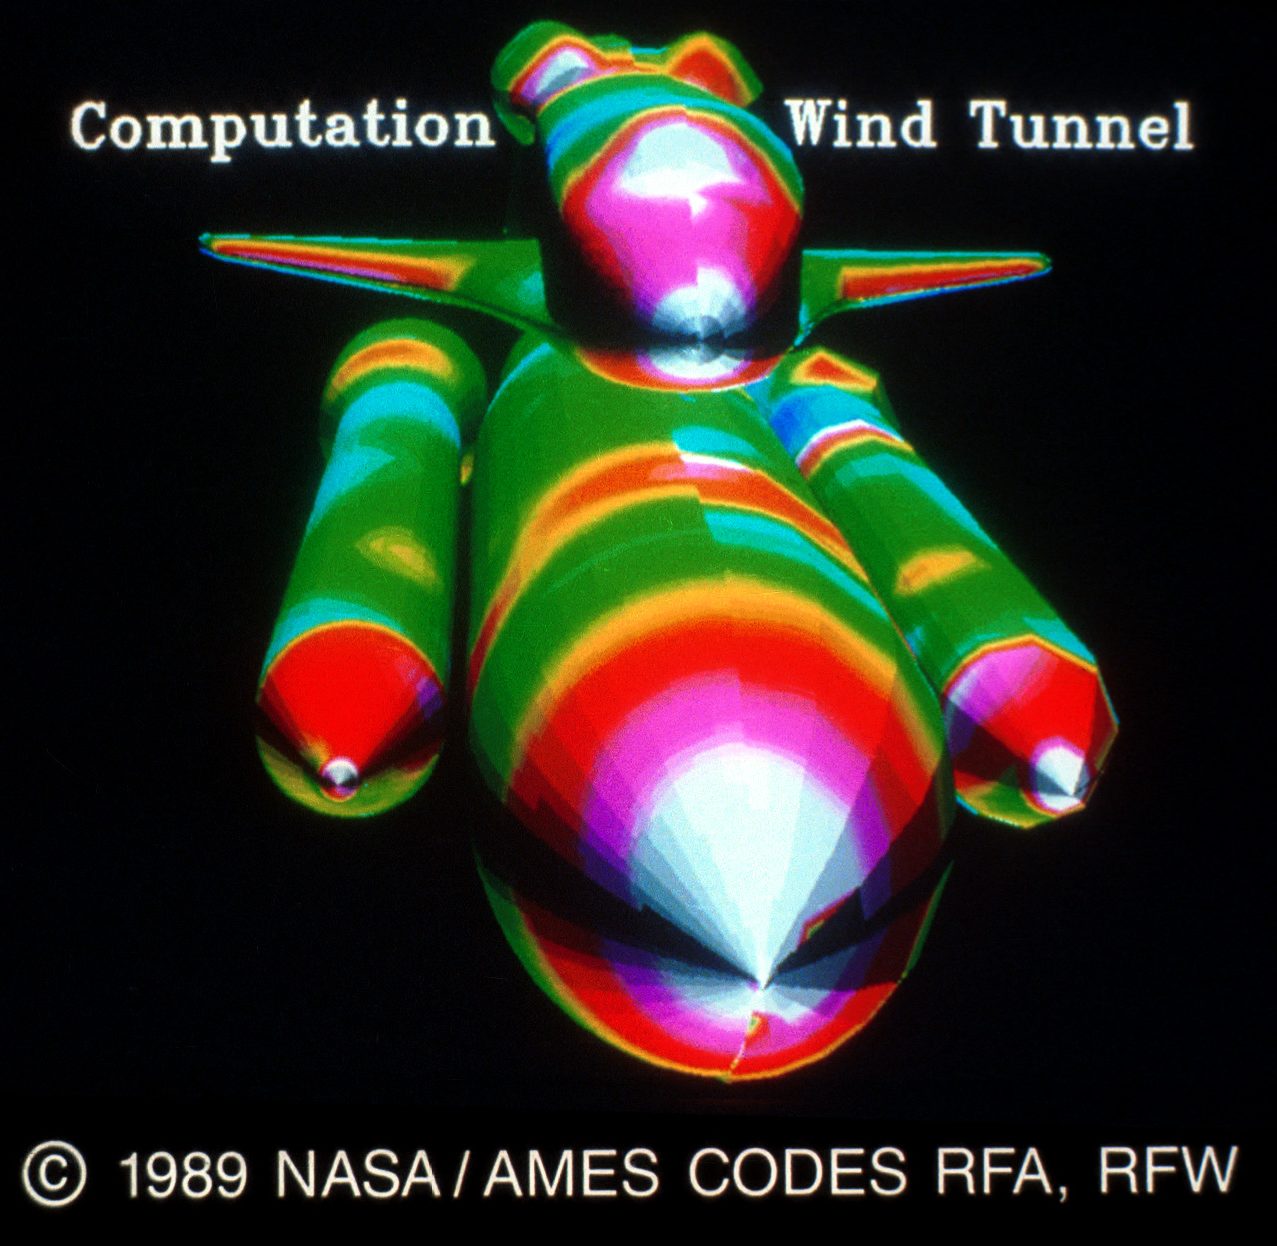
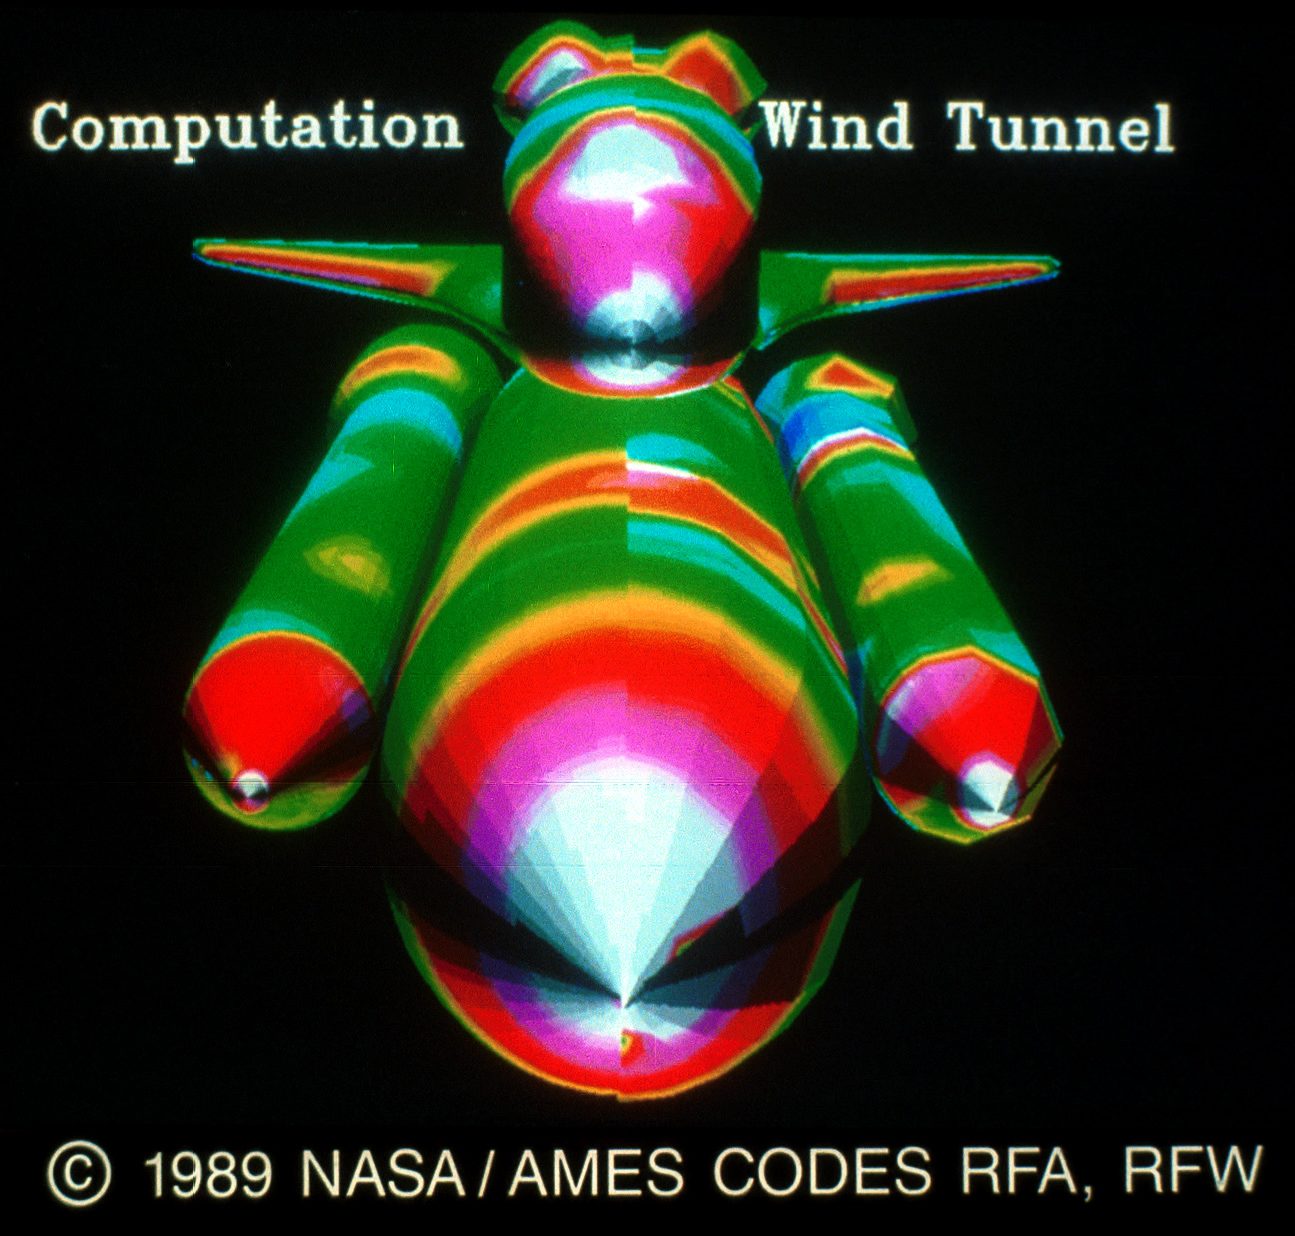
25&26. Space Shuttle Pressure Comparison by Pieter Suning, I. T. Chiu, Shigeru Obayashi, Yehia Rizk and Joseph Steger. These slides show the comparison of surface pressures from a computer simulation and wind tunnel experiment. Good agreement is shown in both features and overall pressure levels. The colors represent: white-highest pressure, greenstatic pressure and blue-lowest pressure. This comparison illustrates the basic capability to reproduce wind tunnel measurements with computer simulations. It gives confidence in the ability of CFO to give insight into a number of the aerodynamic issues affecting current space shuttle performance limitations. The code was a time dependent Navier-Stokes solver (F3D) with Chimera overlapped grid scheme. The conditions portrayed are Mach number of 1.55, angle of attack of -6 degrees and a Reynolds number of 2.5 x 10⁶. The images were created and displayed on a Silicon Graphics Iris 3130 using GAS (Graphics Animation System). Slides were taken with a Dunn 635 camera. Contact: Gordon V. Bancroft, MS 258-1, NASA Ames Research Center, Moffet Field, CA 94035.
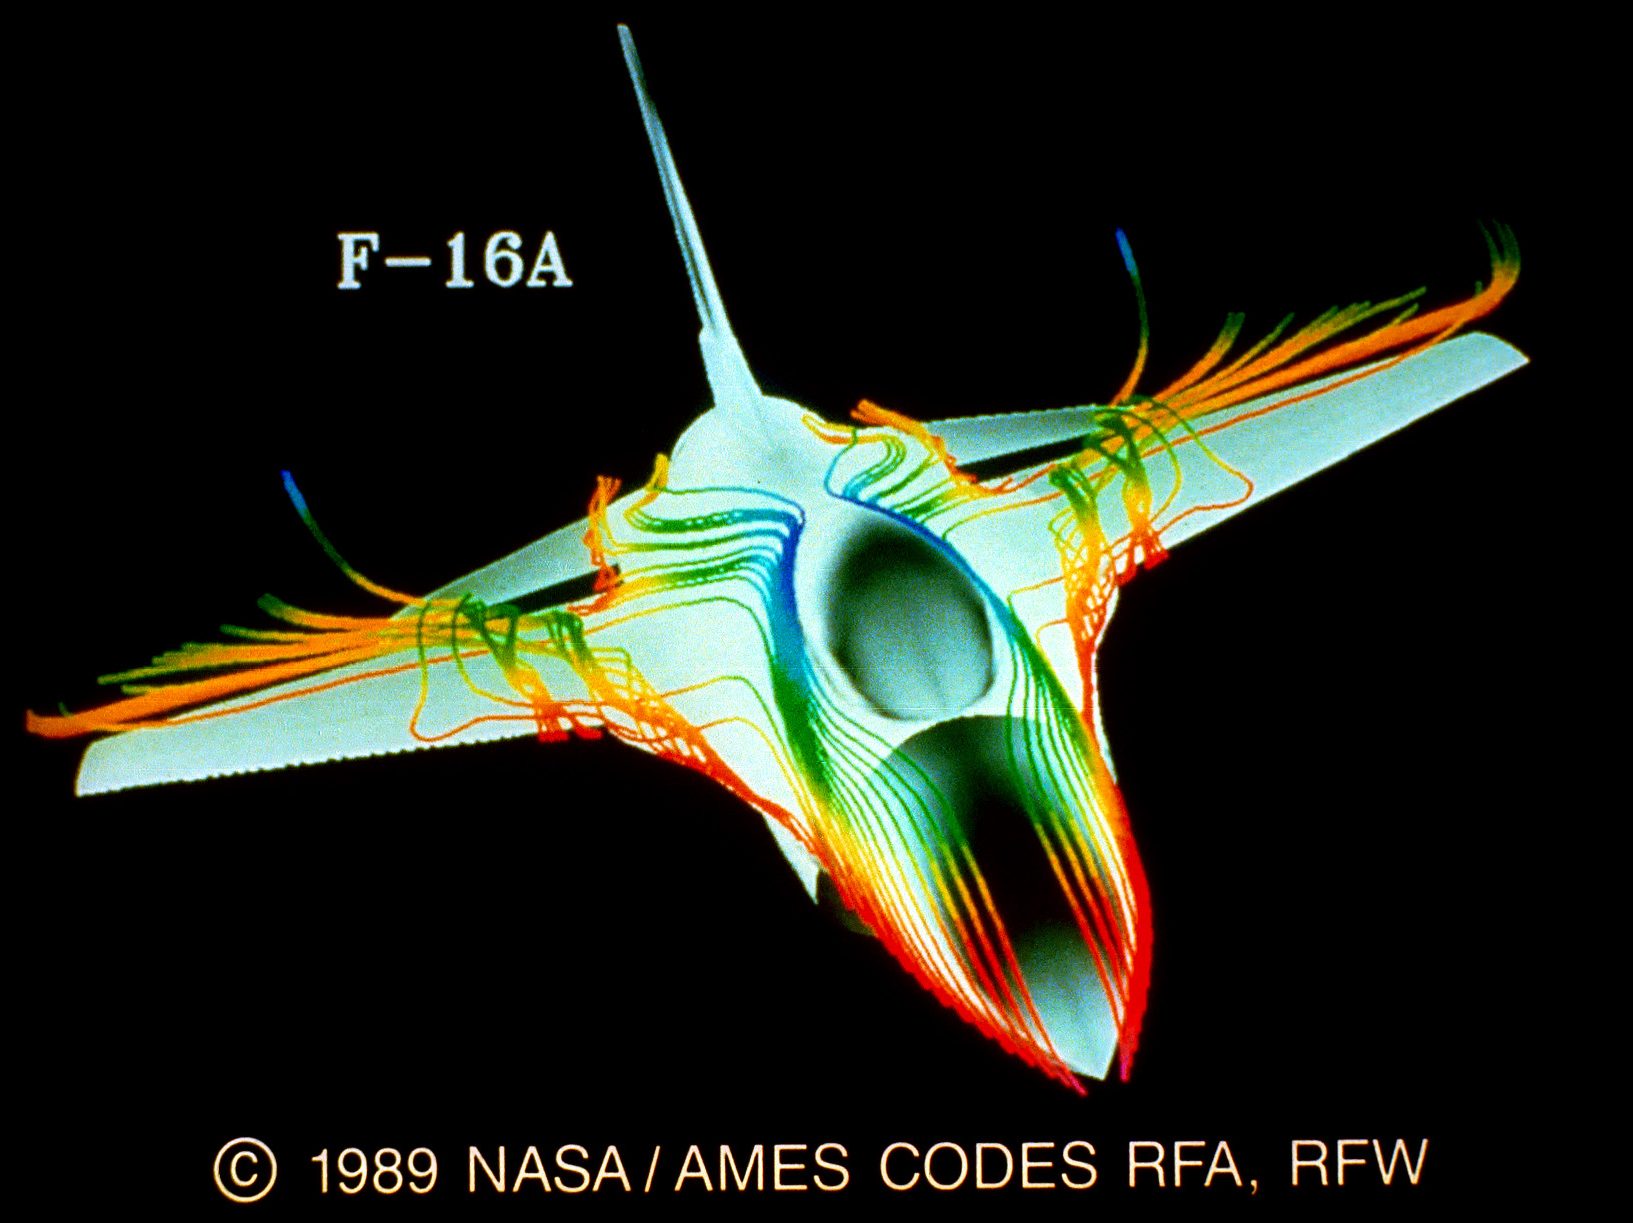
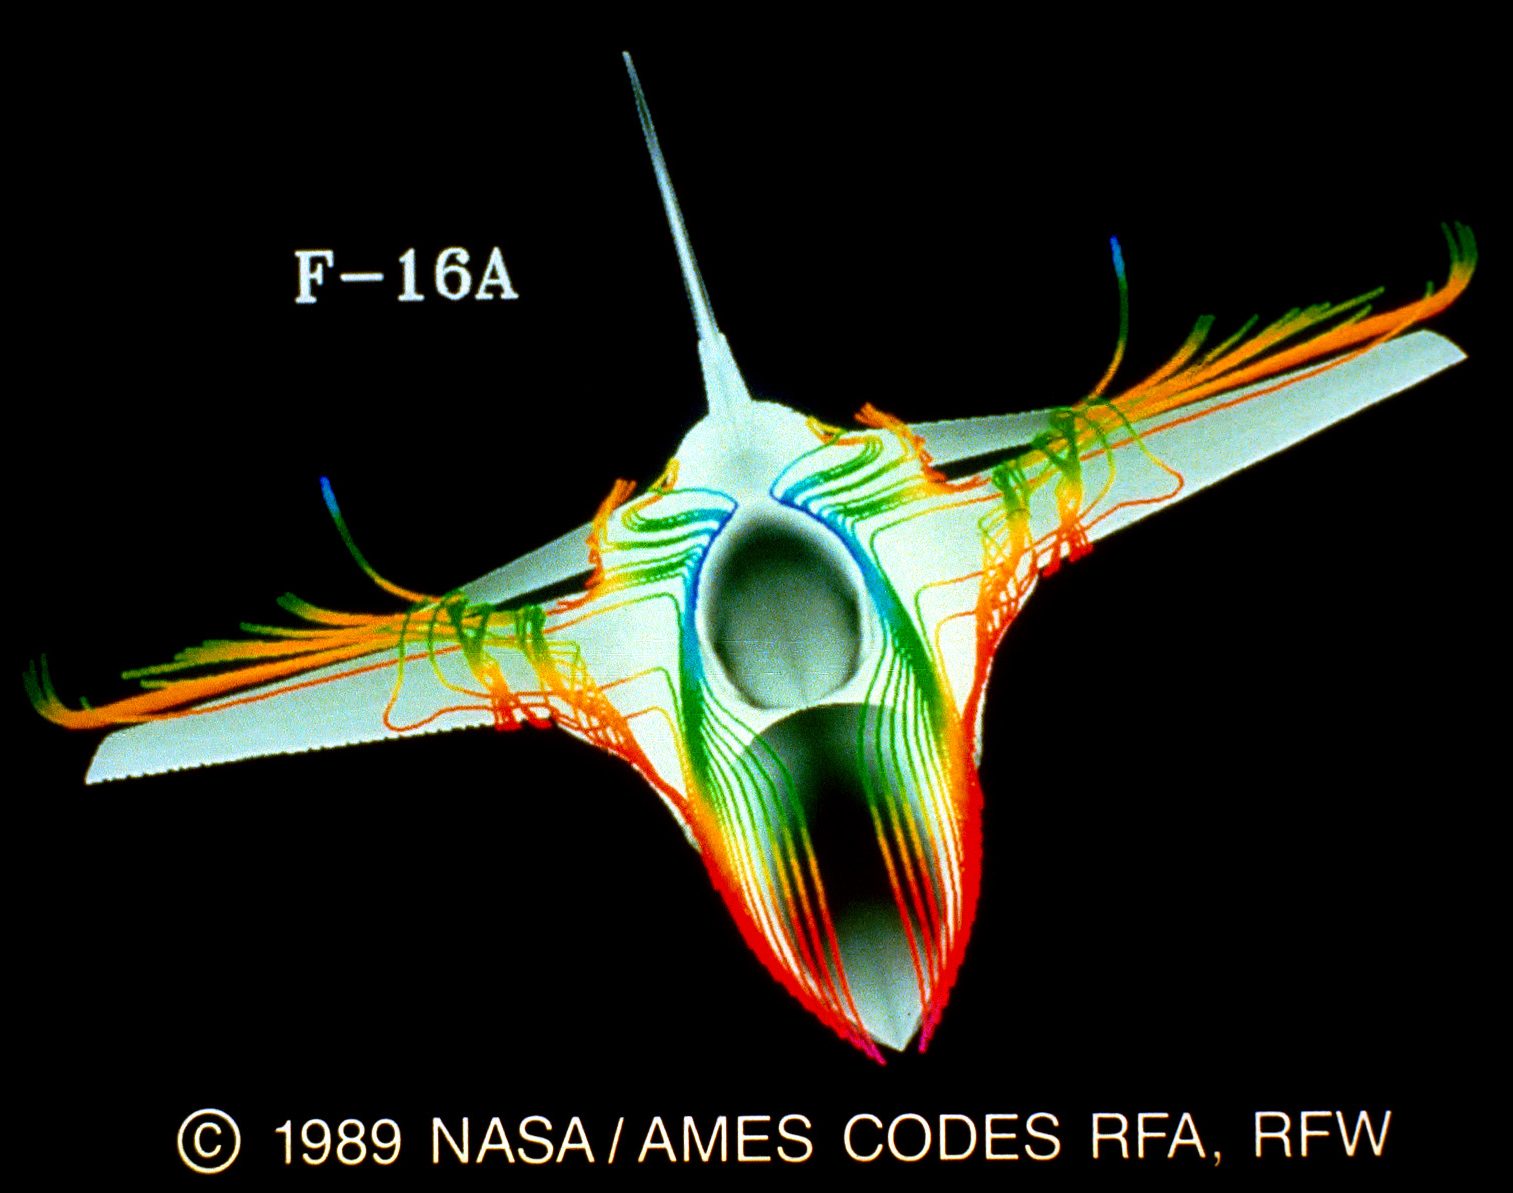
27&28. Particle Traces about an F16A by Jolen Flores, Neal Chaderjian, Terry Holst, Steve Reznick and Jason Williams. These slides show the simulated flow field about an F- 16A. (The configuration for the simulation did not contain the inlet or the tail.) The interaction between the vortex shed off the strake and the vortex shed off the wing is clearly visible. The colors on the simulated particle traces represent height above a horizontal plane through the center of the wings. Red is closest to this horizontal plane and blue is highest above this plane. The code was a transonic Navier-Stokes (TNS). The conditions portrayed are Mach number of 0.2 and an angle of attack of IO degrees. The images were created and displayed on a Silicon Graphics Iris 3130 using GAS (Graphics Animation System). Slides were taken with a Dunn 635 camera. Contact: Gordon V. Bancroft, MS 258-1, NASA Ames Research Center, Moffet Field, CA 94035.
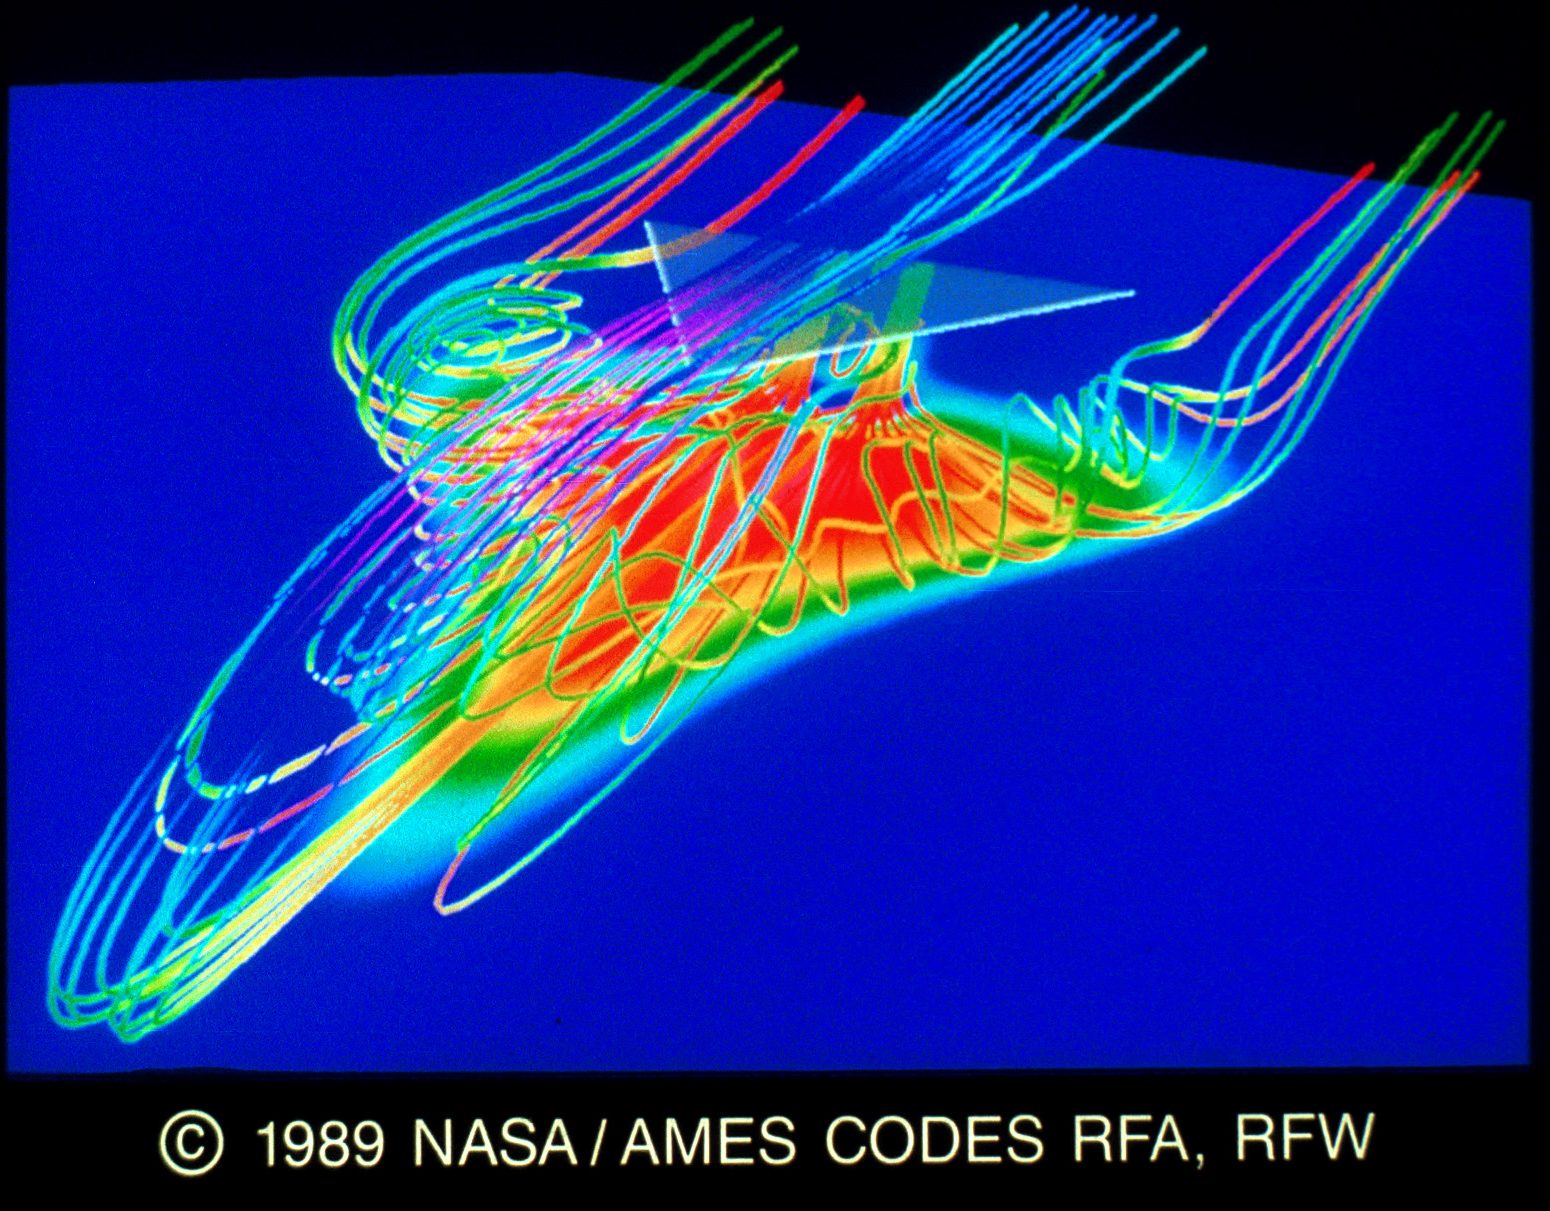
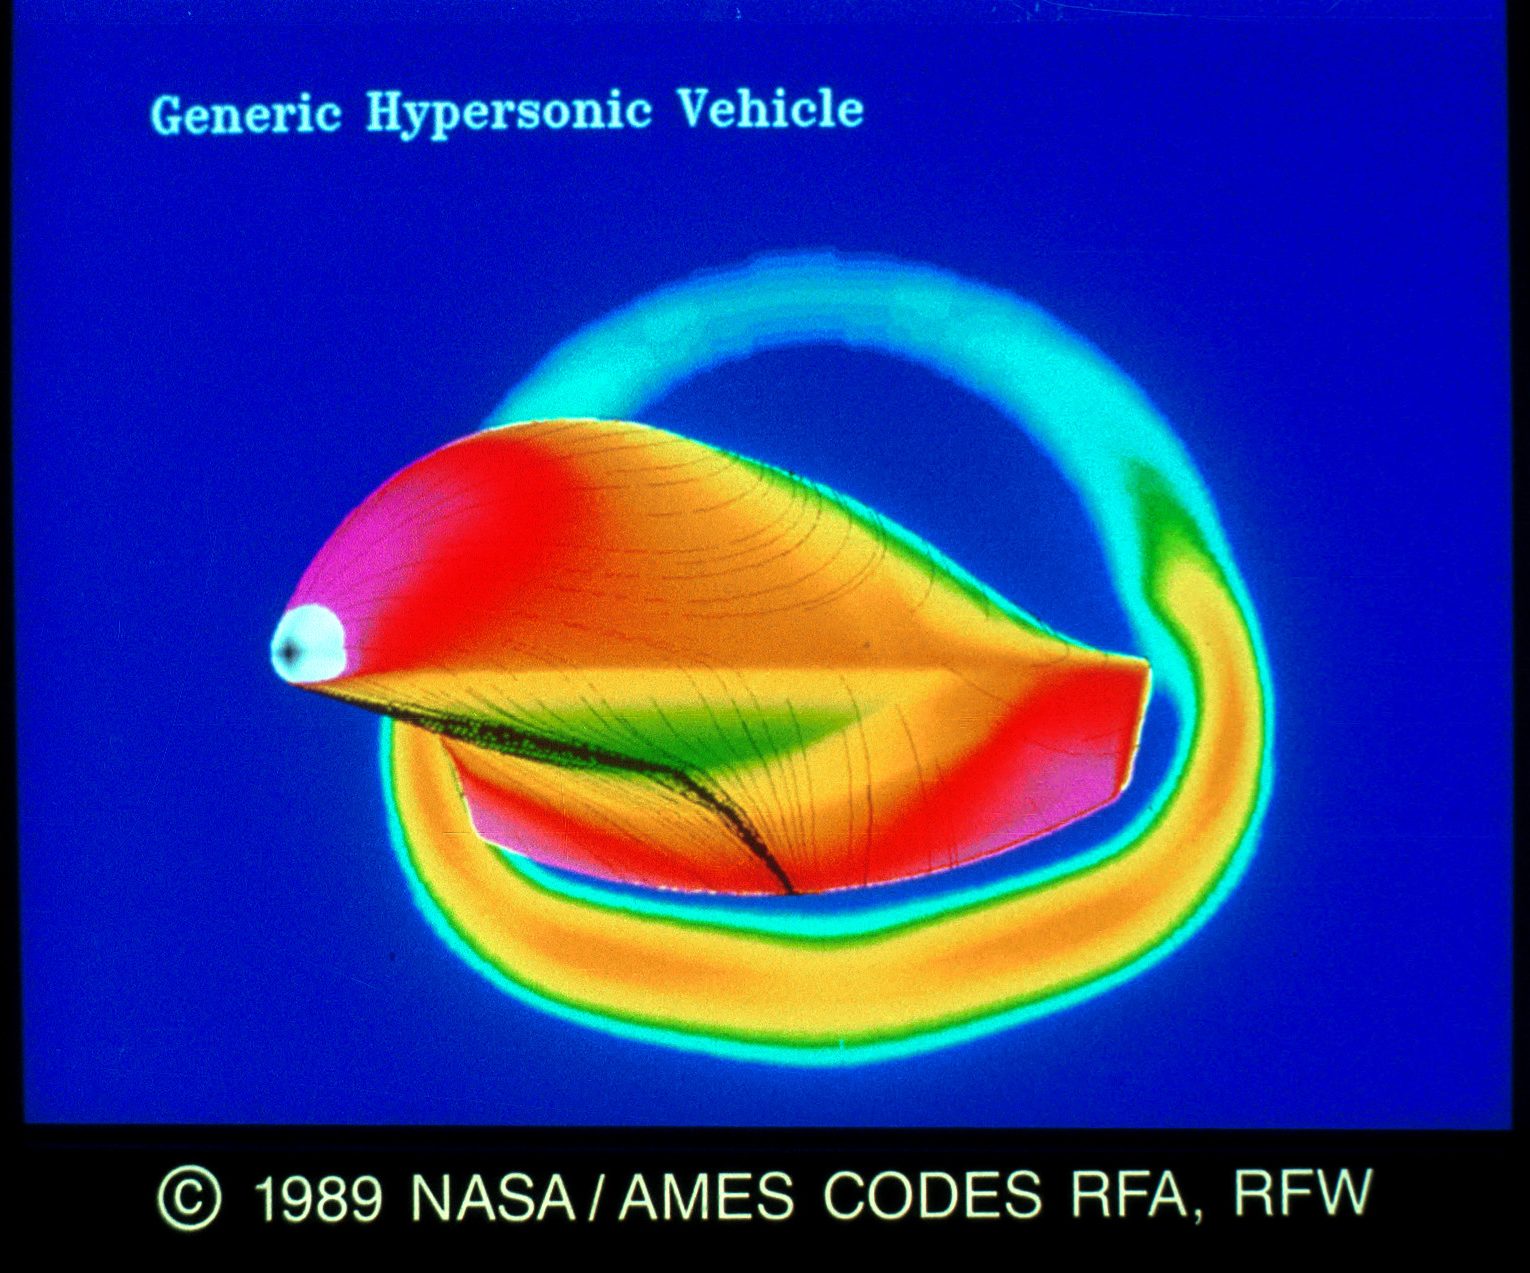
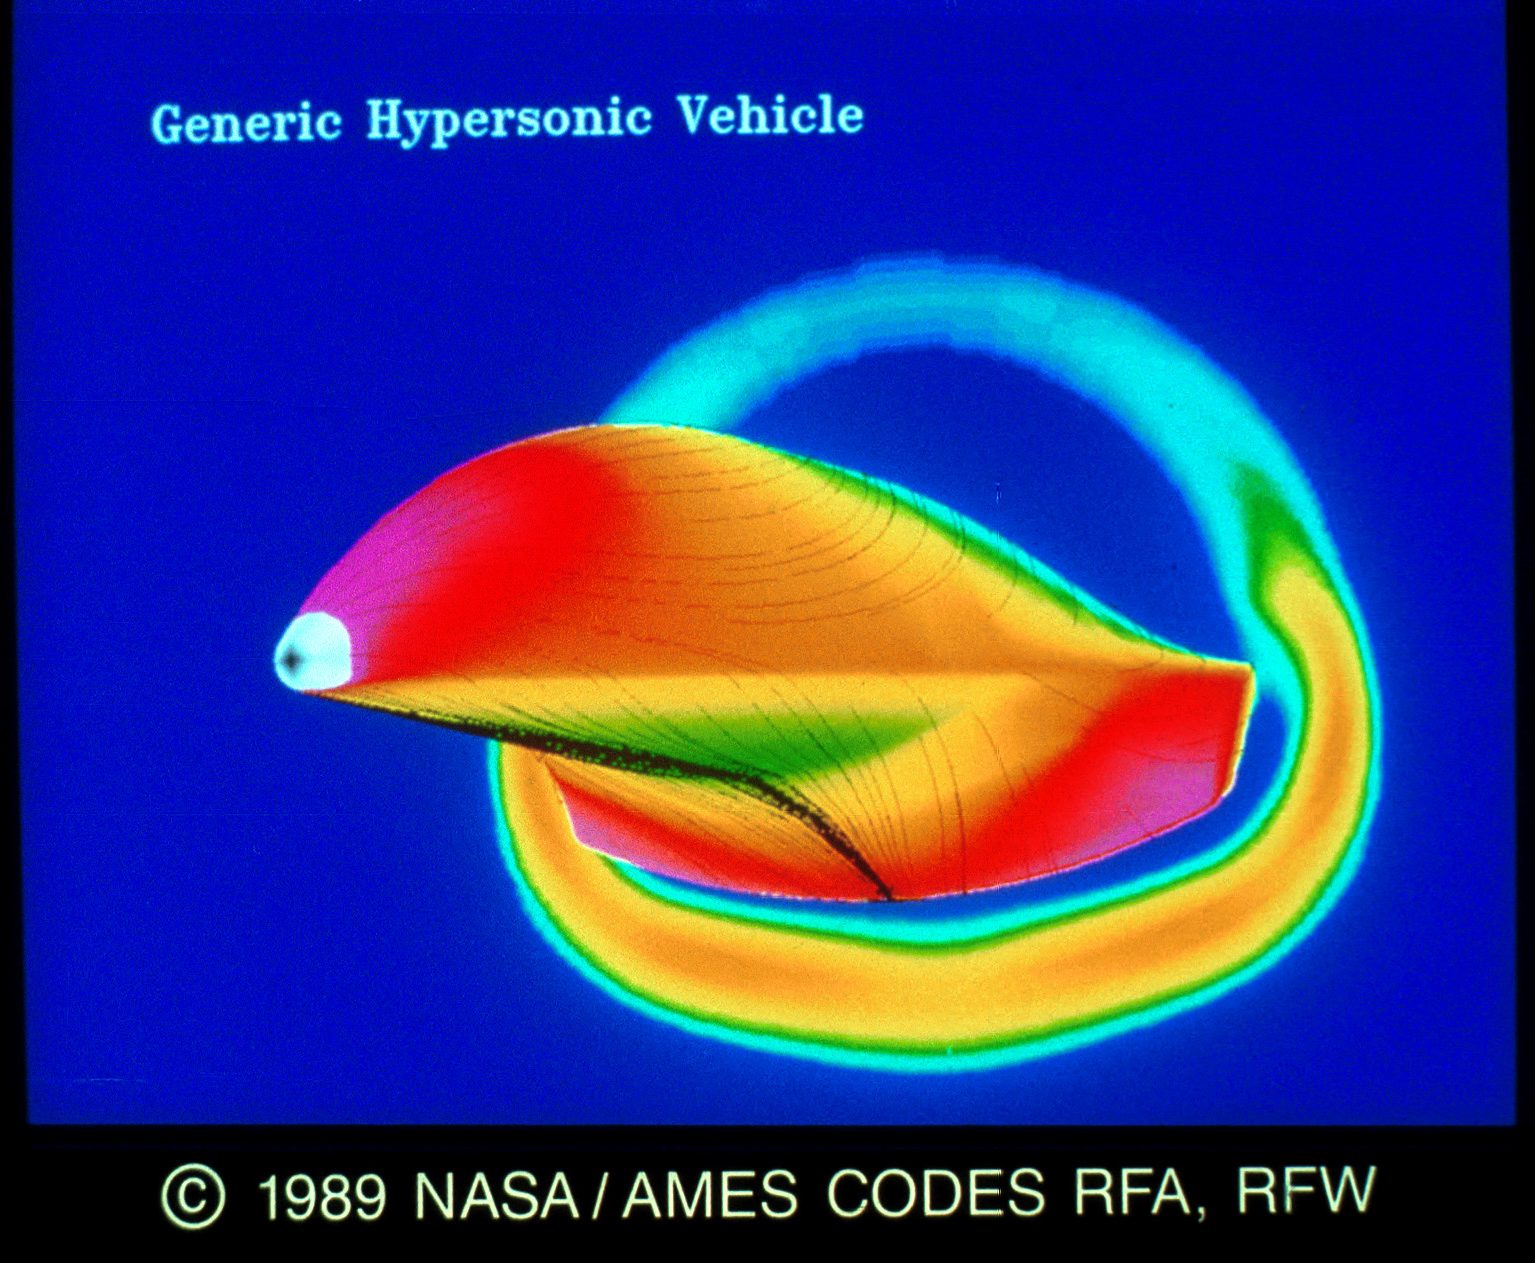
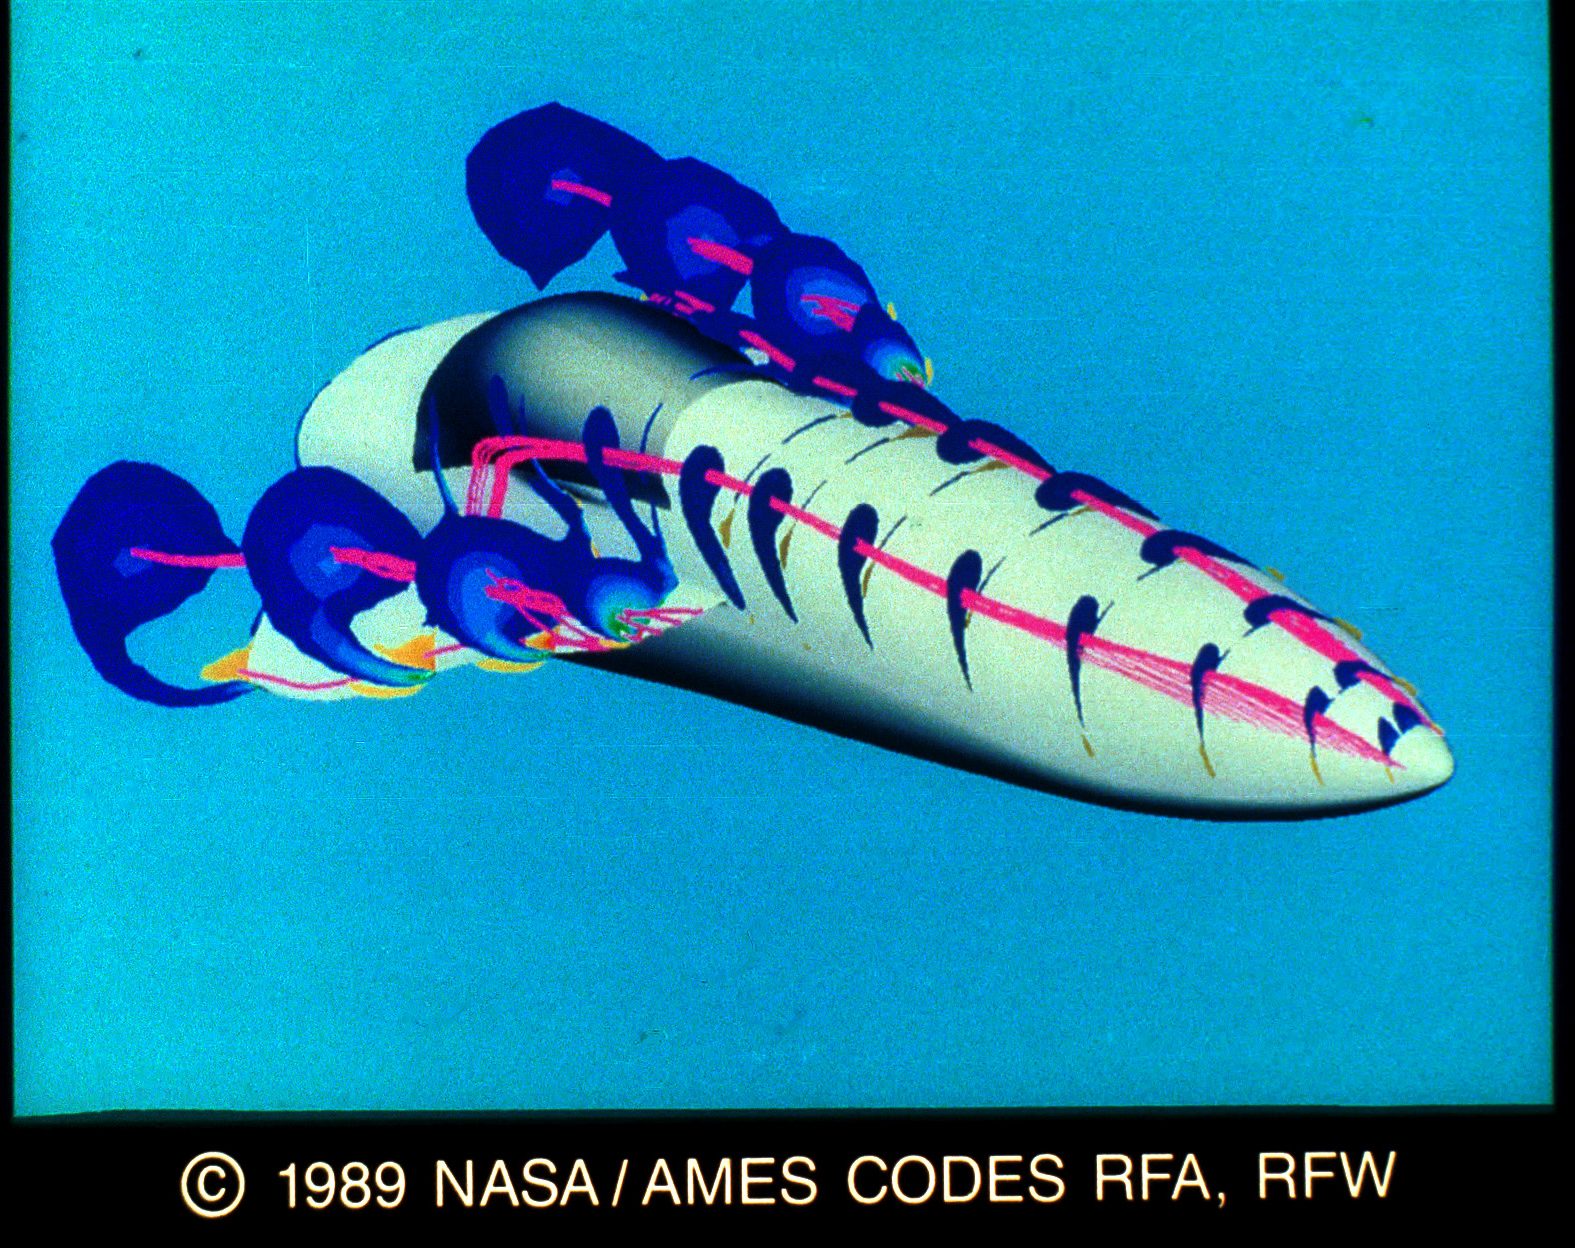
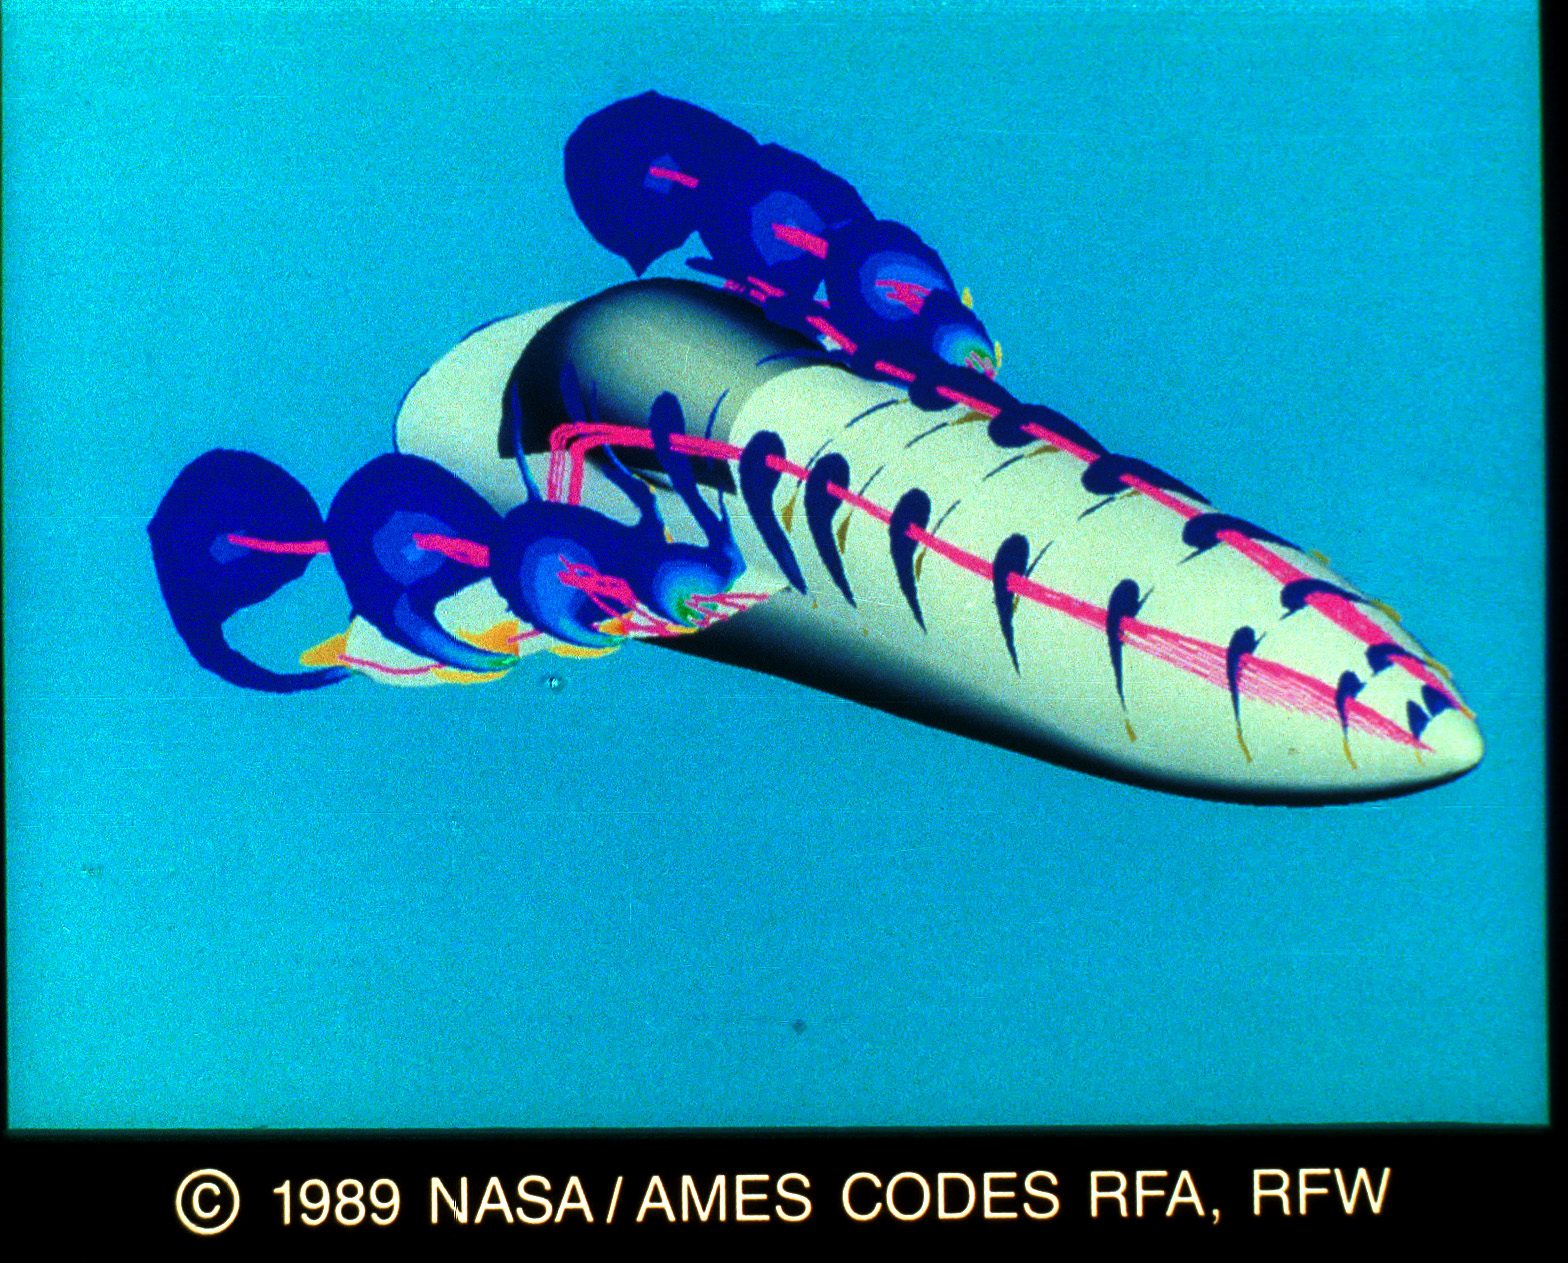
29&30. Hypersonic Vehicle Flow Field by Scott Lawrence. These slides show the pressure (represented by colors) on the surface of the hypersonic vehicle and on a cross section of the shock layer. Also shown is a simulated oil flow pattern. Magenta represents the highest pressure and blue the lowest. The code was a Parabolized NavierStokes solver (UPS). The conditions portrayed are Mach number of 12.4, angle of attach of 0.0 degrees and a Reynolds number of 0.22 x 10⁶. The images were created and displayed on a Silicon Graphics Iris 3130 using GAS (Graphics Animation System). Slides were taken with a Dunn 635 camera. Contact: Gordon V. Bancroft, MS 258-1, NASA Ames Research Center, Moffett Field, CA 94035.
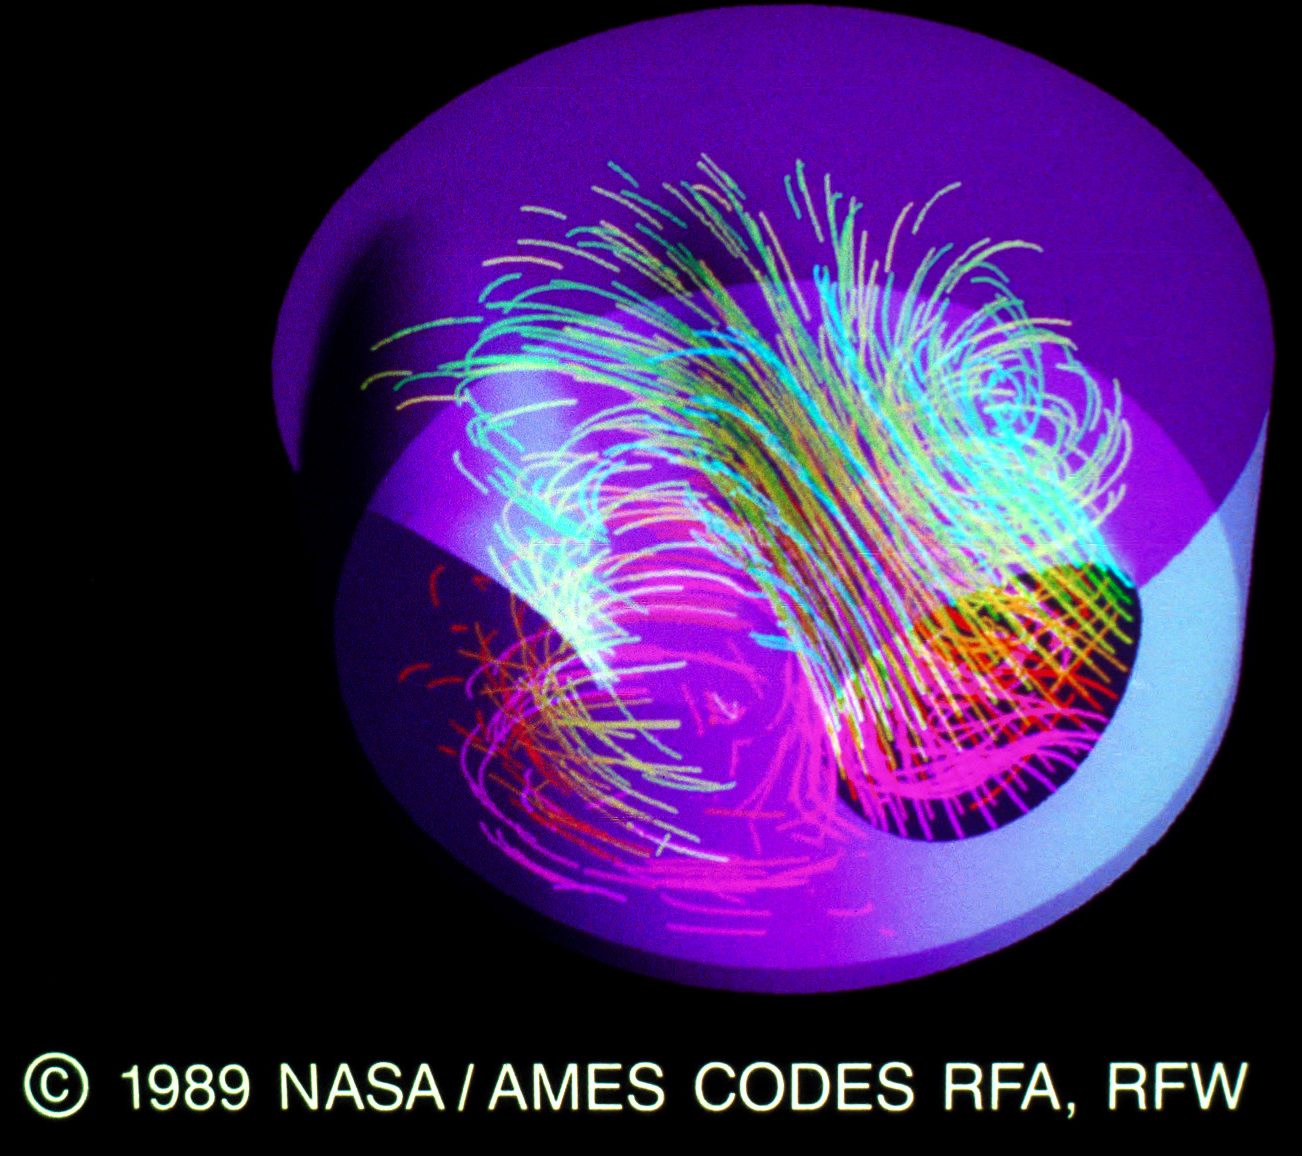
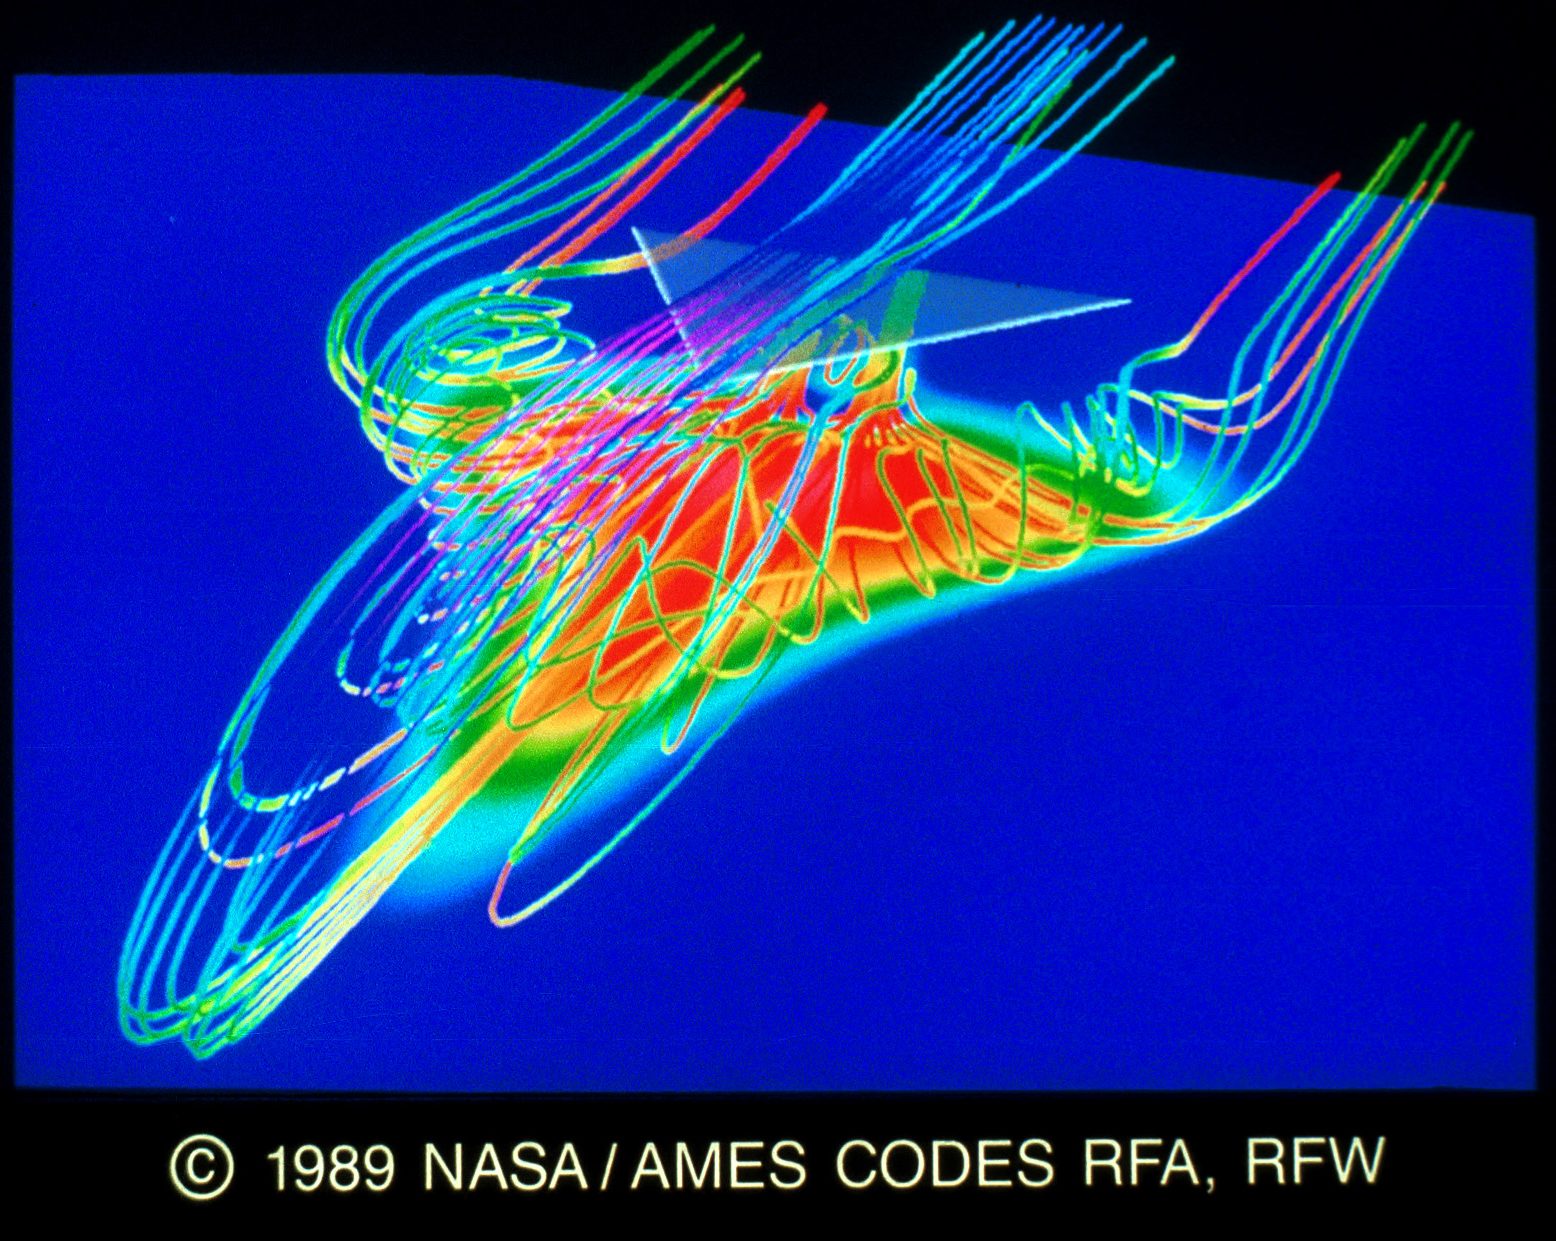
31&32. F-18 Fuselage Forebody Flow Structure by Lewis B. Schiff, Russell M. Cummings, Reese L. Sorenson and Yehia Rizk. These slides show the vortex flow structure over the F-18 fuselage forebody at 30 degrees angle of attack and fullscale flight Reynolds number. The forebody and leading-edge extension vortices are visualized using helicity density contours, where both the primary vortices (shown in blue shading) and the secondary vortices (shown in yellow shading) are predicted. Particle traces also show the position of the vortices. These results are in good qualitative agreement with available flight test data, which shows the capability of the current flow solvers to predict full-scale aerodynamics. The code was a time dependent Navier-Stokes solver (F3D). The conditions portrayed are Mach number of 0.2, angle of attack of 30 degrees and a Reynolds number of 11.52 x 10⁶. The images were created on a Silicon Graphics Iris 4D/70 GT and displayed on a Silicon Graphics Iris 3120 using GAS (Graphics Animation System). Slides were taken with a Dunn 635 camera. Contact: Gordon V. Bancroft, MS 258-1, NASA Ames Research Center, Moffett Field, CA 94035.
33&34. V/STOL Delta Planform with Multiple Jets in Ground Effect by Kalpana Chawla, William R. Van Dalsem and Kuditipudi V. Rao. These slides show particle traces starting from the jet exit area and rear wing tips. The particle traces are colored by height above the ground. Red represents the ground level and blue is above the delta wing. The ground plane is colored by density. The code was a time dependent Navier-Stokes solver (F3D) and Pegasus. The conditions portrayed are 60 degree Delta Planform, angle of attack of 6.4 degrees and a Reynolds number of 1.2 x 10⁶. The freestream Mach number was 0.064, a jet Mach number of 1.0 and the height/span of 0.25. The images were created on a Silicon Graphics Iris 4D/70 GT and displayed on a Silicon Graphics Iris 3120 using GAS (Graphics Animation System). Slides were taken with a Dunn 635 camera. Contact:Gordon V. Bancroft, MS 258-1, NASA Ames Research Center, Moffett Field, CA 94035.
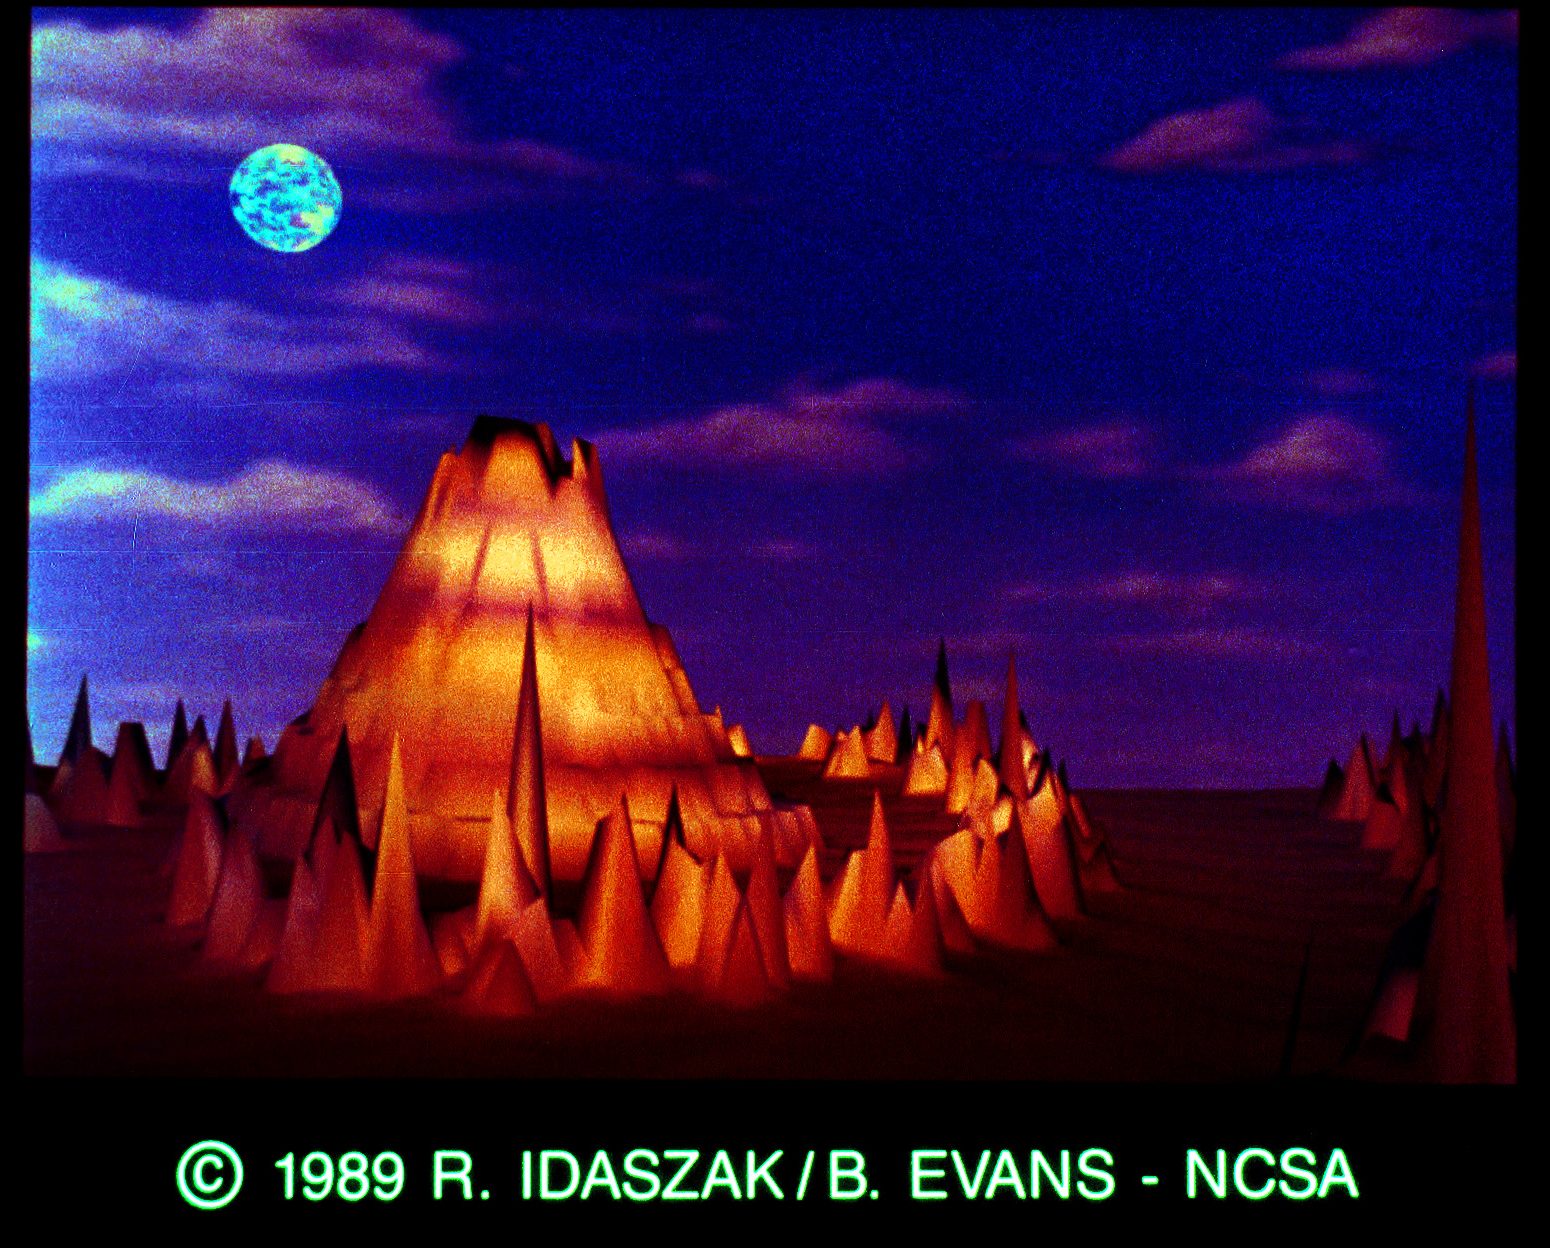
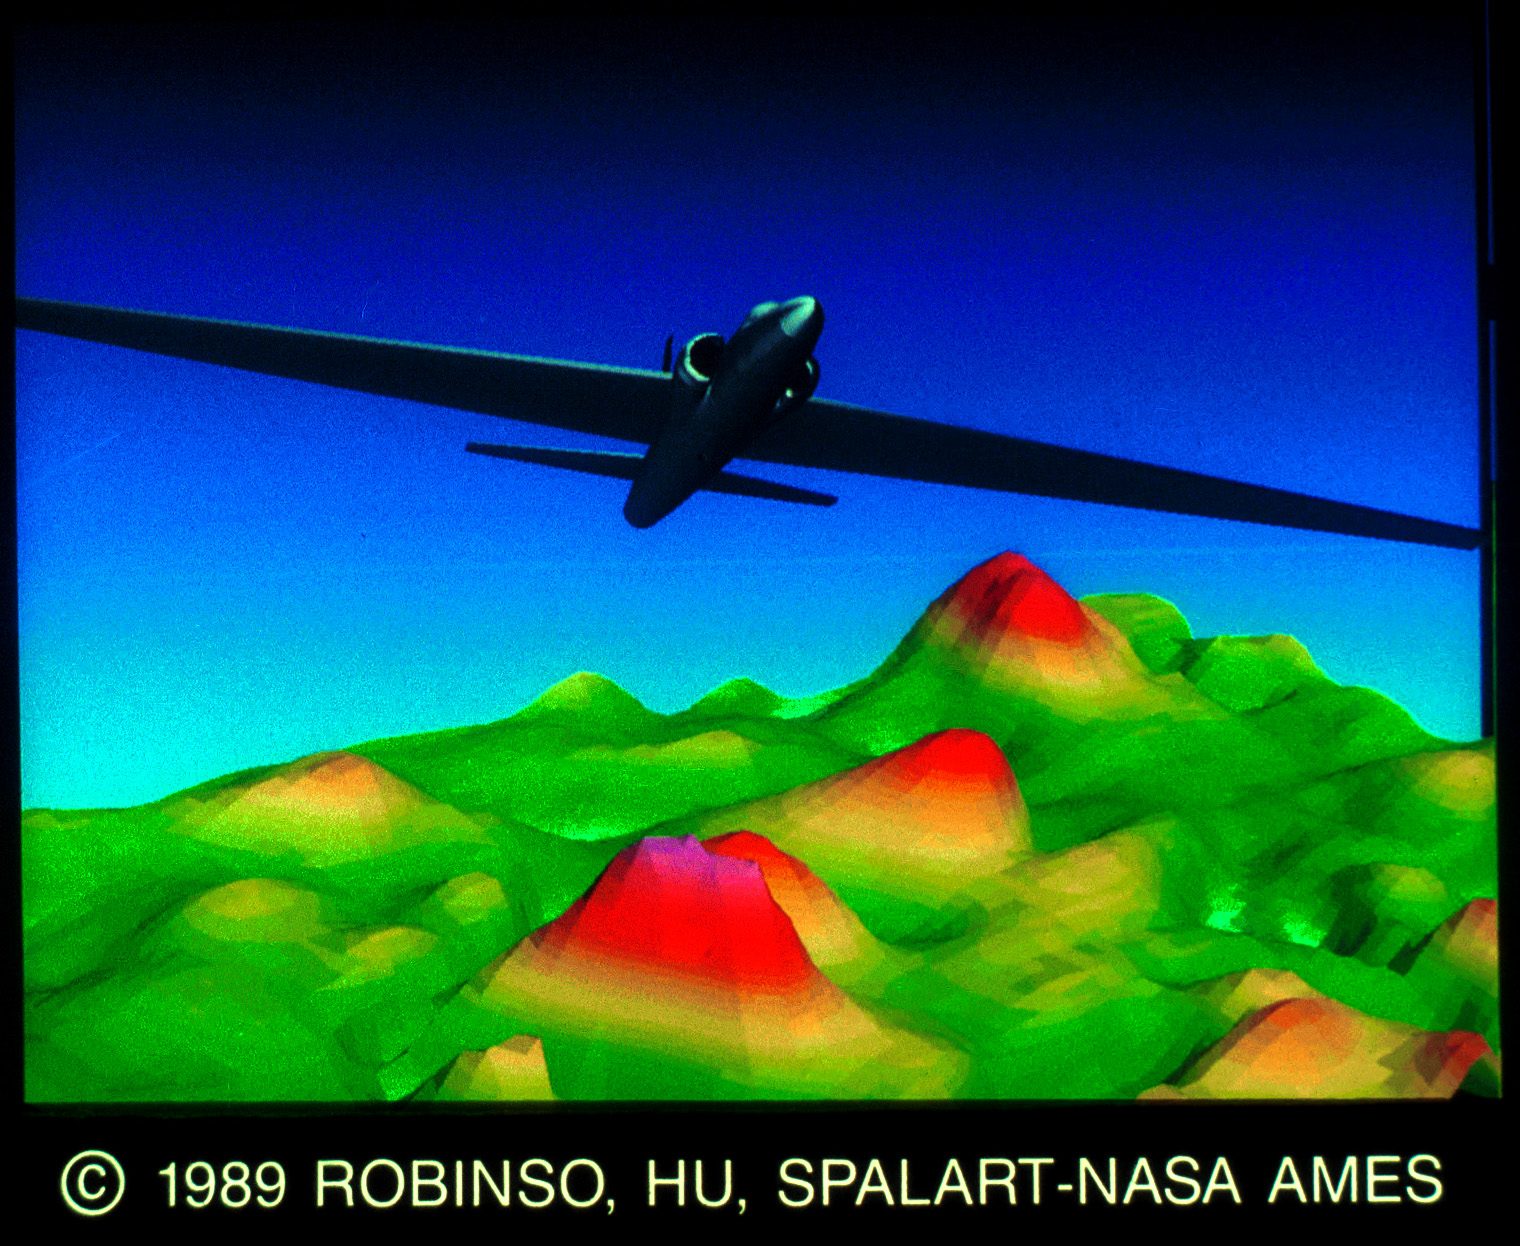
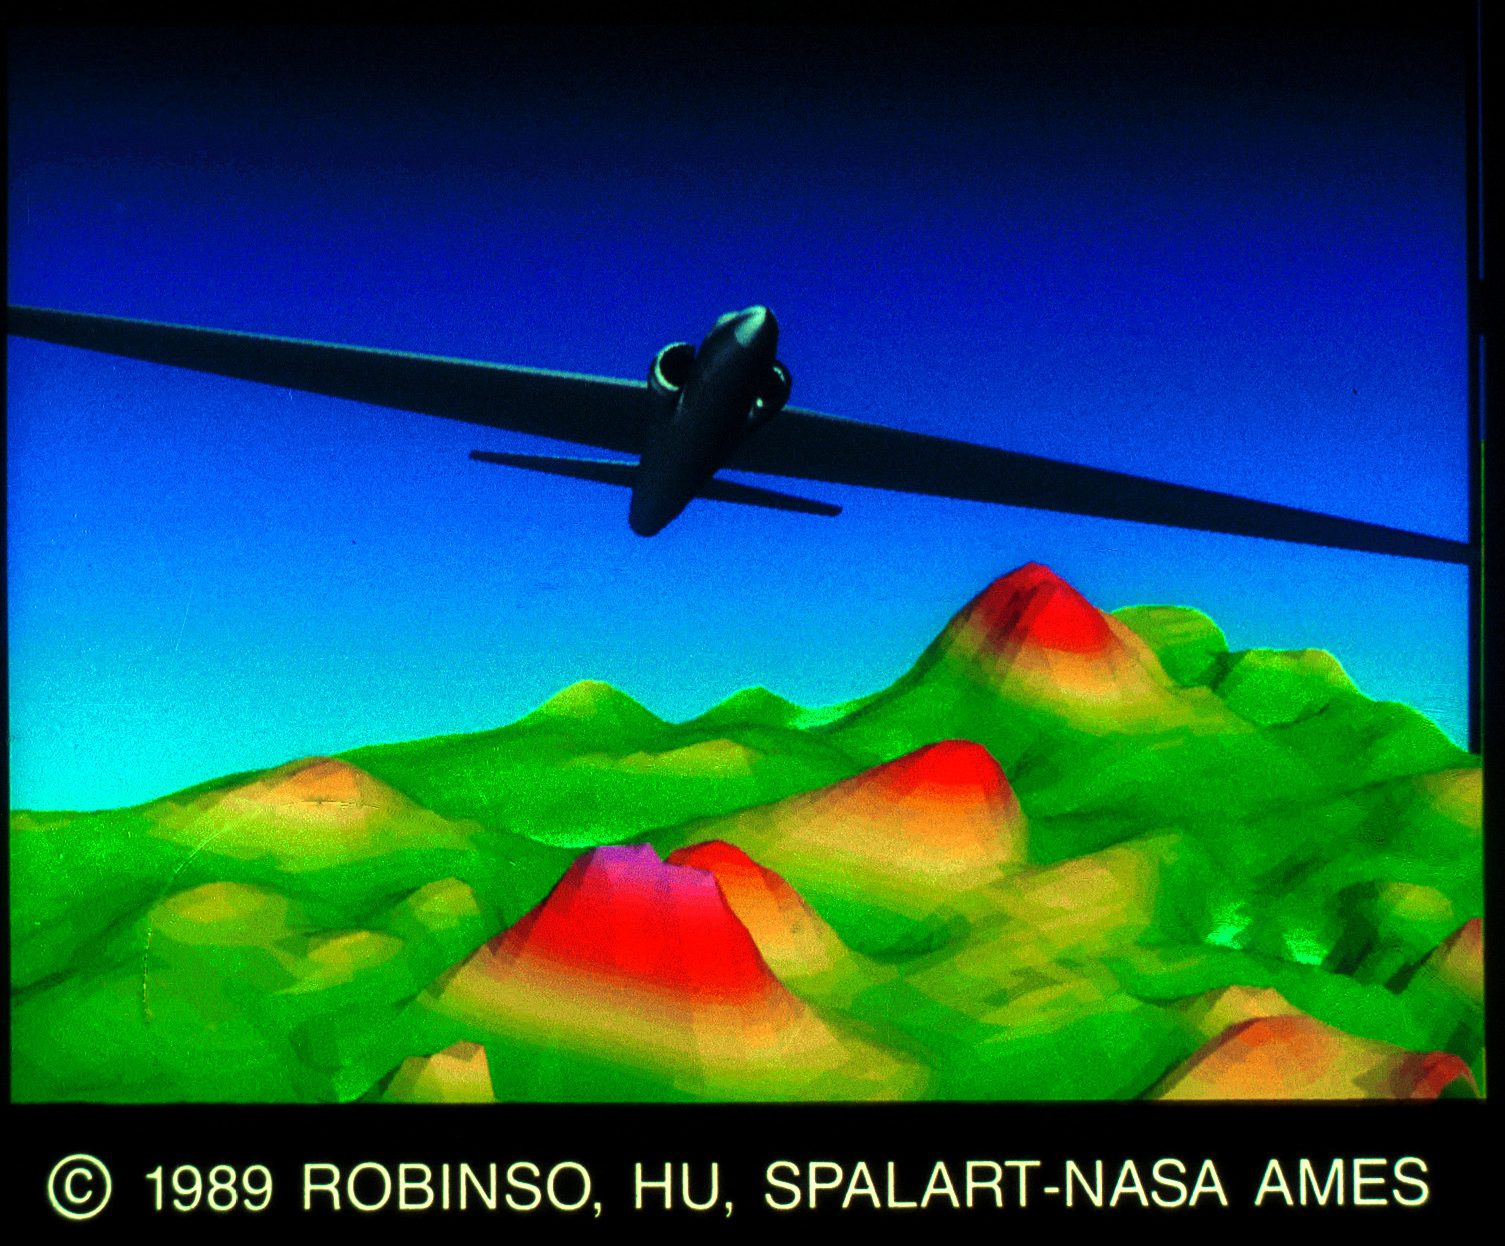
35&36. ER2 over a Turbulent Landscape by S. K. Robinson, B. Murtha, K. C. Hu and P. R. Spalart. NASA Earth Resources Survey Aircraft (ER2) flies over a landscape created from the surface pressure field of a numerically simulated turbulent boundary layer. The ER2 by S. K. Robinson and B. Murtha, the stereo software by K. C. Hu and the simulation was performed by P. R. Spalart. Hardware used included a Silicon Graphics Iris workstation and Dunn camera. Contact: Stephen K. Robinson, MS 229-1, NASA Ames Research Center, Moffett Field, CA 94035, (415) 694-6220.
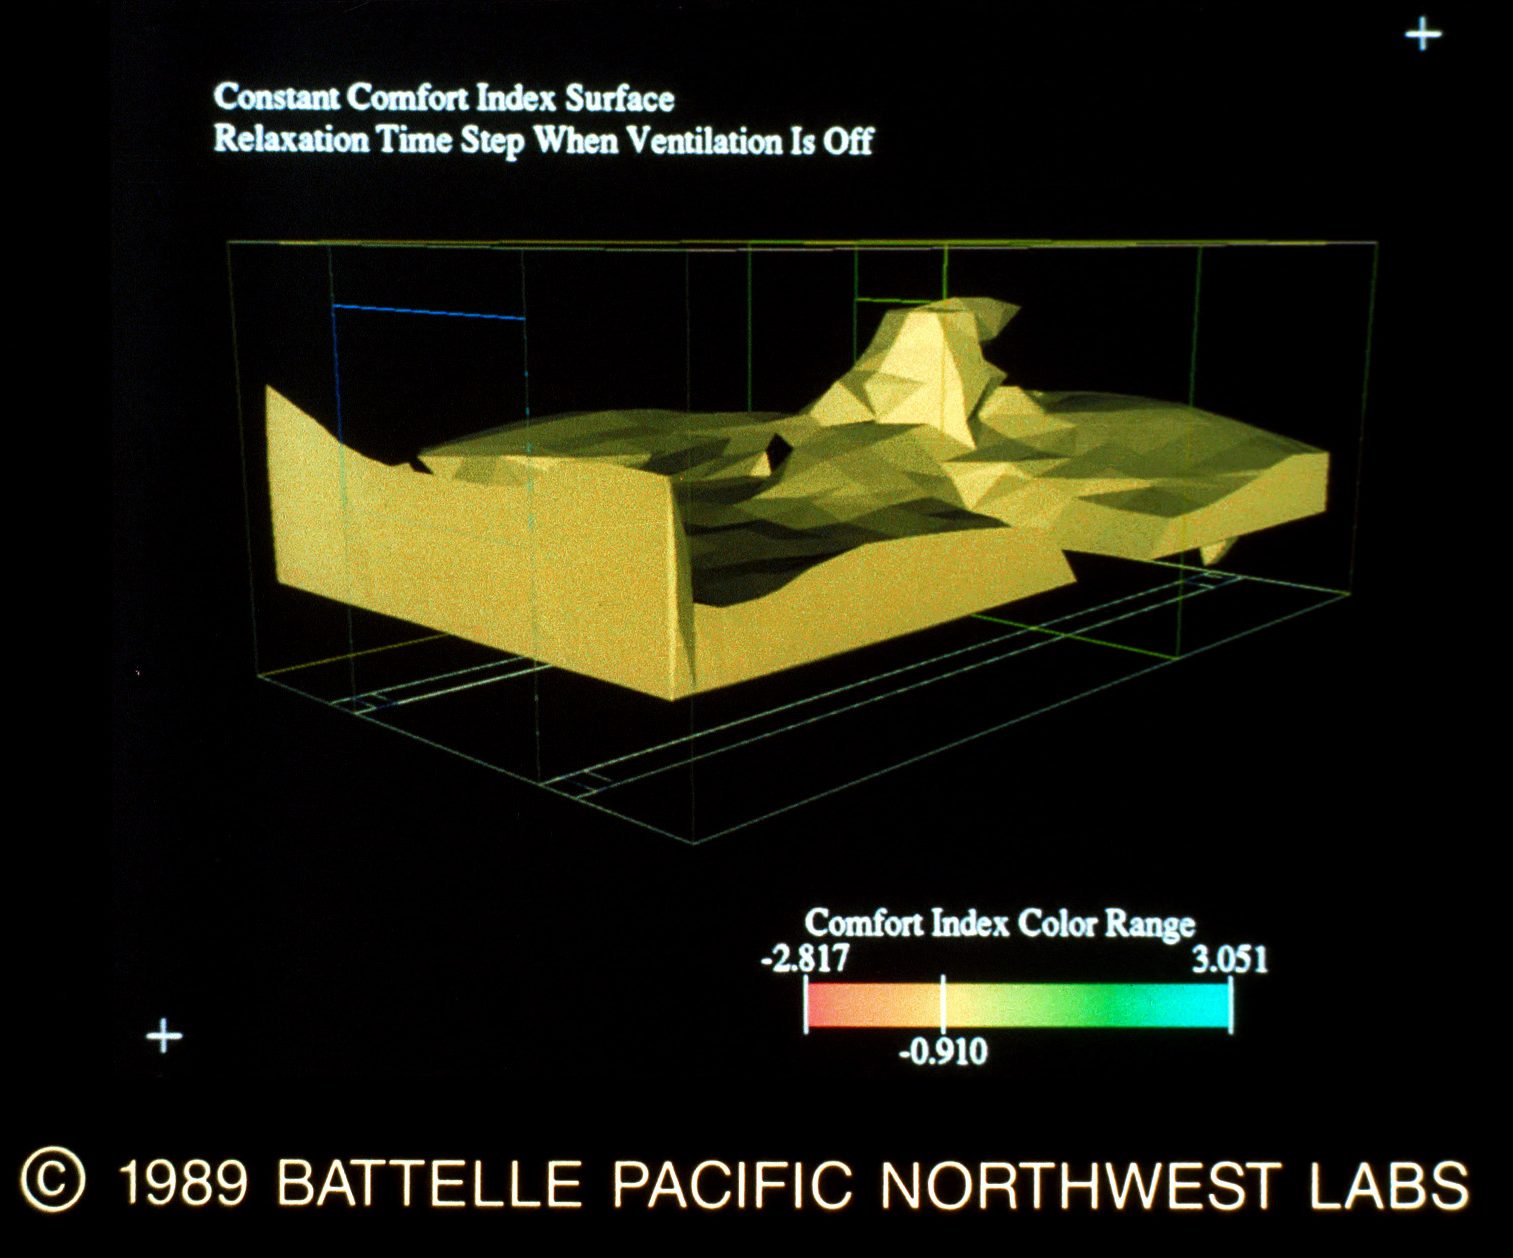
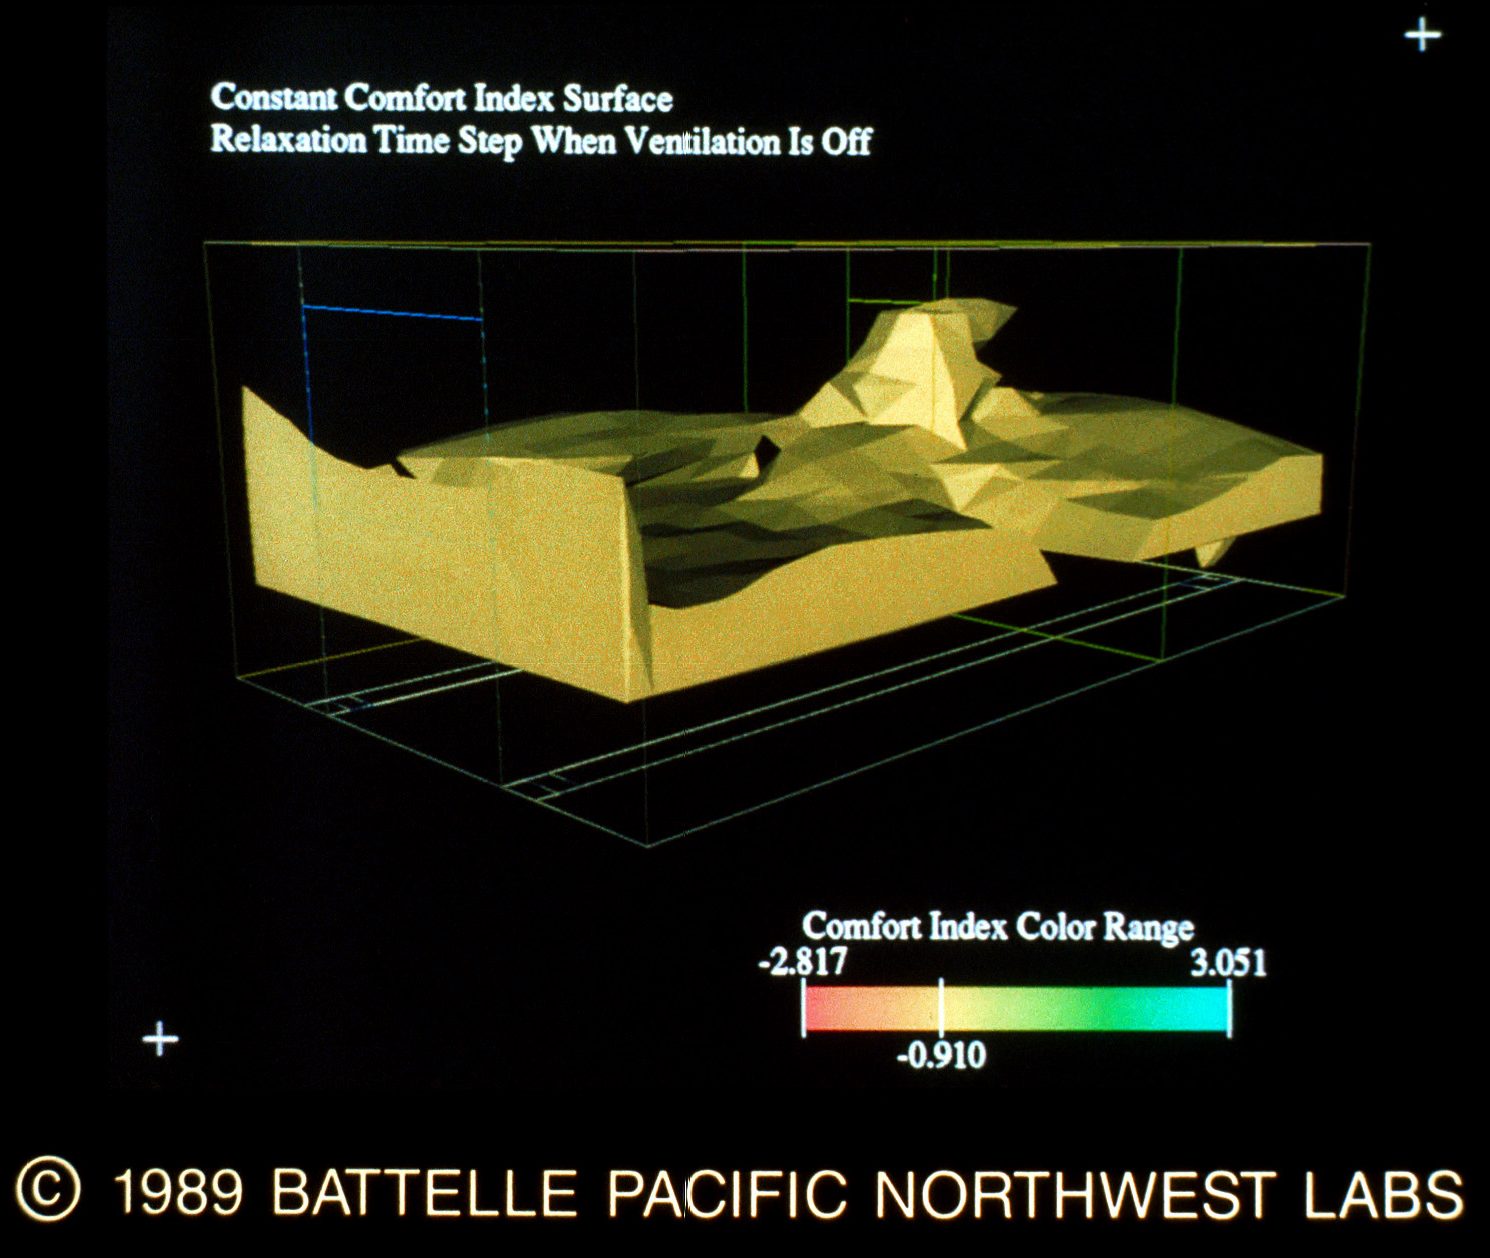
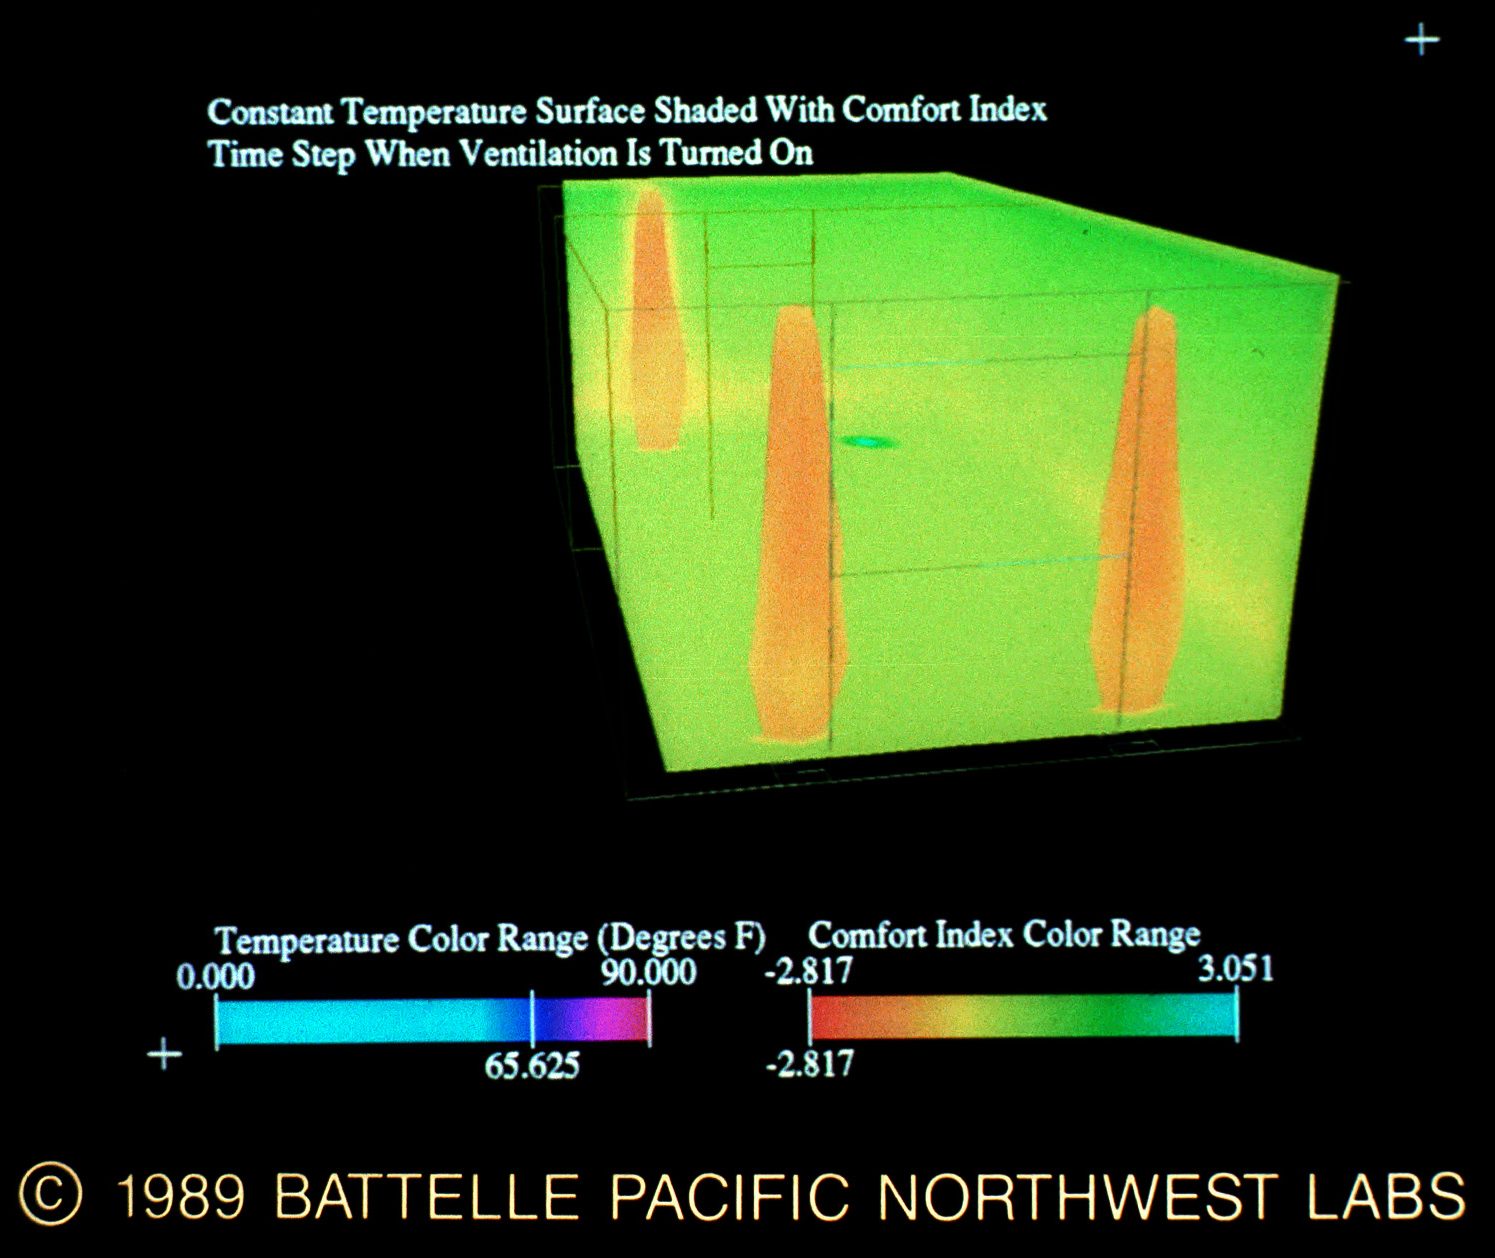
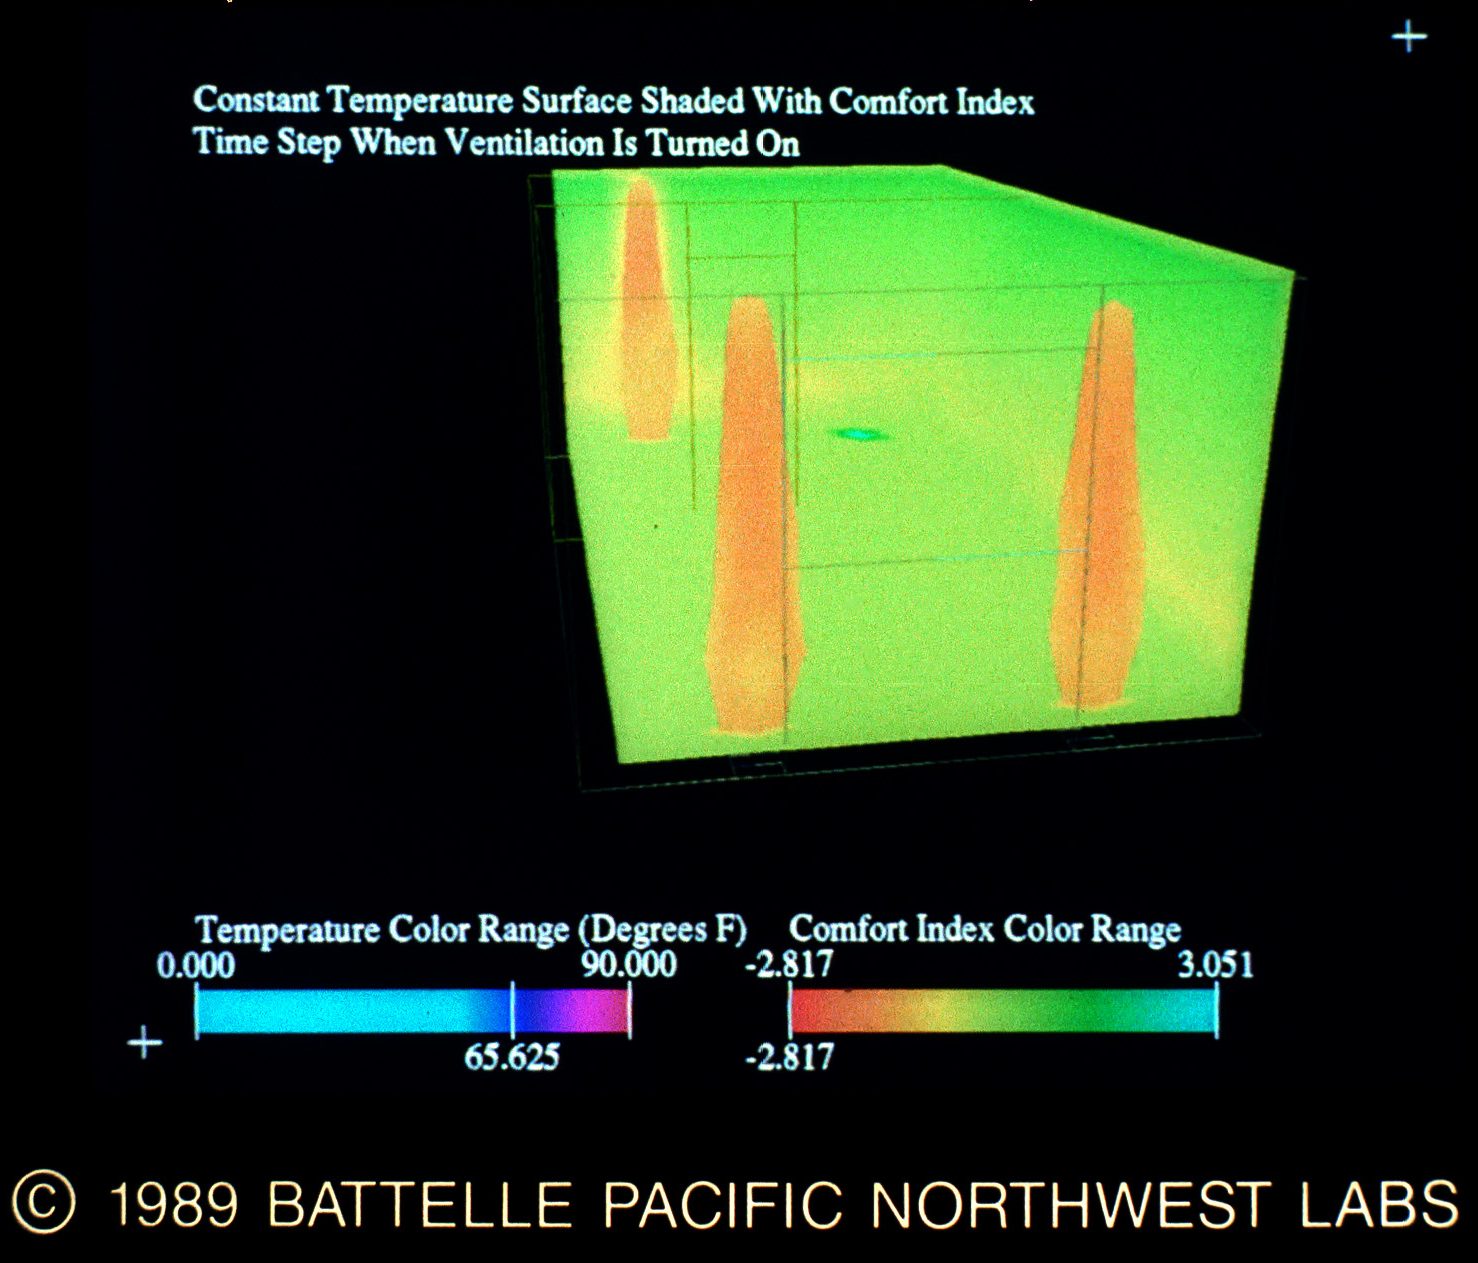
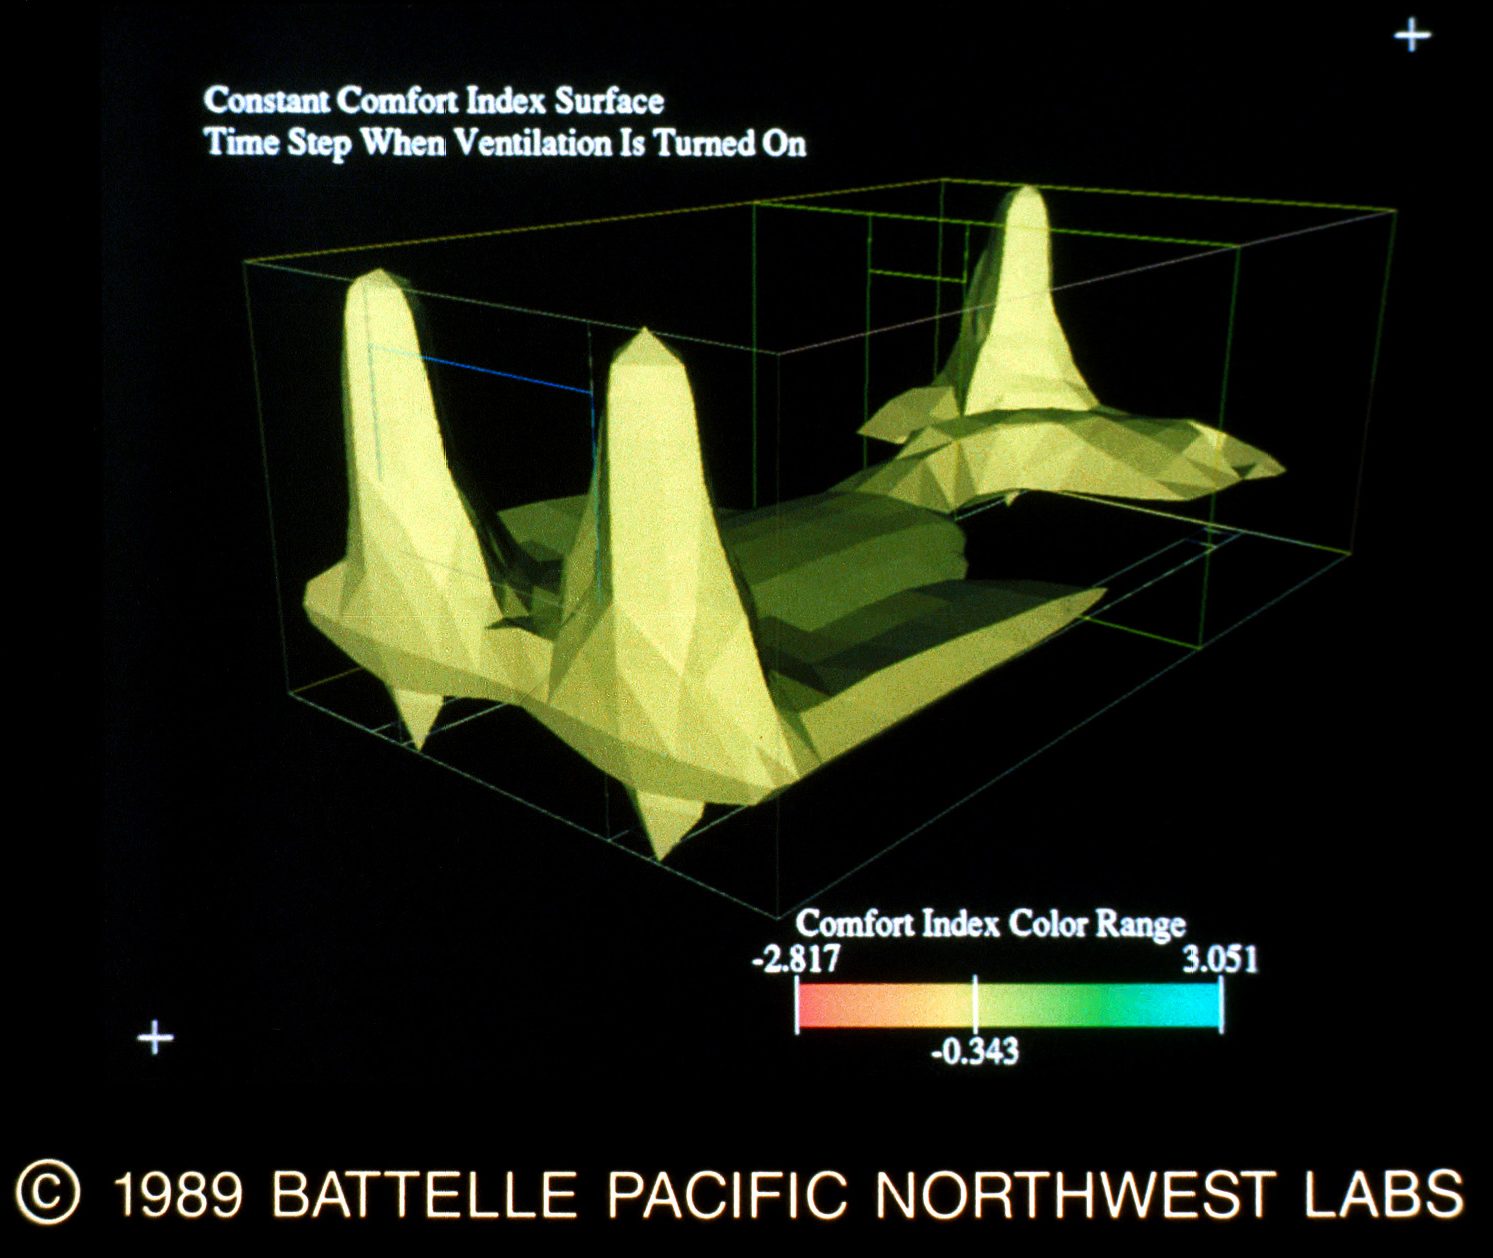
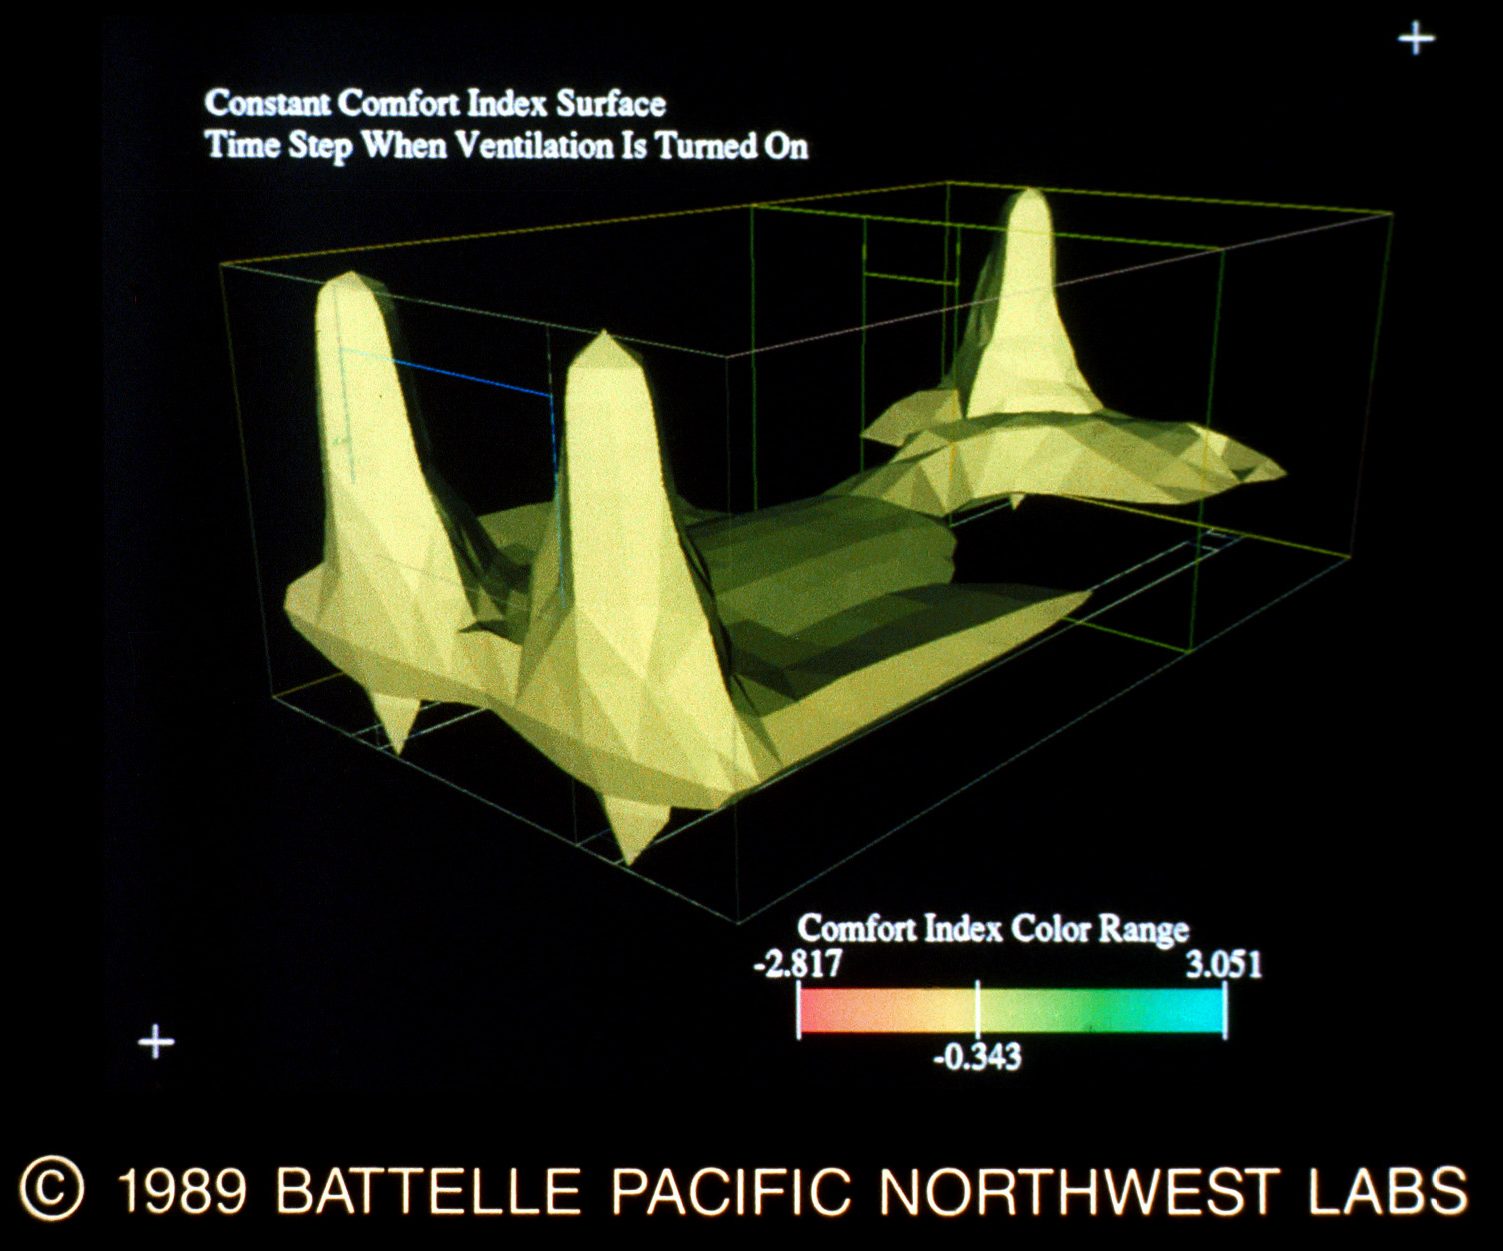
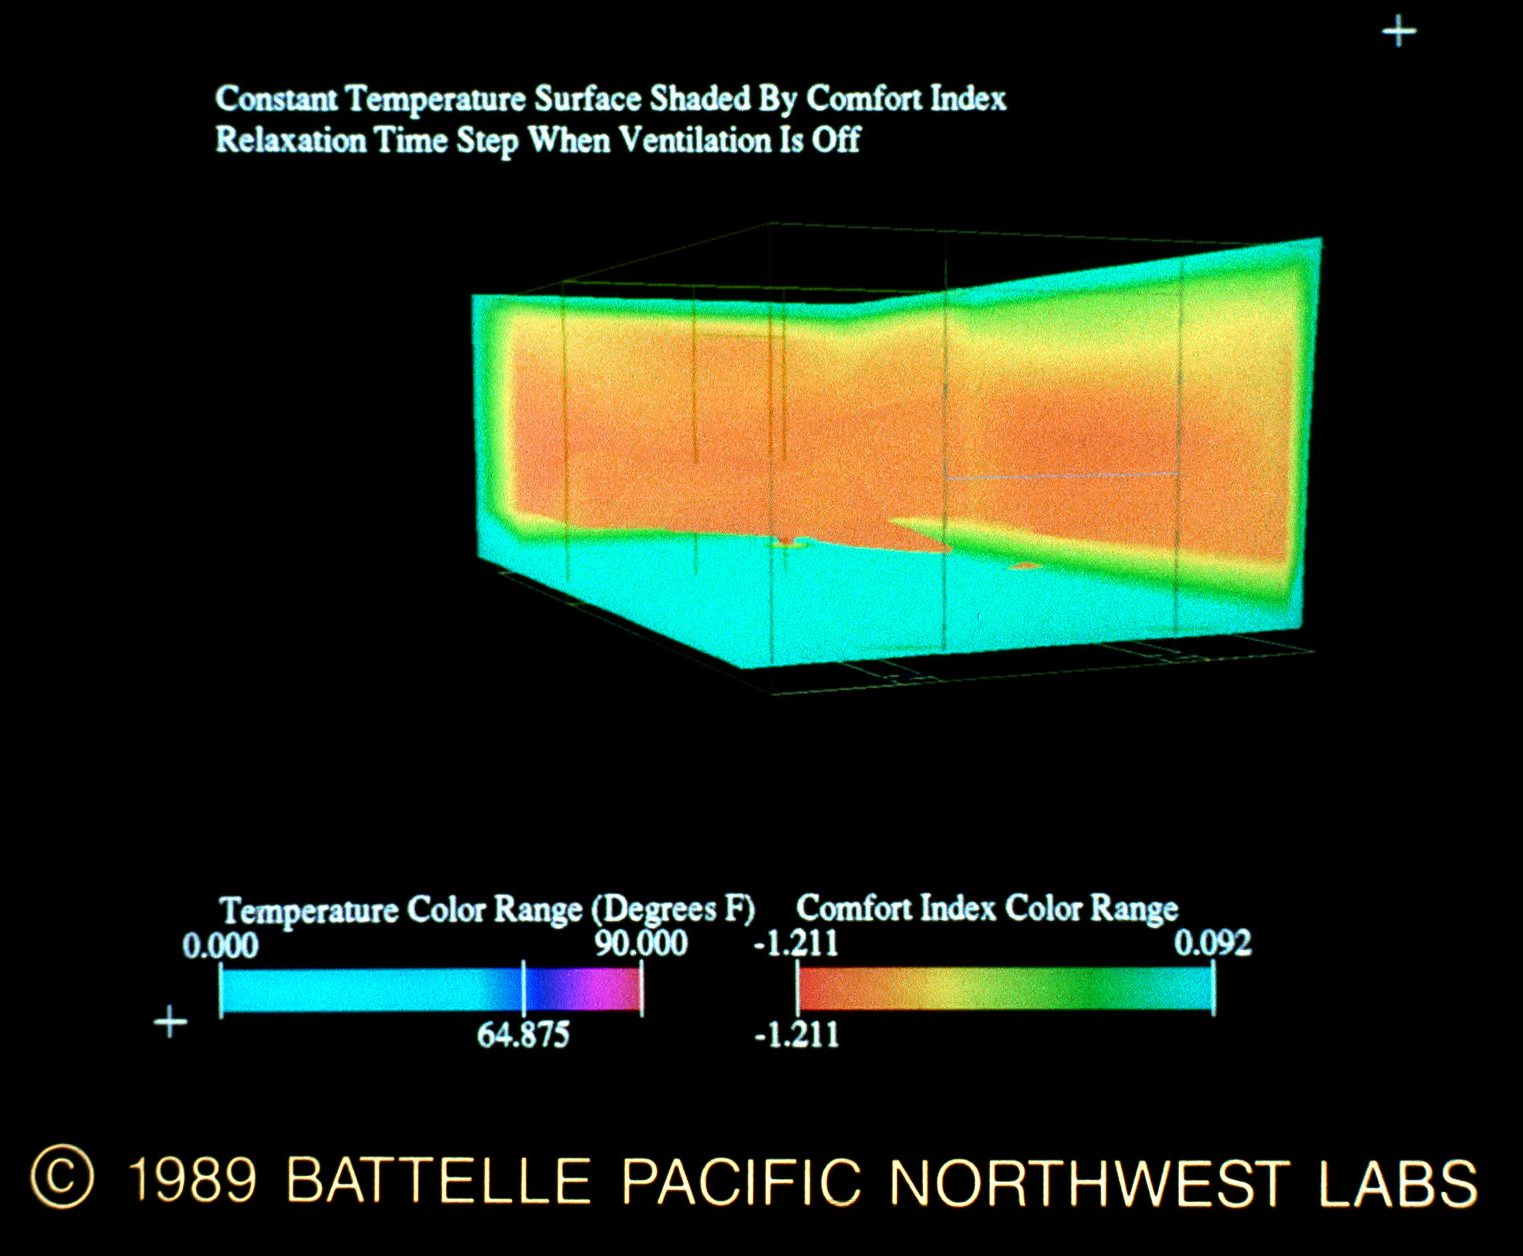
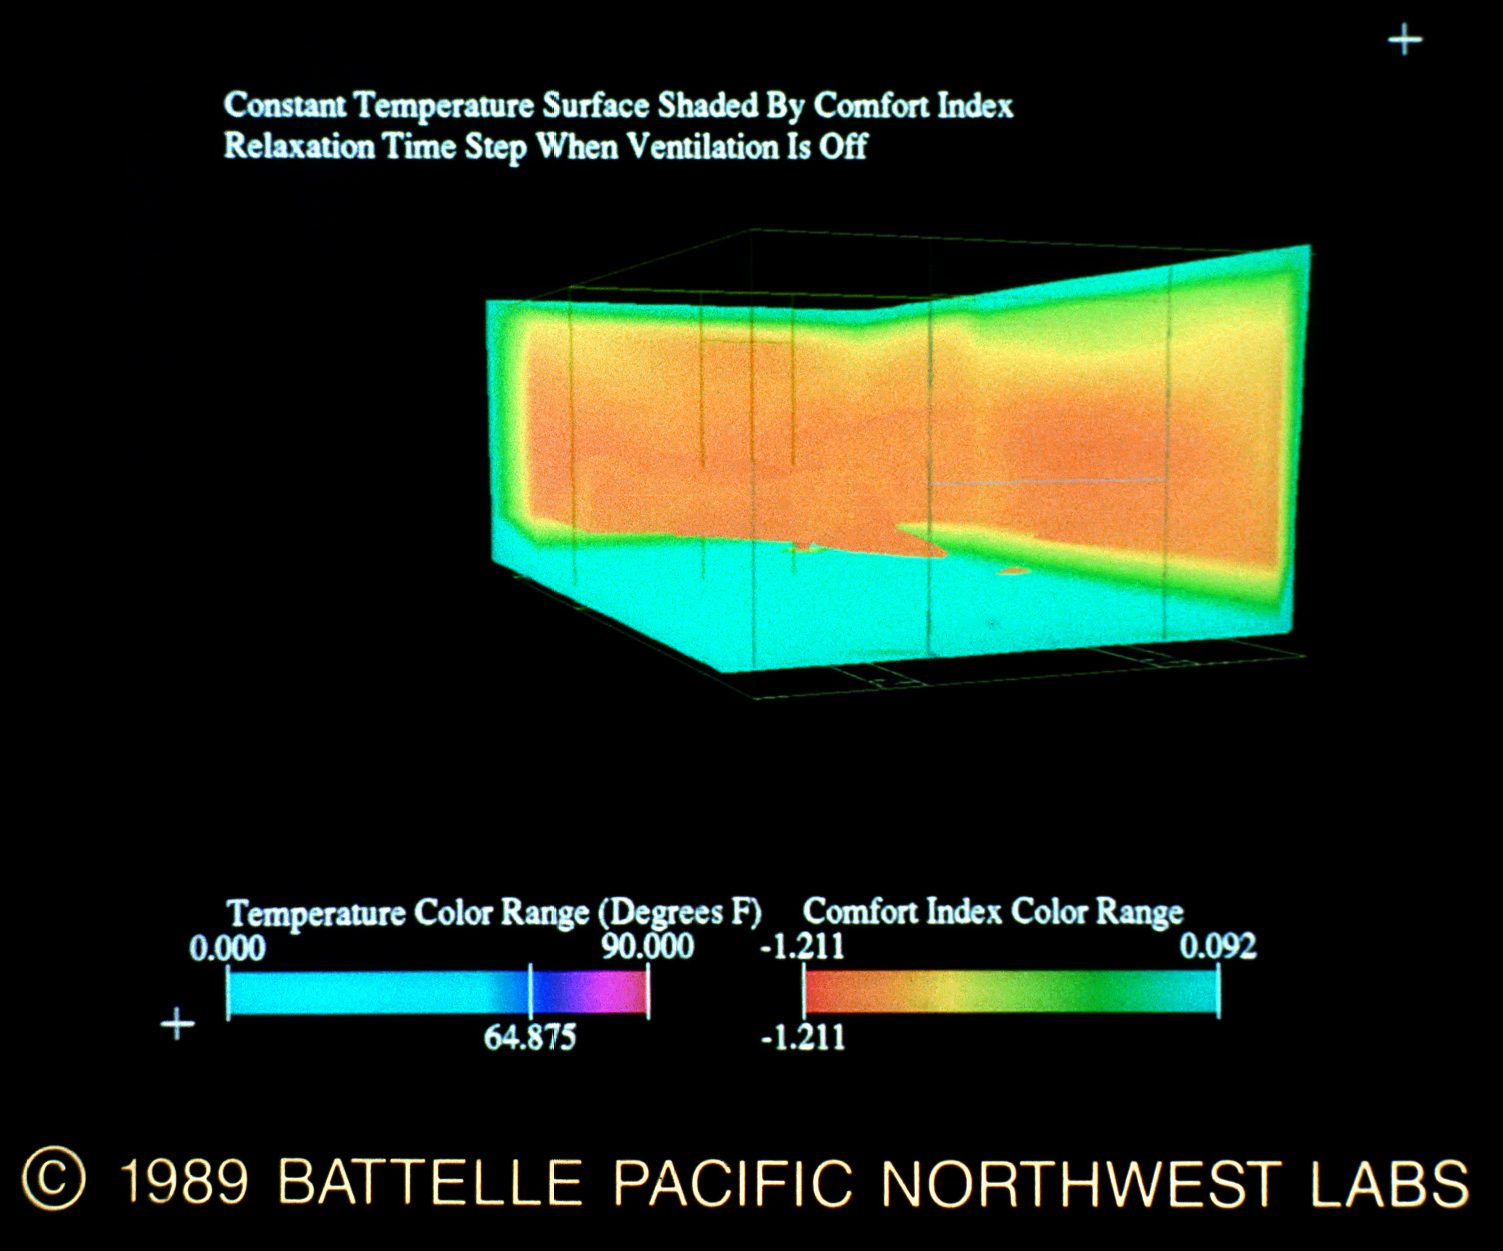
37&38. Untitled by Thomas D. Desmarais. This is an image taken from the output of a ventilation simulation for a two-room building. The building was modeled with a window on the front wall, three inlet vents on the floor, an outlet vent on the floor and a dividing wall with a thermostat controlling the state of the vent output. The ceiling, front and left walls are on the sunny side, while the floor and the other two walls are in the shade. The dimensions of the computational grid are 14 x 12 x 22 and flow velocity, temperature and a measure called comfort index were computed for each node. All slides were rendered on a Silicon Graphics 4D/60T workstation and imaged on a Matrix camera. Contact: Thomas D. Desmarais, Battelle Pacific Northwest Laboratories, P. 0. Box 999, Richland, WA 99352, (509) 375-2782, (509) 375-2718 FAX.
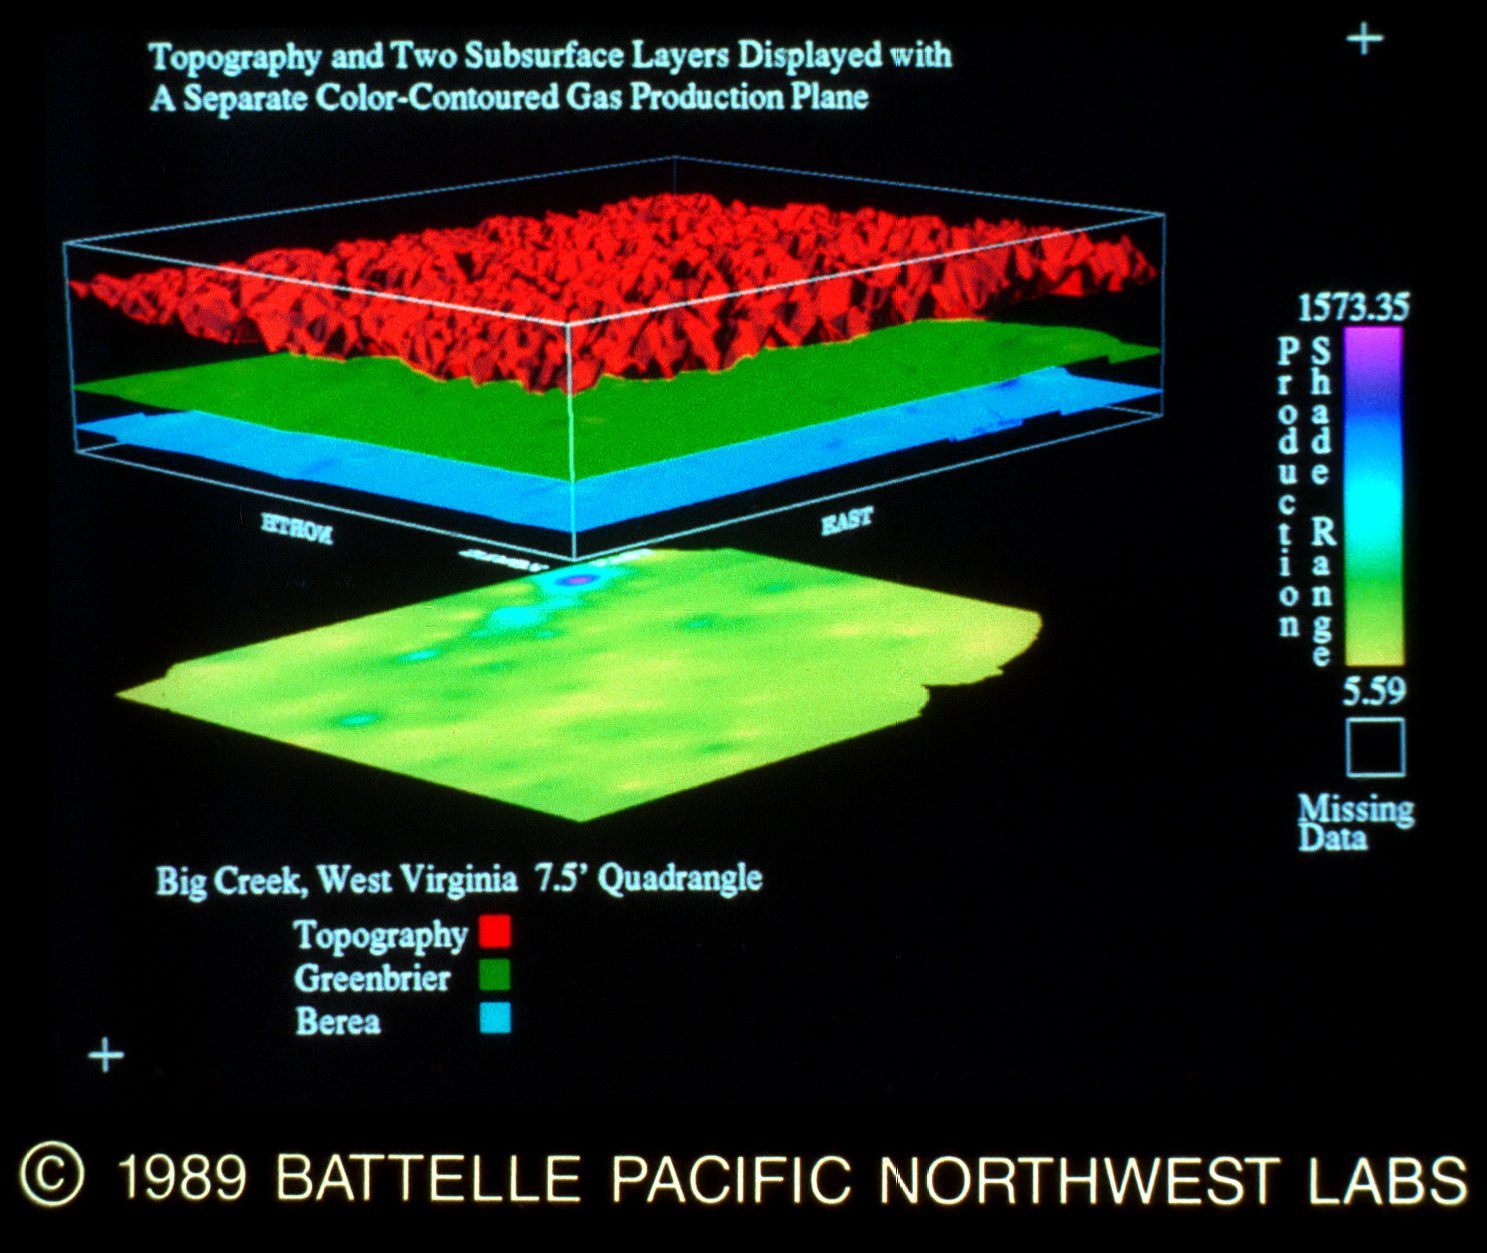
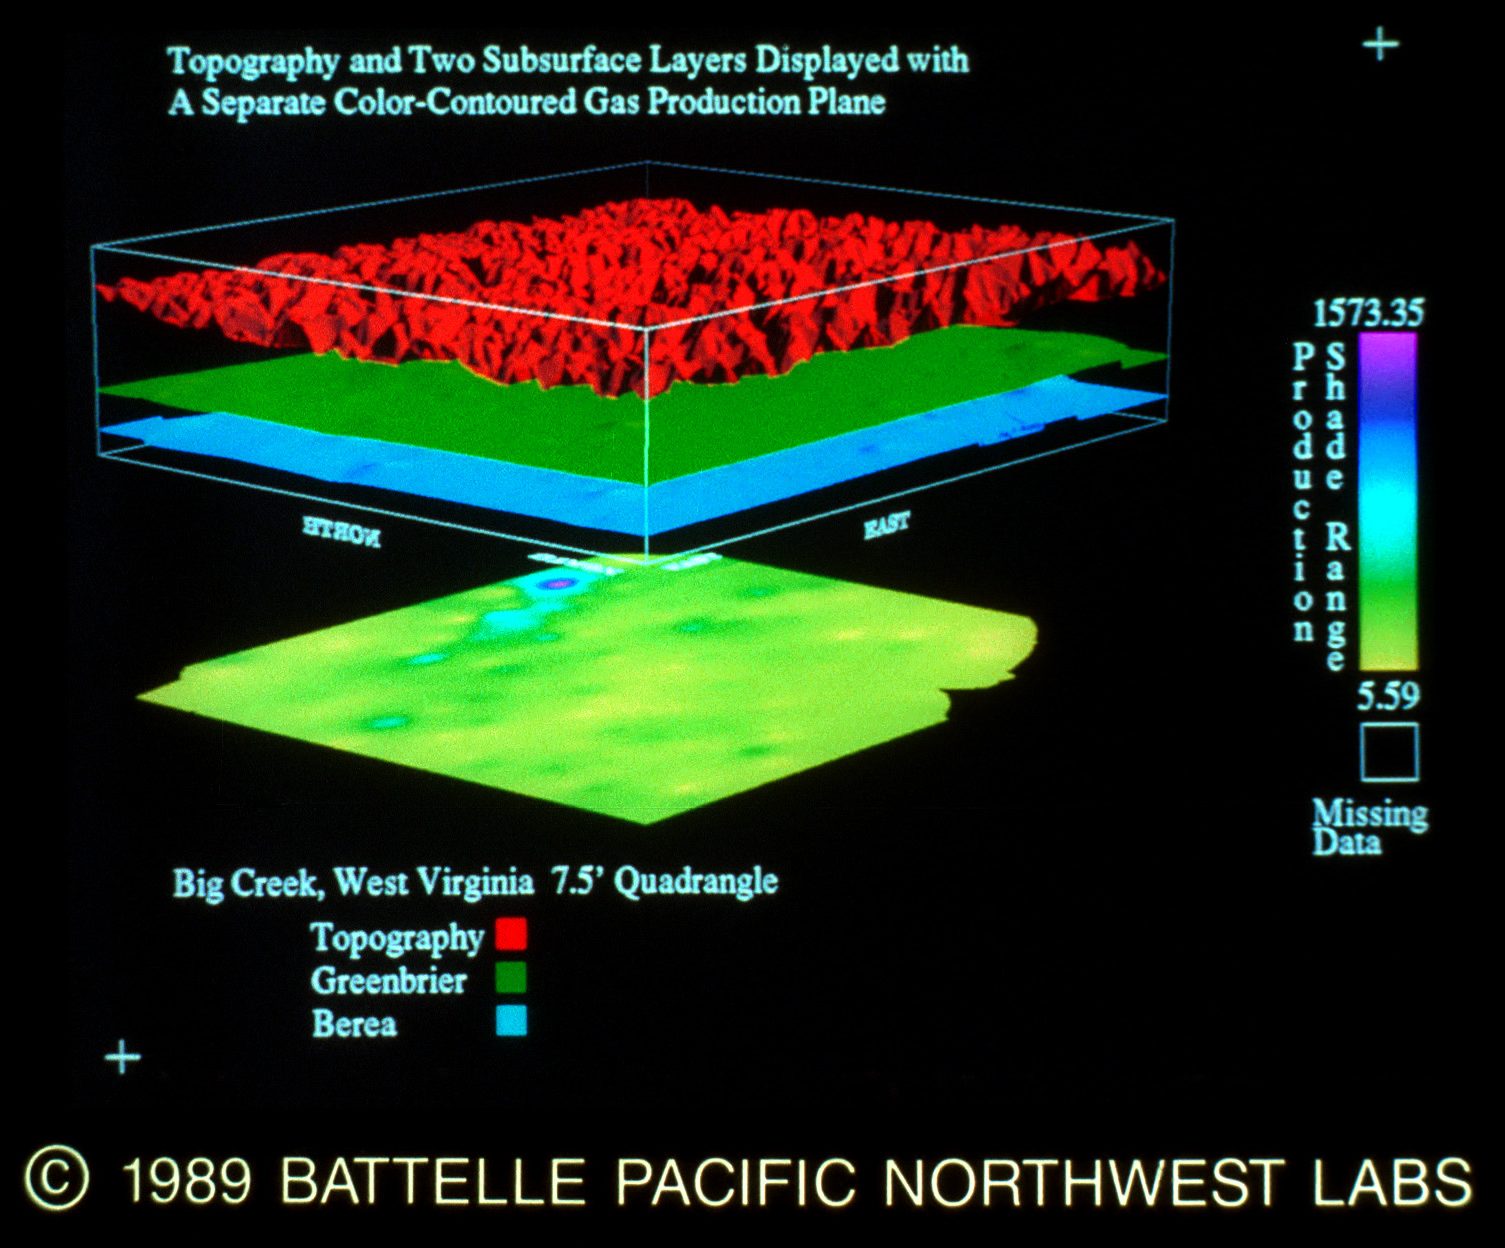
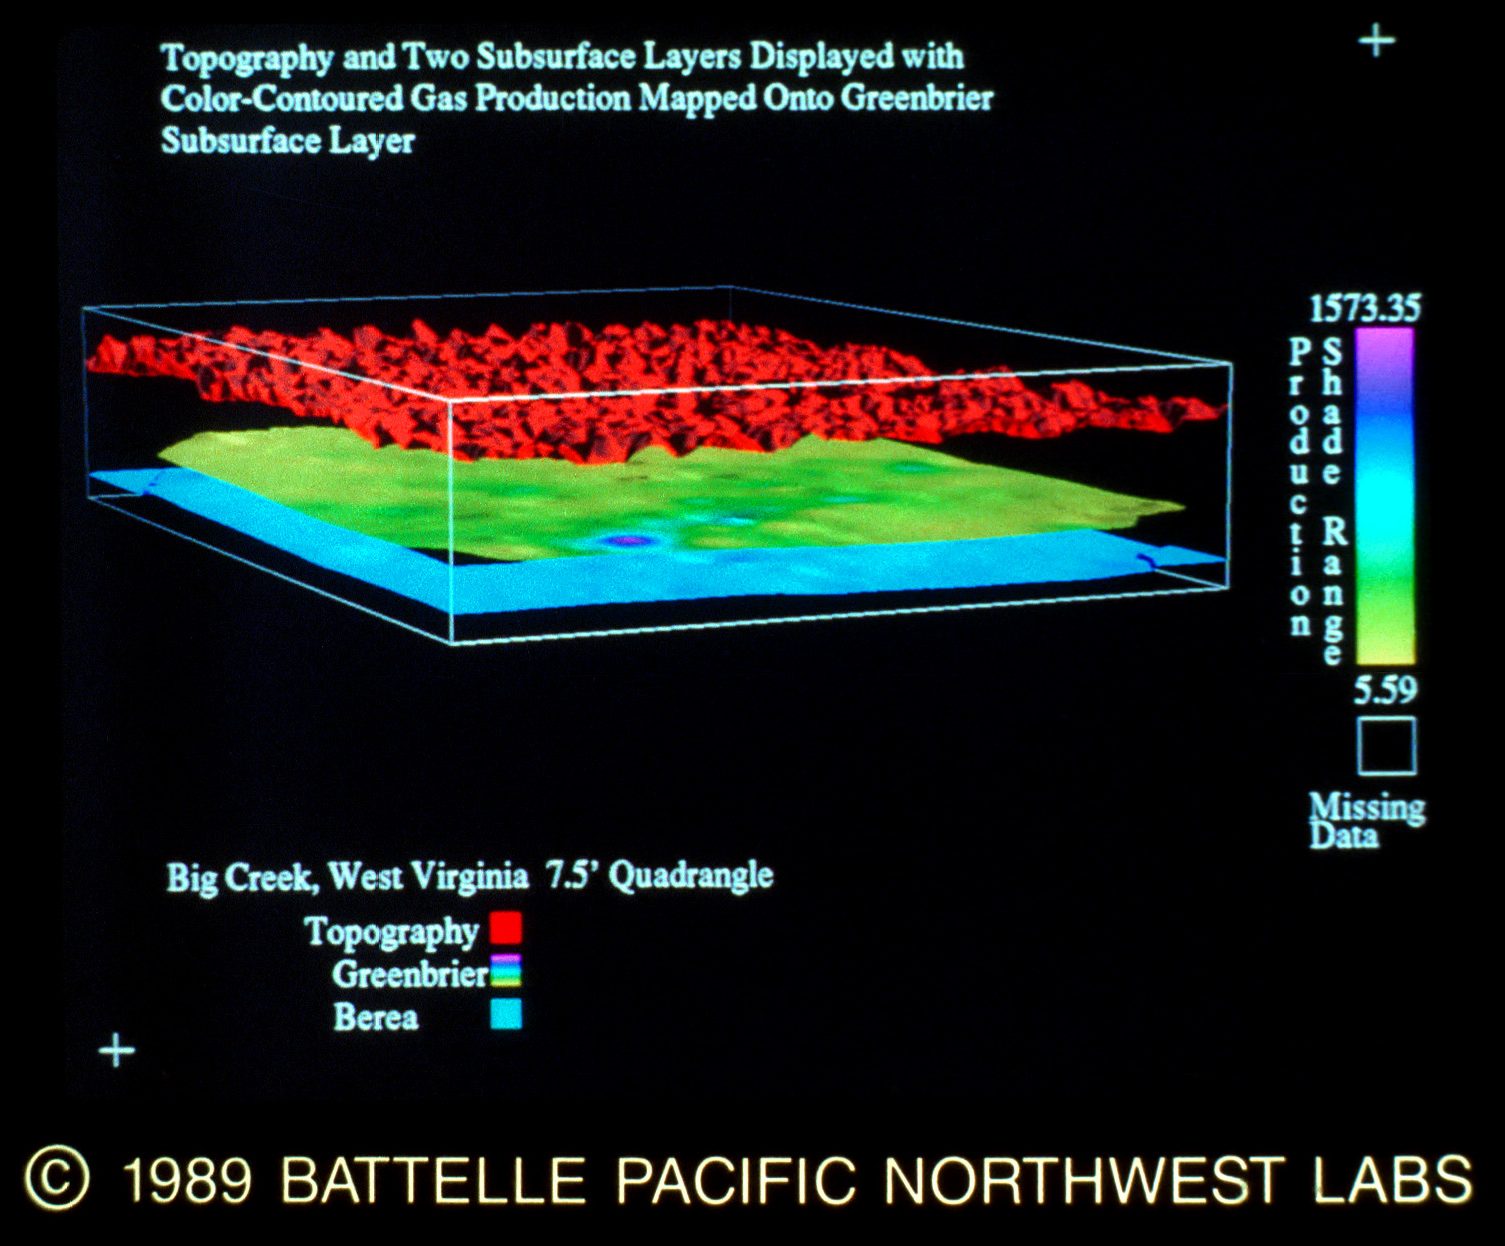
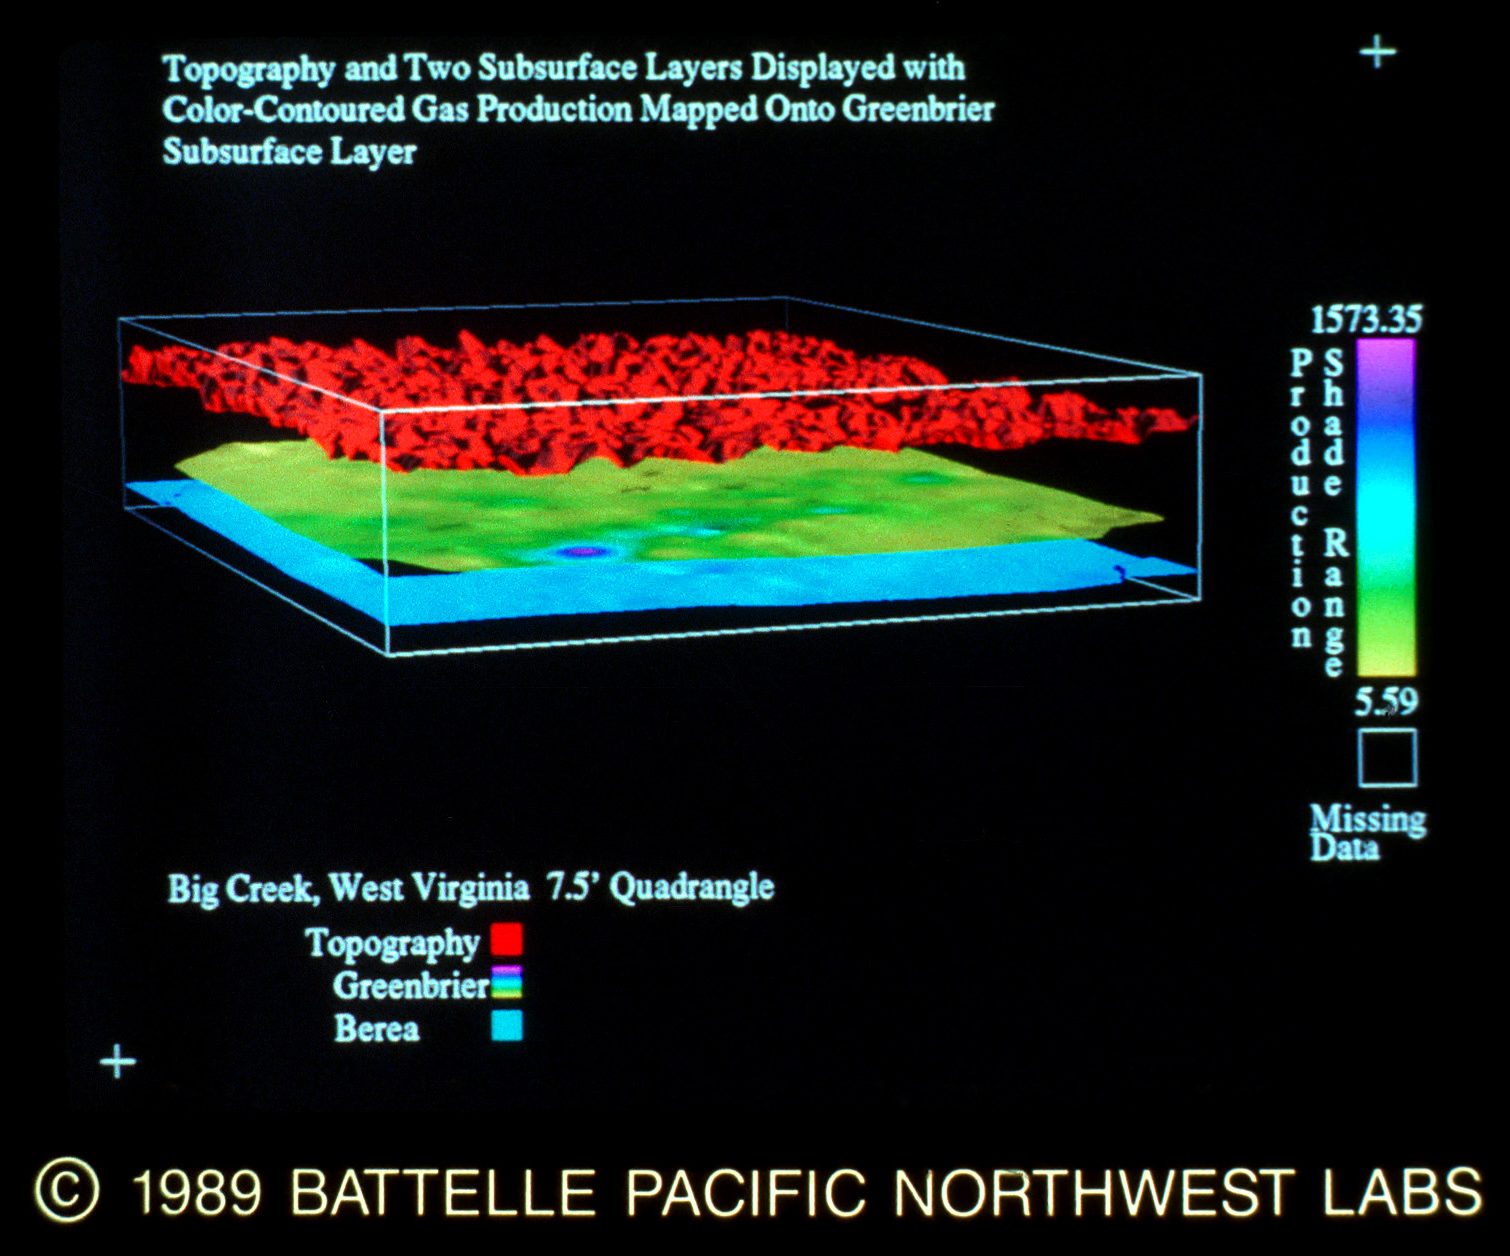
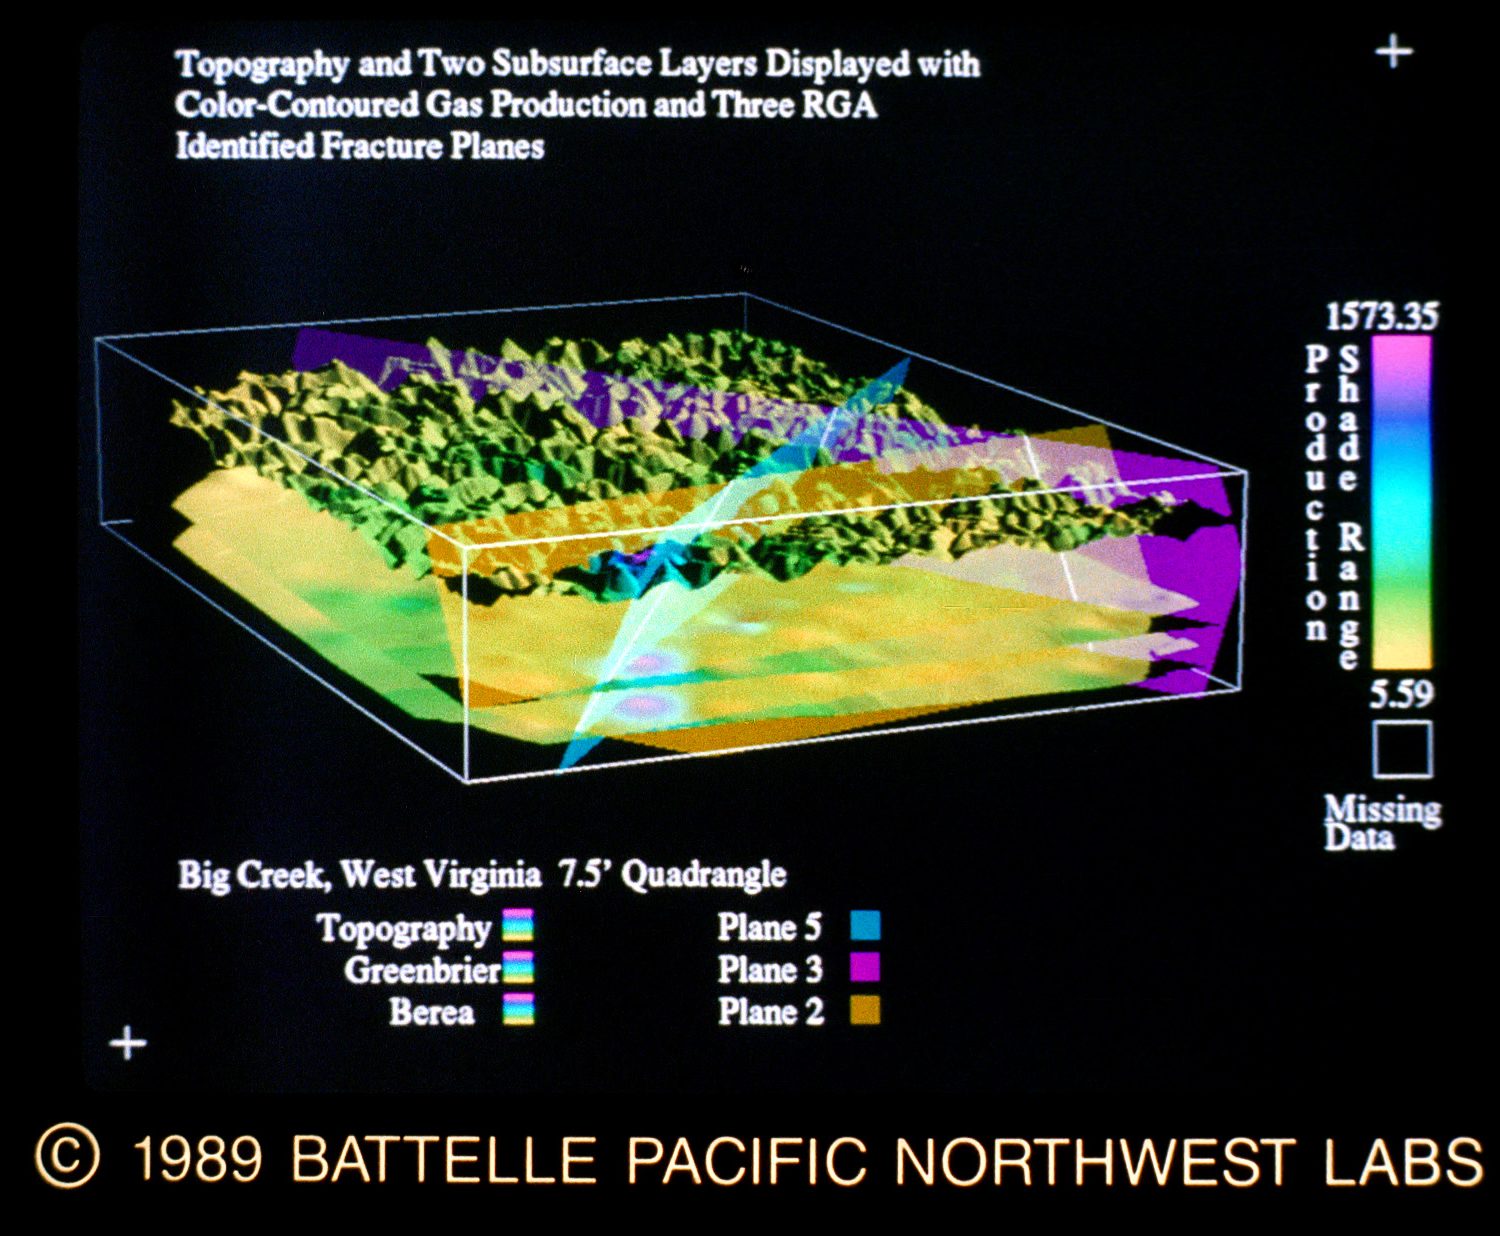
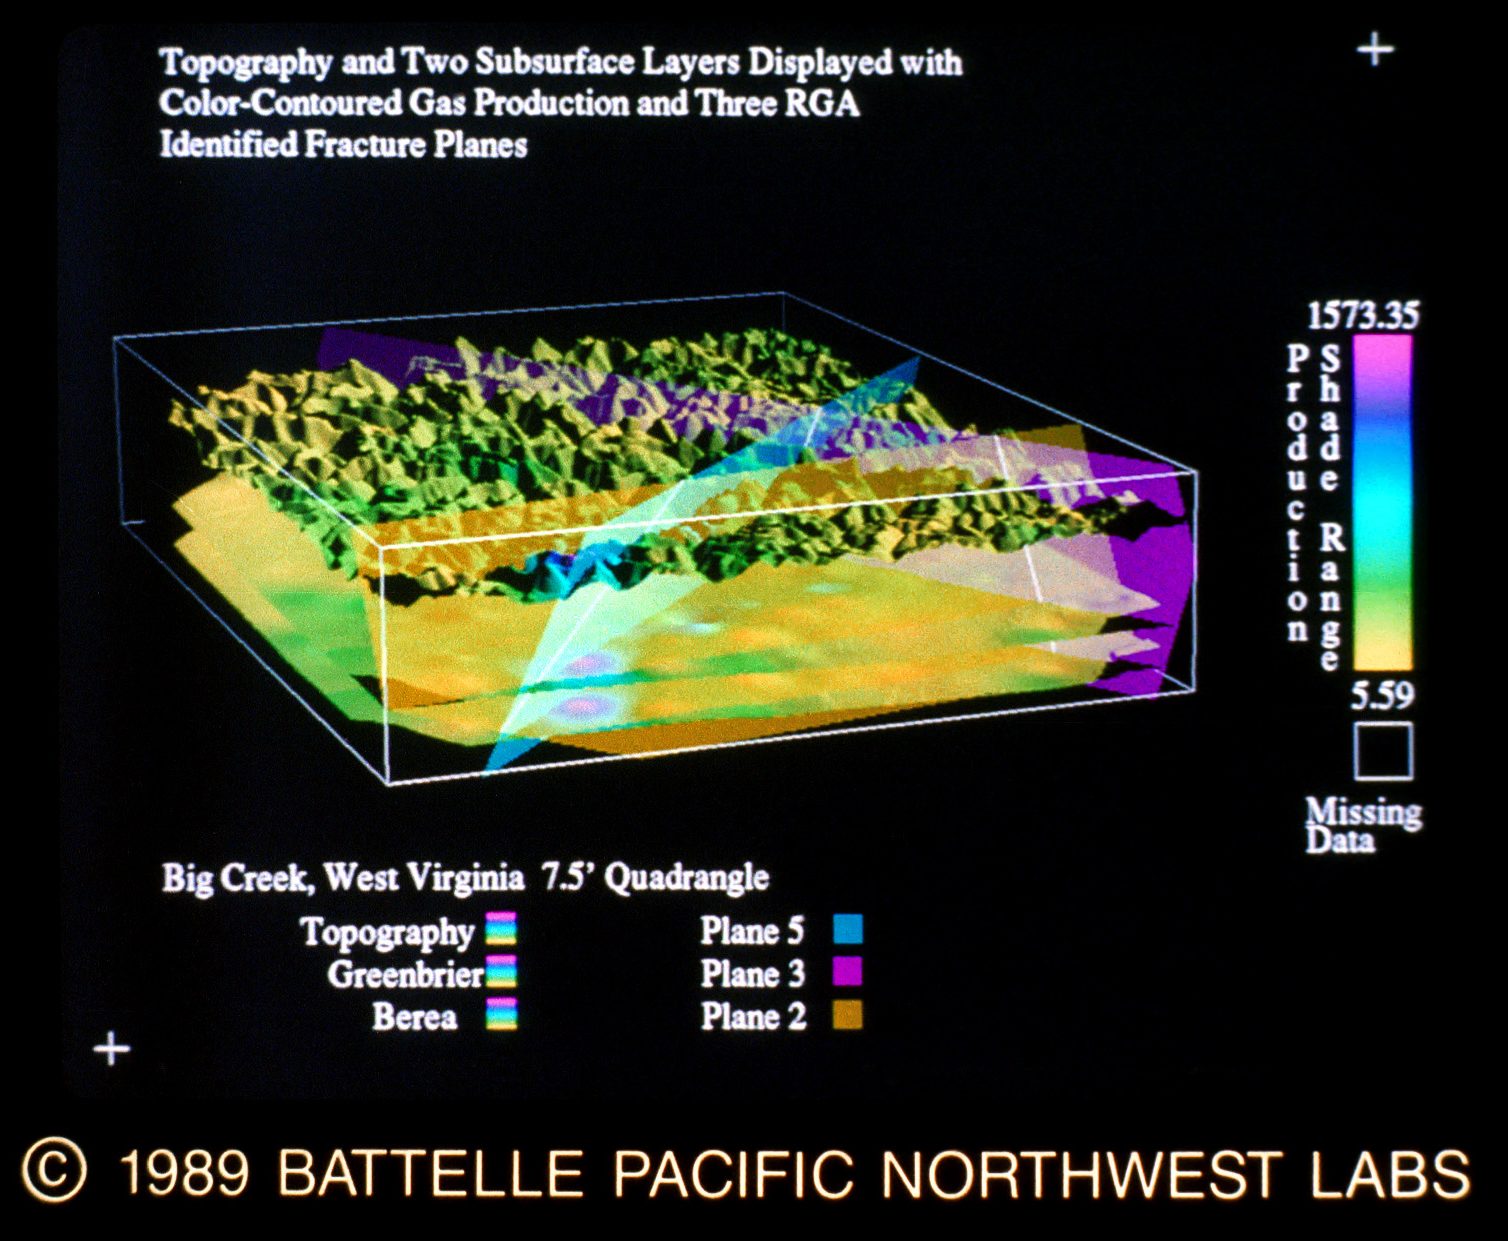
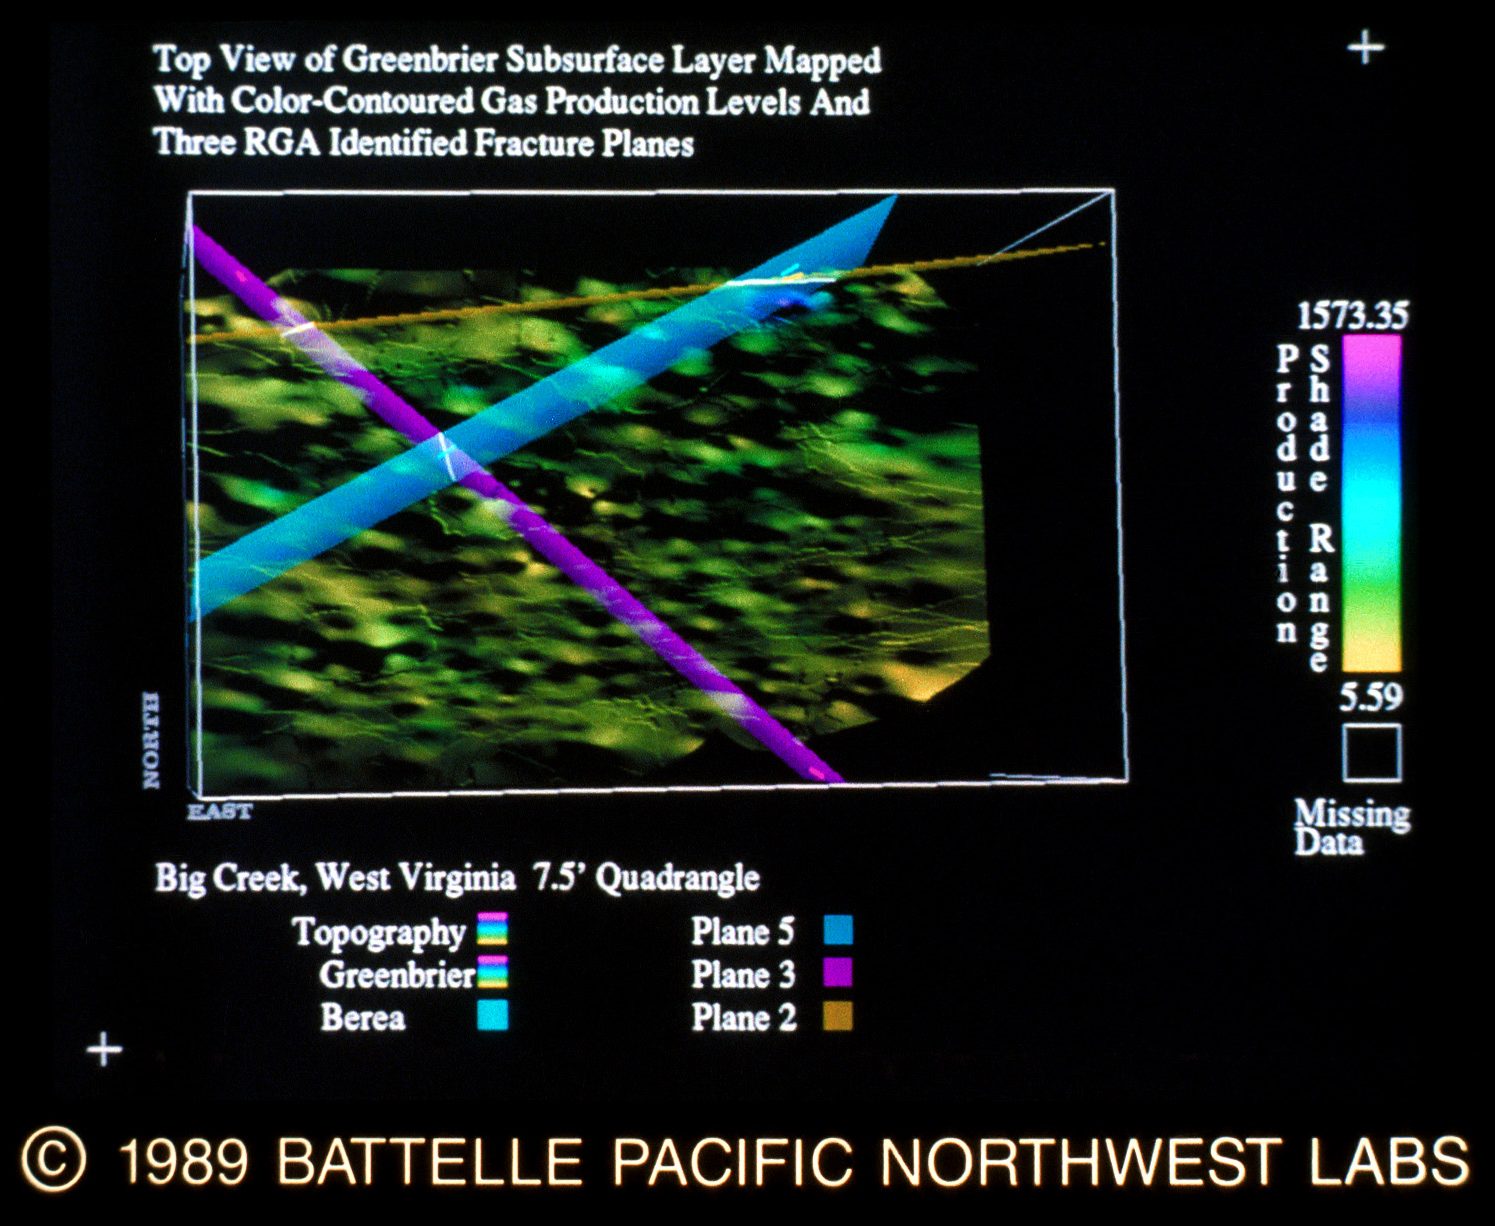
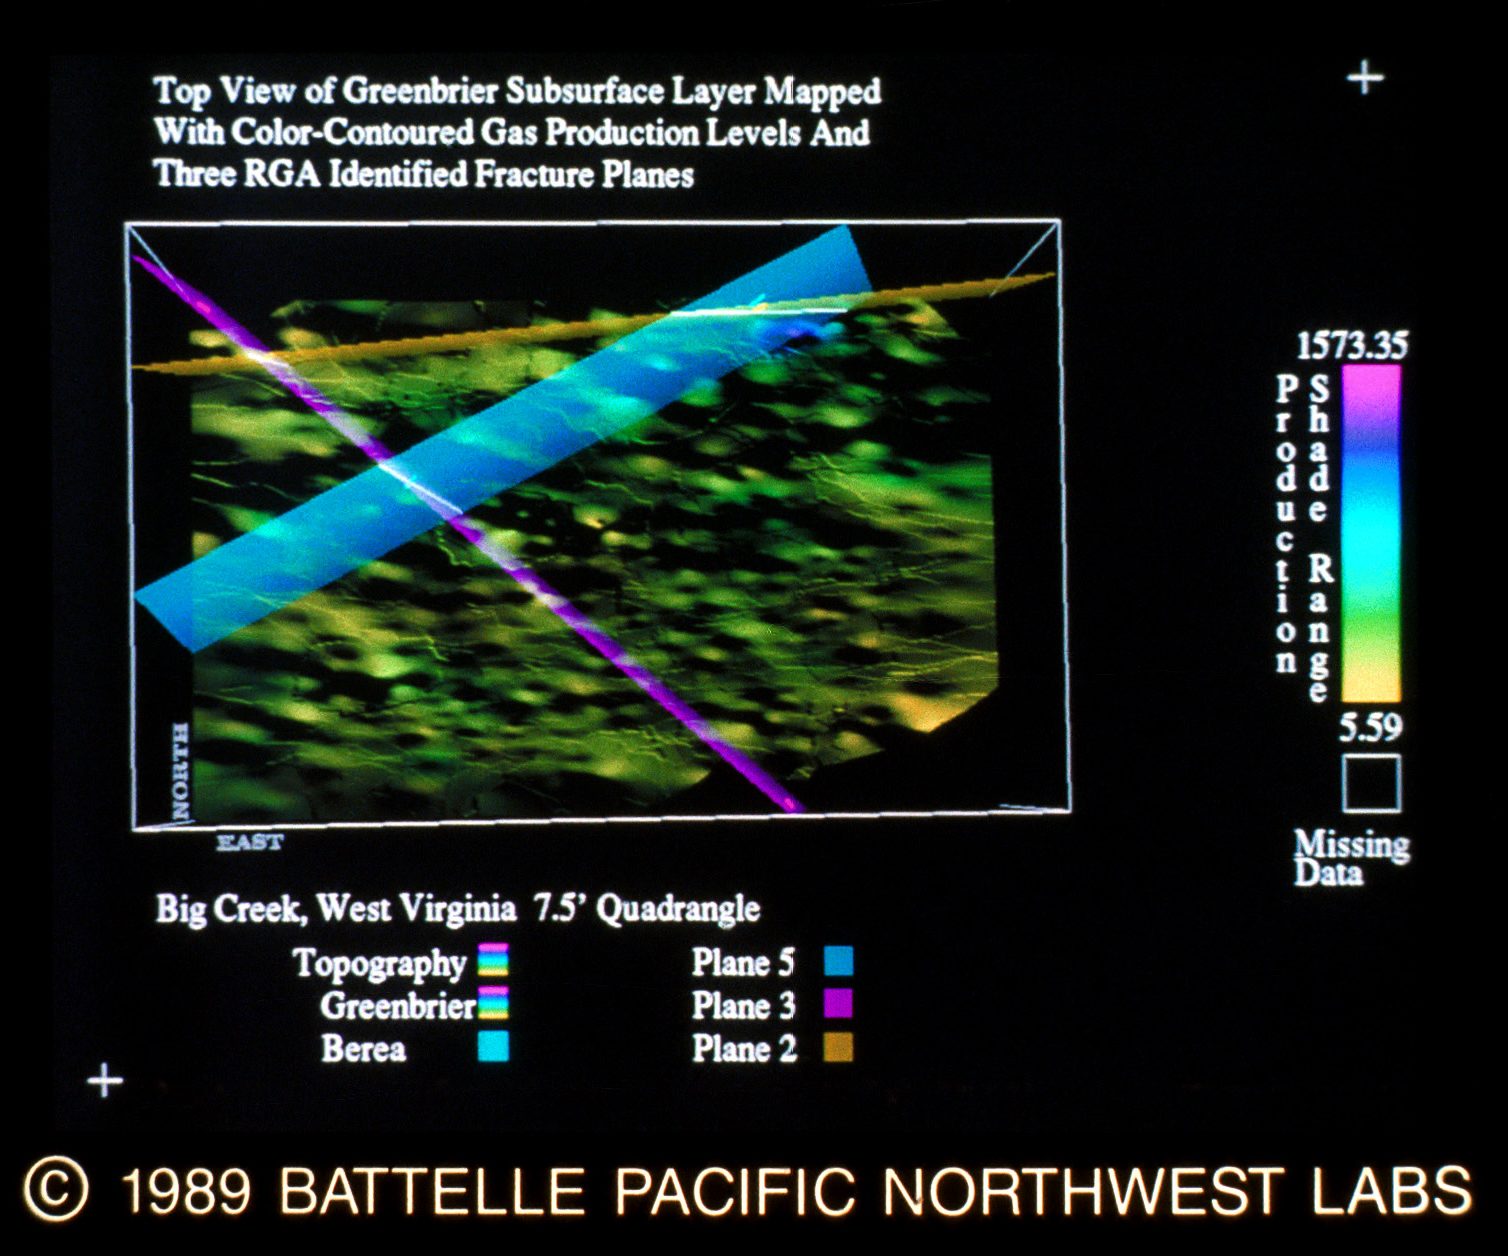
39&40. Untitled by Thomas D. Desmarais. This group of slides is a display of topography generated from elevation data and two subsurface layers generated from core samples. Gas production was also measured at each core site. The core sample data was smoothed and fitted to a 371 x 467 point grid. Surface fault features in the topography were identified and an analysis was made to determine possible fault planes. The intersection of these fault planes is thought to be a likely location for increased gas production. All slides were rendered on a Silicon Graphics 4D/60T workstation and imaged on a Matrix camera. Contact: Thomas D. Desmarais, Battelle Pacific Northwest Laboratories, P. 0. Box 999, Richland, WA 99352, (509) 375-2782, (509) 375-2718 FAX.
41&42. Contact: Thomas D. Desmarais, Battelle Pacific Northwest Laboratories, P. 0. Box 999, Richland, WA 99352, (509) 375-2782, (509) 375-2718 FAX.
43&44. Contact: Thomas D. Desmarais, Battelle Pacific Northwest Laboratories, P. 0. Box 999, Richland, WA 99352, (509) 375-2782, (509) 375-2718 FAX.
45&46. Contact: Thomas D. Desmarais, Battelle Pacific Northwest Laboratories, P. O. Box 999, Richland, WA 99352, (509) 375-2782, (509) 375-2718 FAX.
47&48. Contact: Thomas D. Desmarais, Battelle Pacific Northwest Laboratories, P. O. Box 999, Richland, WA 99352, (509) 375-2782, (509) 375-2718 FAX.
49&50. Contact: Thomas D. Desmarais, Battelle Pacific Northwest Laboratories, P. O. Box 999, Richland, WA 99352, (509) 375-2782, (509) 375-2718 FAX.
51&52. Contact: Thomas D. Desmarais, Battelle Pacific Northwest Laboratories, P. O. Box 999, Richland, WA 99352, (509) 375-2782, (509) 375-2718 FAX.
53&54. Flow Simulation Through the Pennsylvania State Artificial Heart by Stuart Rogers, Sterling Software; Dochan Kwak, NASA Ames Research Center; Cetin Kiris, Stanford University; Laura Rodeman, Stanford University. The code used was INS3D Upwind. Particles are colored by release height. These slides show incompressible viscous flow through a model of the Penn State artificial heart that has been numerically simulated by solving the incompressible Navier-Stokes equations. The fluid properties used in the calculation are that of a water-glycerin solution which is used by experimentalist to simulate blood. The Reynolds number is 500 based on the average inflow velocity and the piston displacement length. The flow rate is 2 litres per minute. The video sequence shows particle traces colored by the height of their starting positions which are periodically released at the inflow valve. The flow calculations were performed on a Cray-2 supercomputer. The images were created and displayed on a Silicon Graphics Iris 3130 using GAS (Graphics Animation System). Slides were taken with a Focus ImageCorder 4500. Contact: Gordon V. Bancroft, MS 258-1, NASA Ames Research Center, Moffett Field, CA 94035.
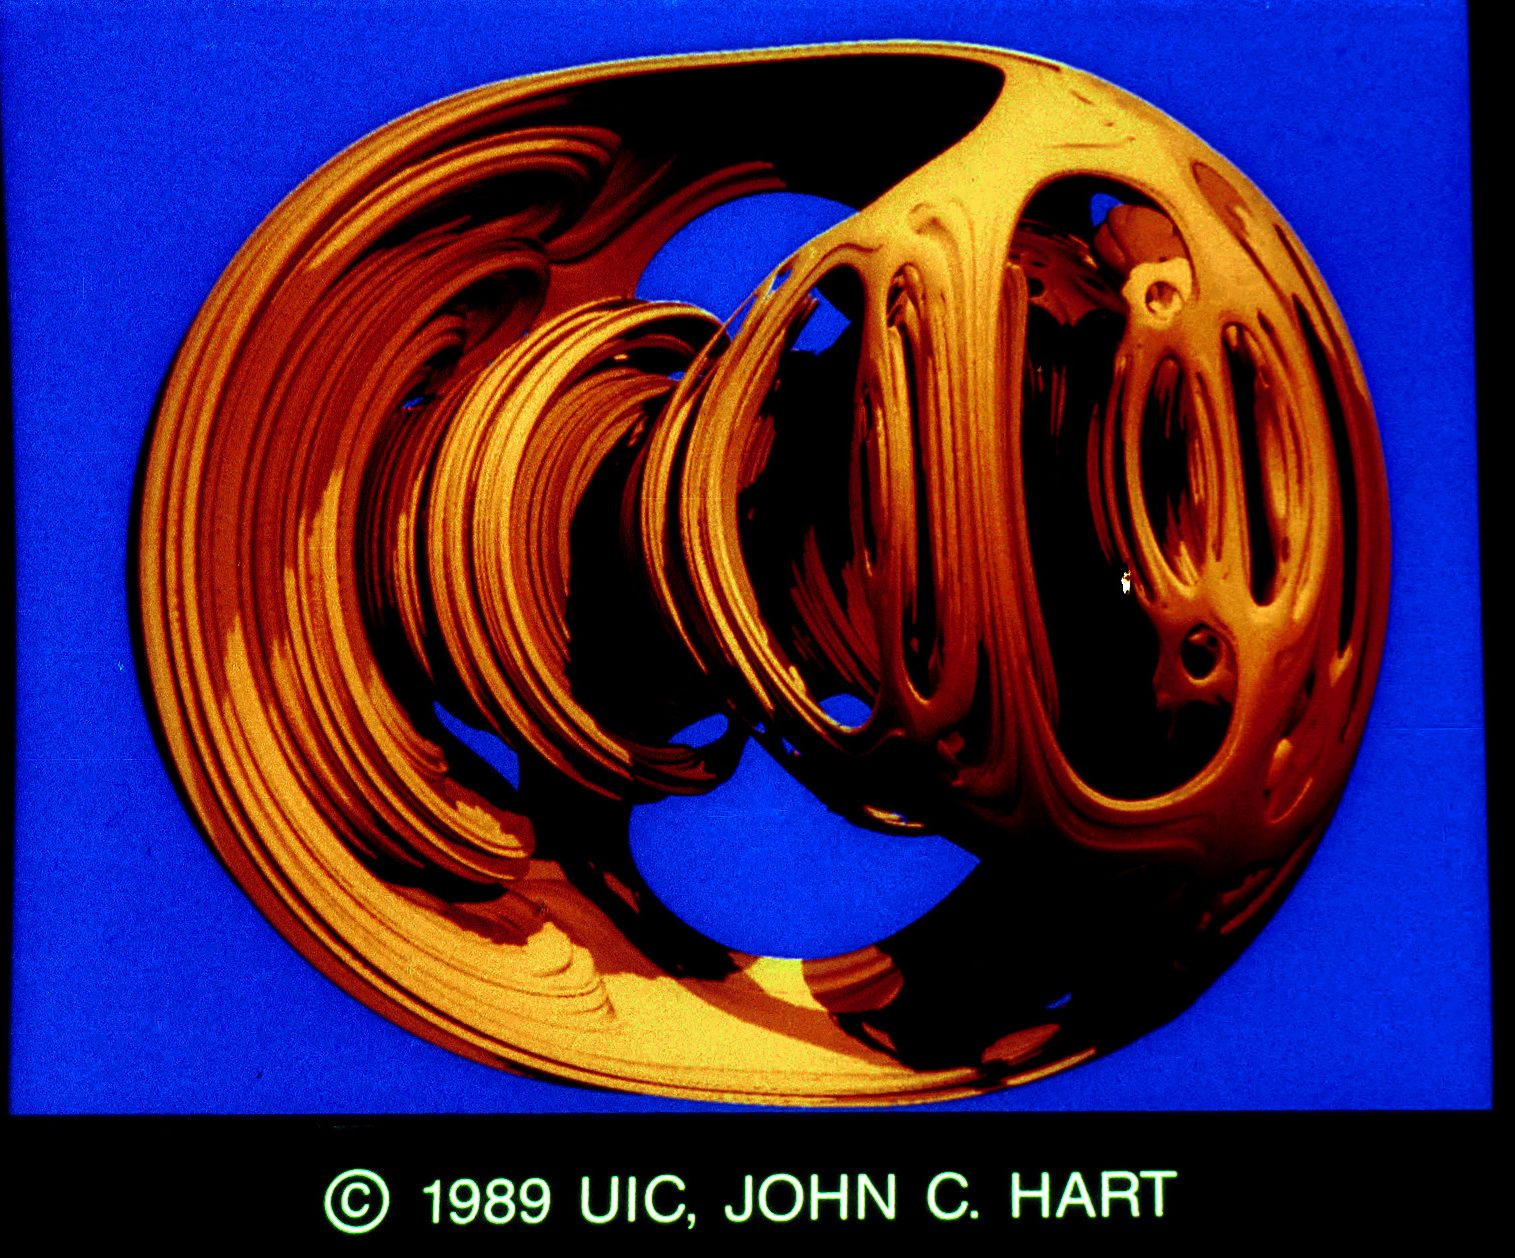
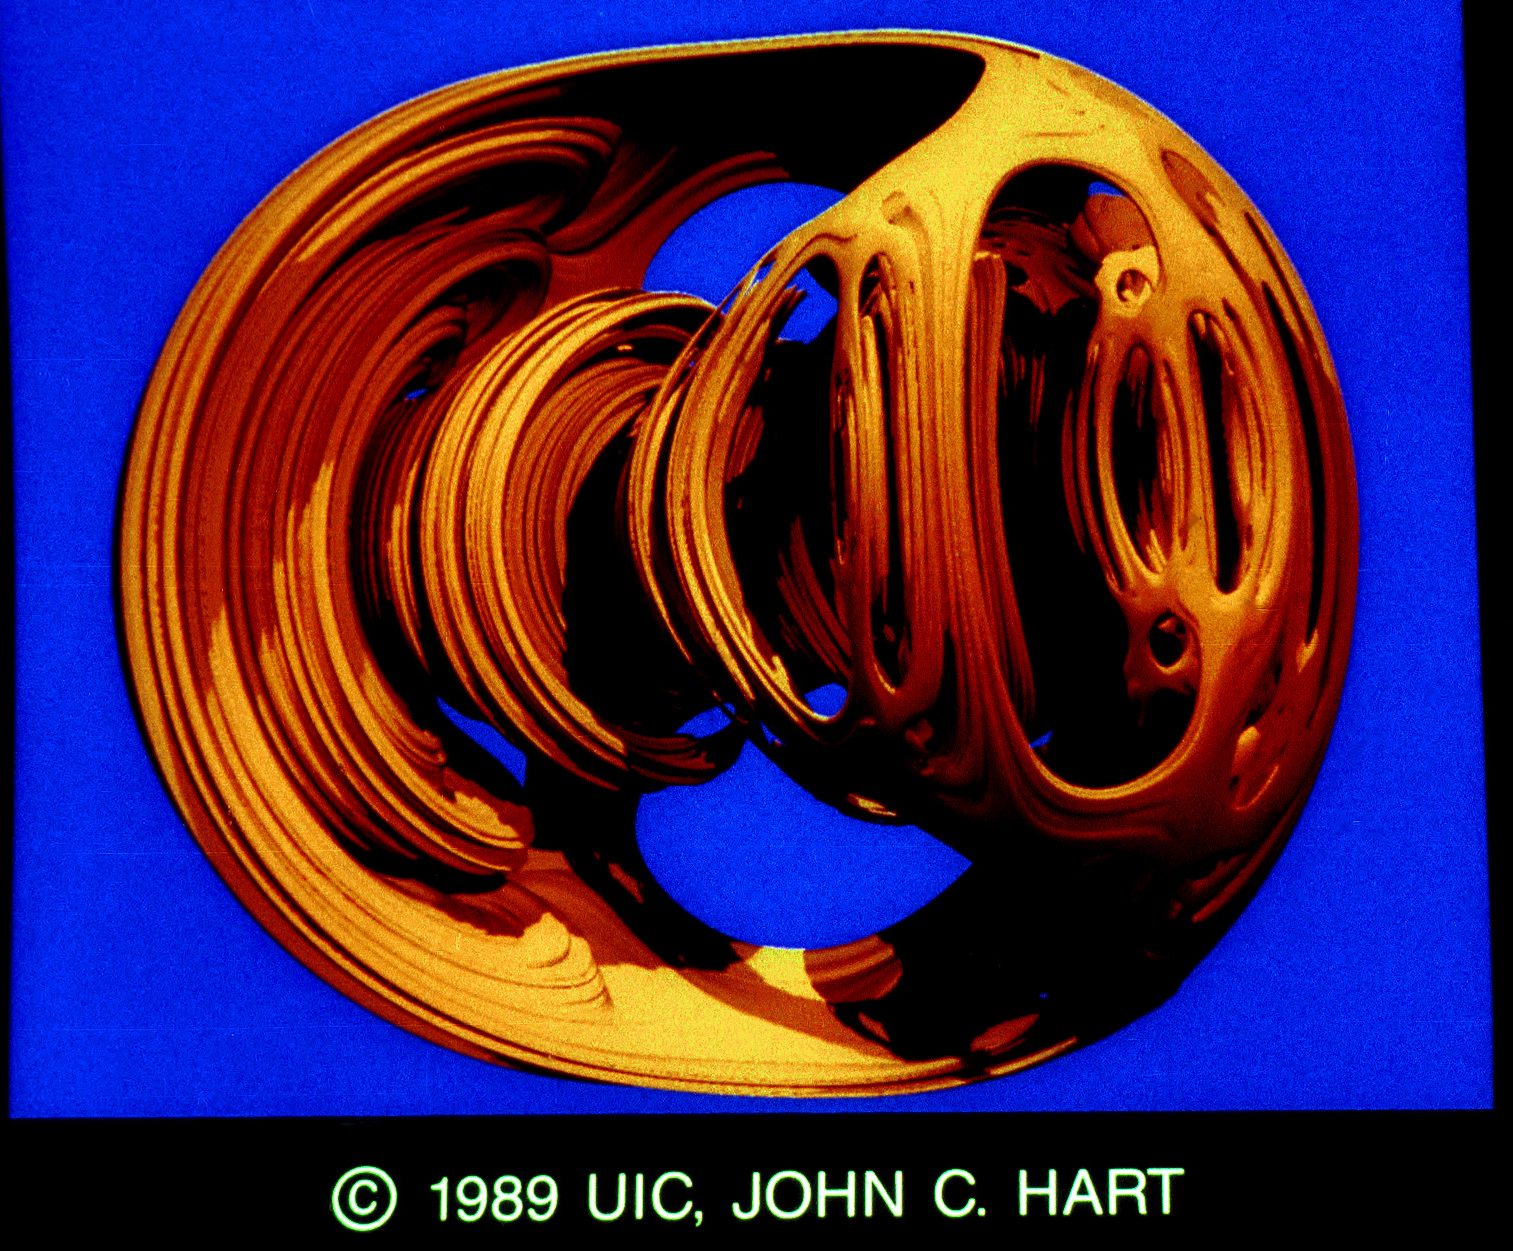
55&56. Quaternion Julia Set by John C. Hart. The stereo pair was made using proprietary ray-tracing software on a 64-processor AT&T Pixel Machine. This is a quaternion Julia set defined by the mapping z>z2 +0.2809+0.53i after a rotation of 60 degrees in the complex plane. Contact: John C. Hart, Electronic Visualization Laboratory, University of Illinois at Chicago, Box 4348 M/C 154, Chicago, IL 60680, (312) 996-3002.
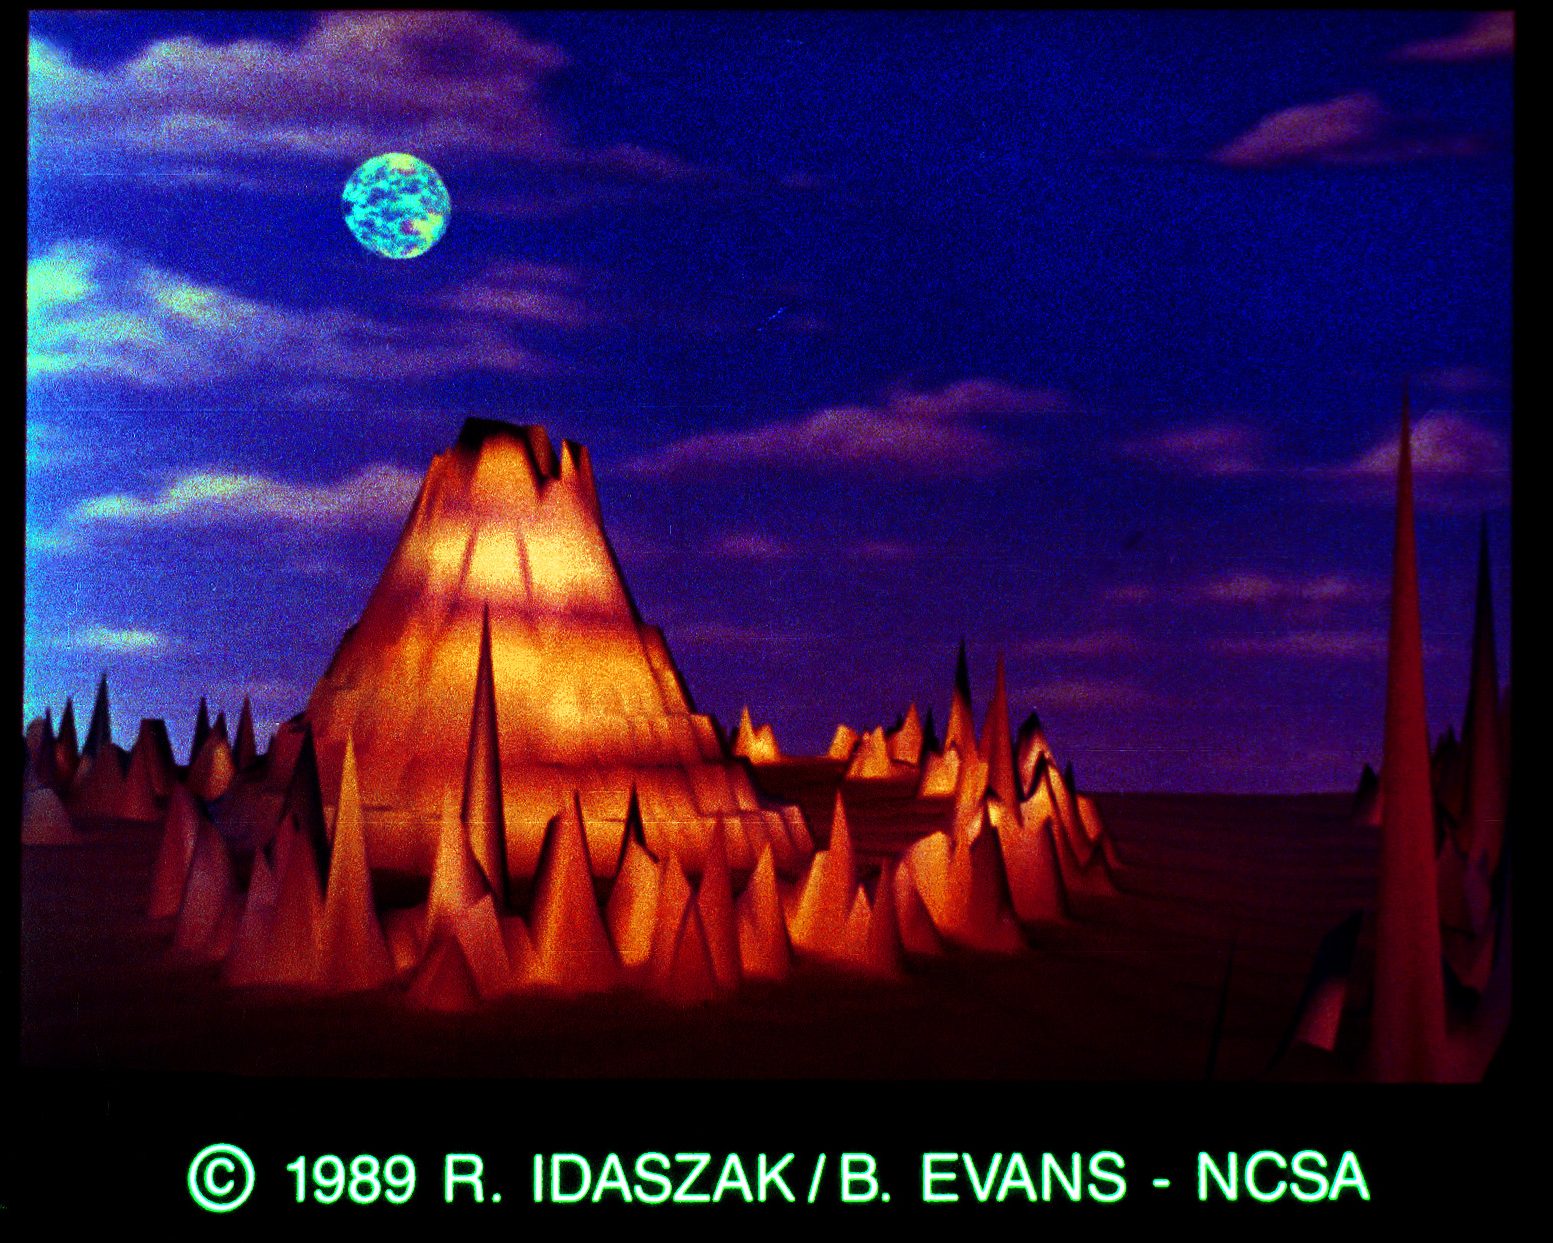
57&58. Fractalscape by R. Idaszak and B. Evans. The fractal landscape depicted here is the result of a visualization tool being applied toward aesthetic data. It originated in the form of bivariate dataset and was processed to produce this 3D representation showing the crosscorrelation of two of the scalar variables from the original computation. The background was added for artistic flare. This image was generated as a stereo pair which upon viewing greatly enhances the dimensionality of the image. Contact: Donna J. Cox, National Center for Supercomputing Applications, 605 East Springfield, Champaign, IL 61820, (217) 224-2005.
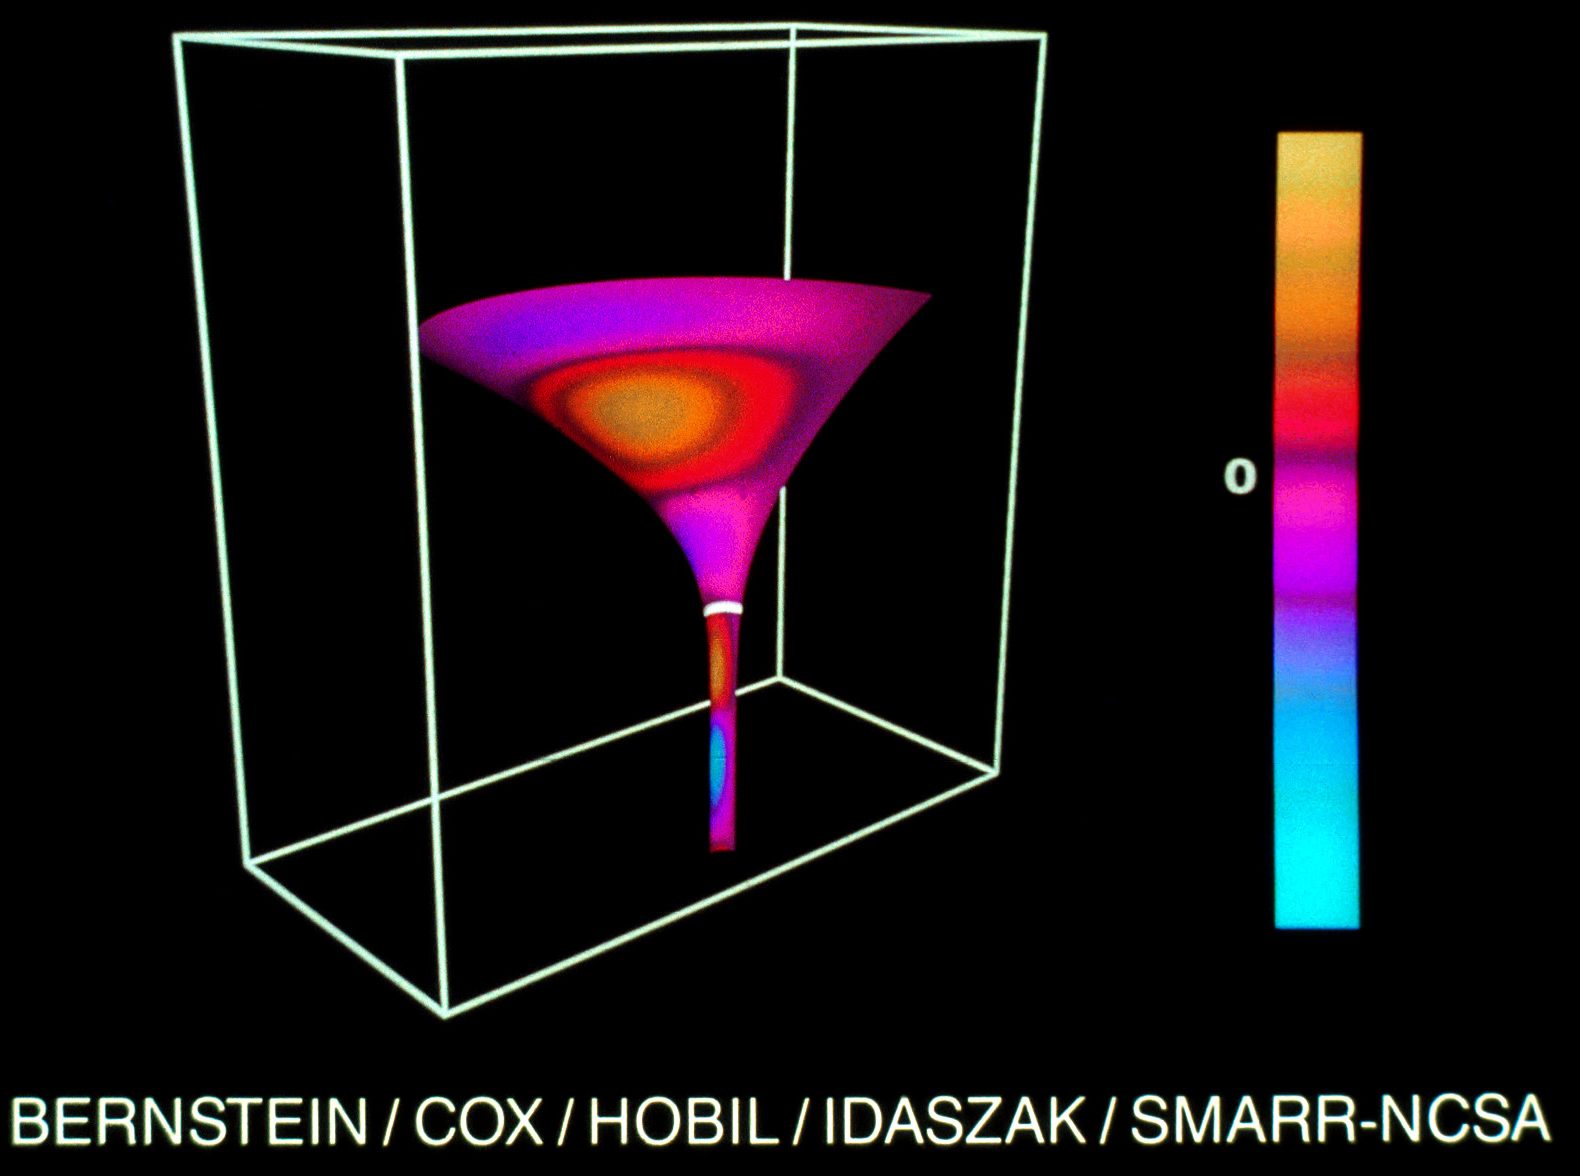
59&60. Interaction of a Gravitational Wave with a Black Hole by David Bernstein, Donna J. Cox, David Hobill, Ray Idaszak and Larry Smarr. In this simulation, a black hole emits gravitational radiation after it has been struck by an incoming gravity wave. The animation shows for the first time the influence of the curved space on the propagation ofthe radiation. Through the use on an isometric embedding diagram, the curvature of the space surrounding the black hole is represented by the surface upon which the waves propagate. The white ring locates the surface of the black hole and the region above (below) the ring represents the exterior (interior) ofthe black hole, respectively. The Cray II supercomputer was used to calculate the numerical relativity simulation. Alliant mini-supercomputer, NCSA home-grown software and Wavefront Technologies were used to post-process scientific data for visualization. Astrophysicists Hobill and Smarr and Bernstein, graduate student, developed Cray II algorithm and worked with Idaszak and Cox, visualization specialists, to create 3-D animation. Contact: Donna J. Cox, National Center for Supercomputing Applications, 605 East Springfield, Champaign, IL 61820, (217) 224-2005.
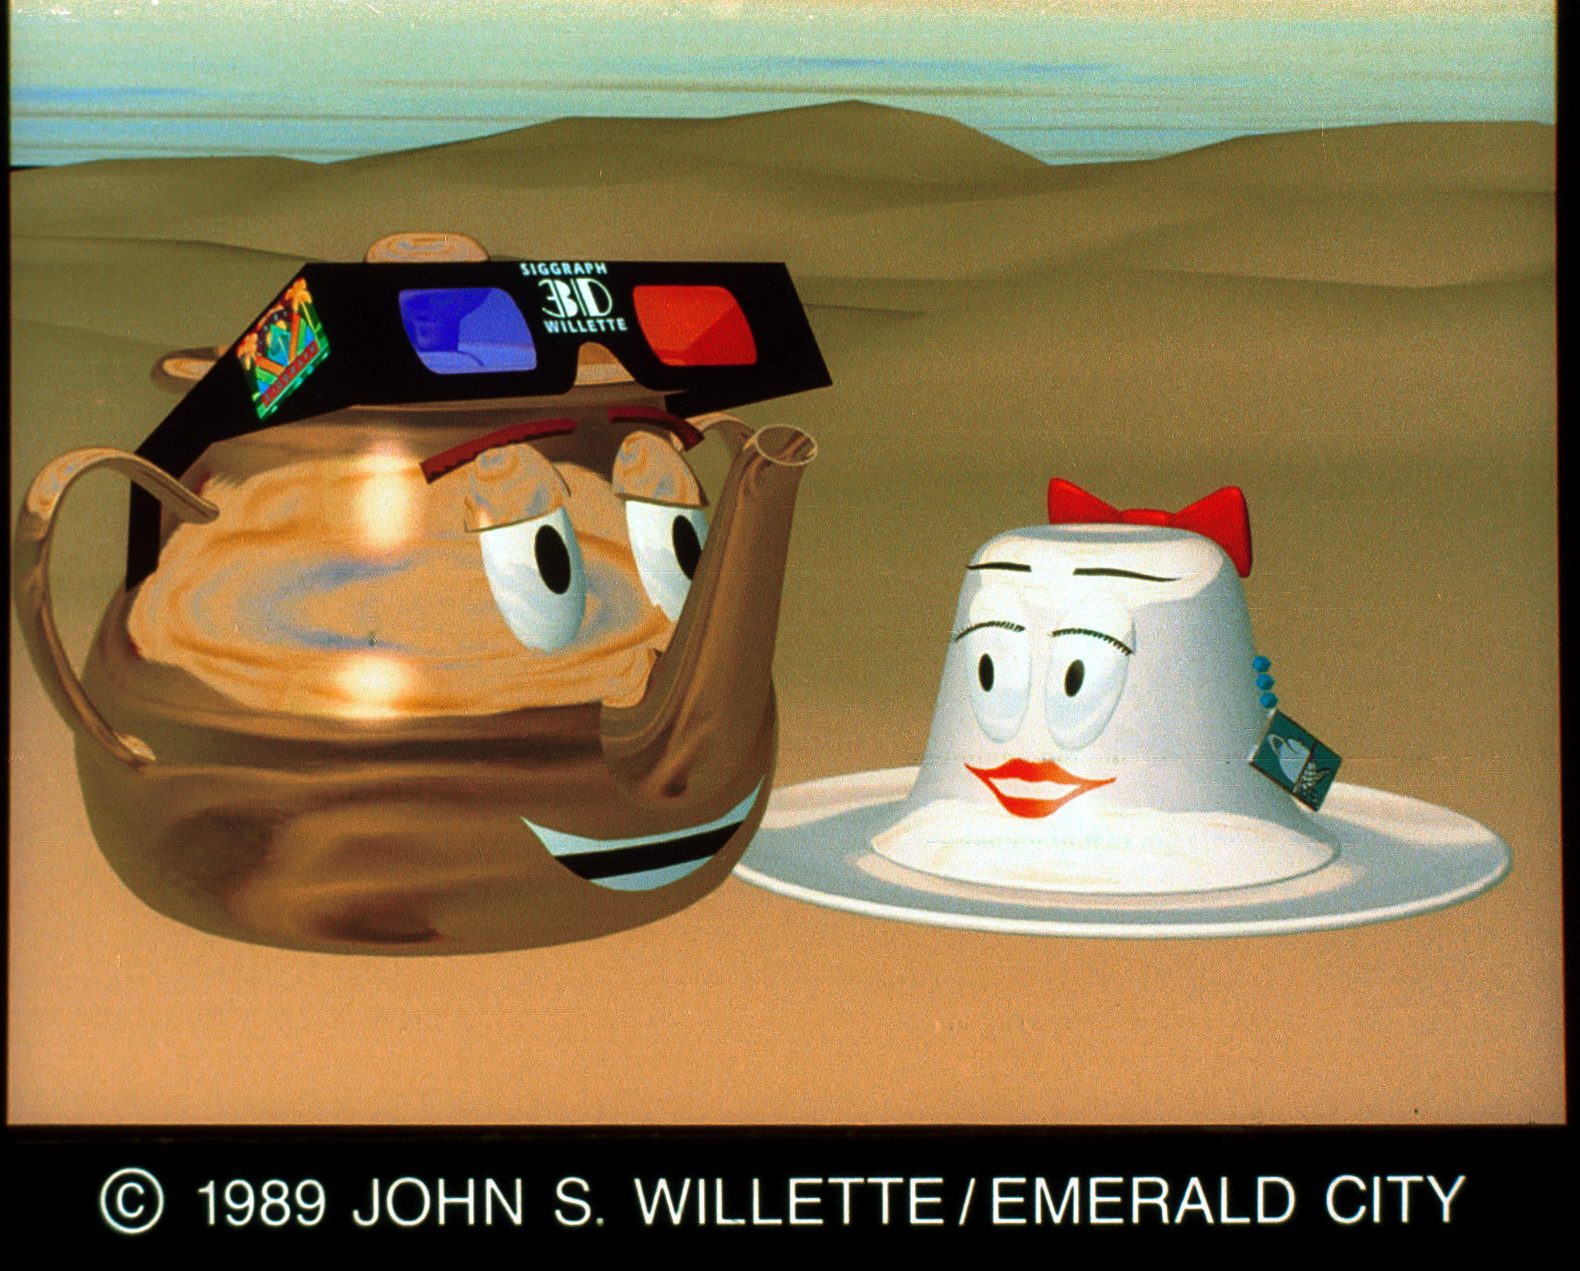
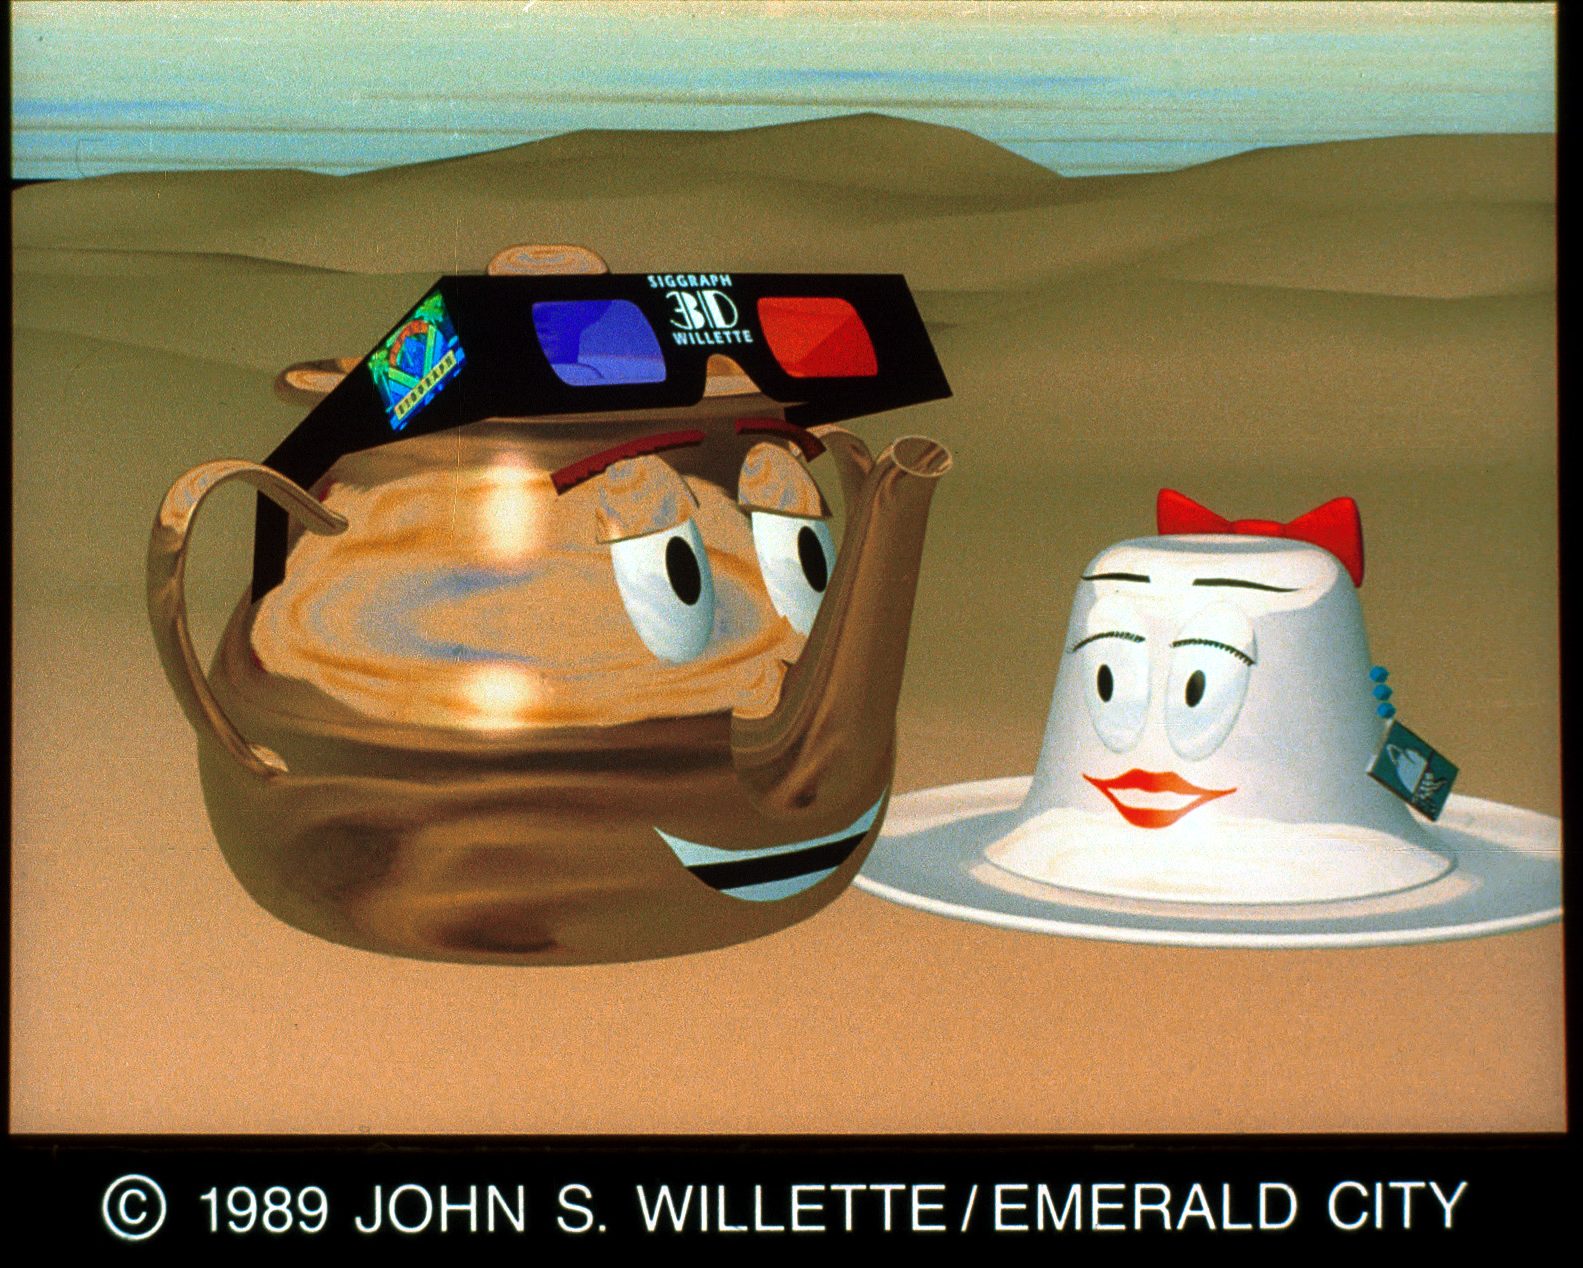
61&62. OOOH, That SIGGRAPH Feeling by John S. Willette. The entire project was created on a Cubicomp Picturemaker with 3.0 software and race board. “This image was designed specifically as a SIGGRAPH entry. I tried to capture the feeling I get when I attend SIGGRAPH, and incorporate current technologies and trends seen at SIGGRAPH; character animation, teapots, stereo vision, natural phenomena and SIGGRAPH memorabilia,” said Willette. Contact: John Willette, Emerald City, 2660 Horizon Dr. S.E., Grand Rapids, MI 49546, (616) 949-9283.
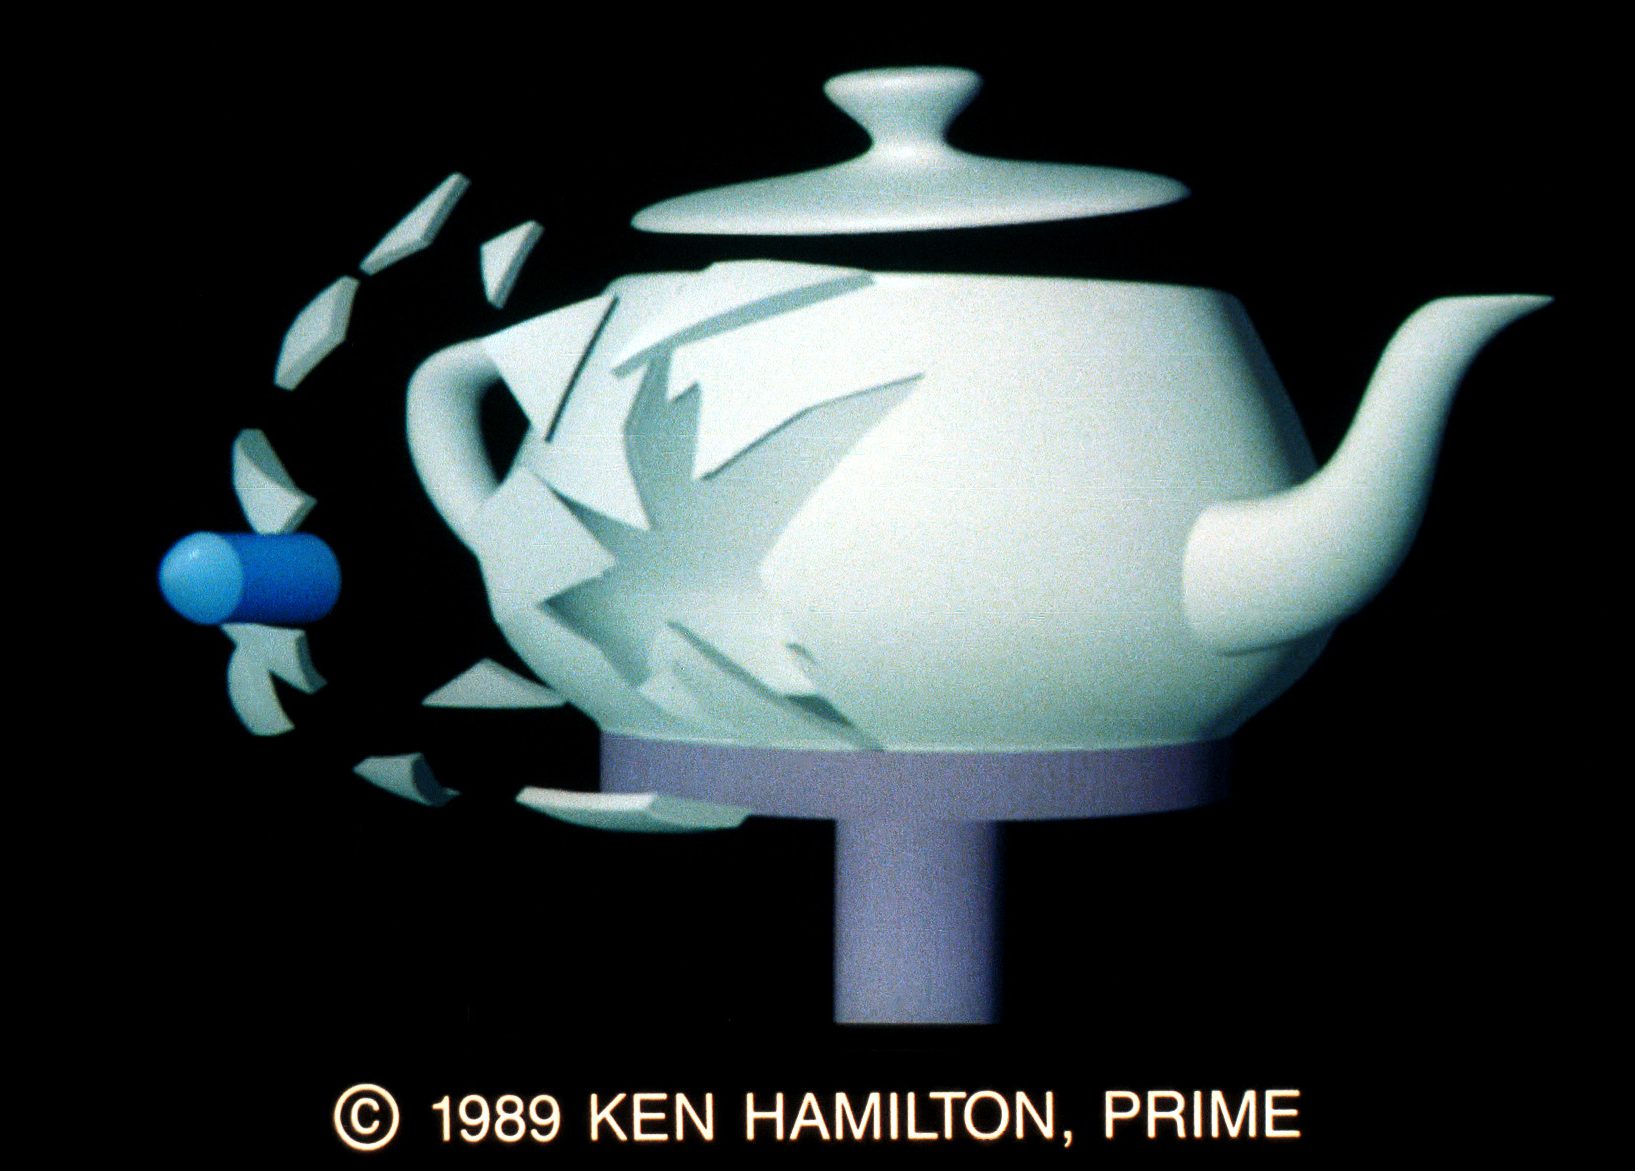
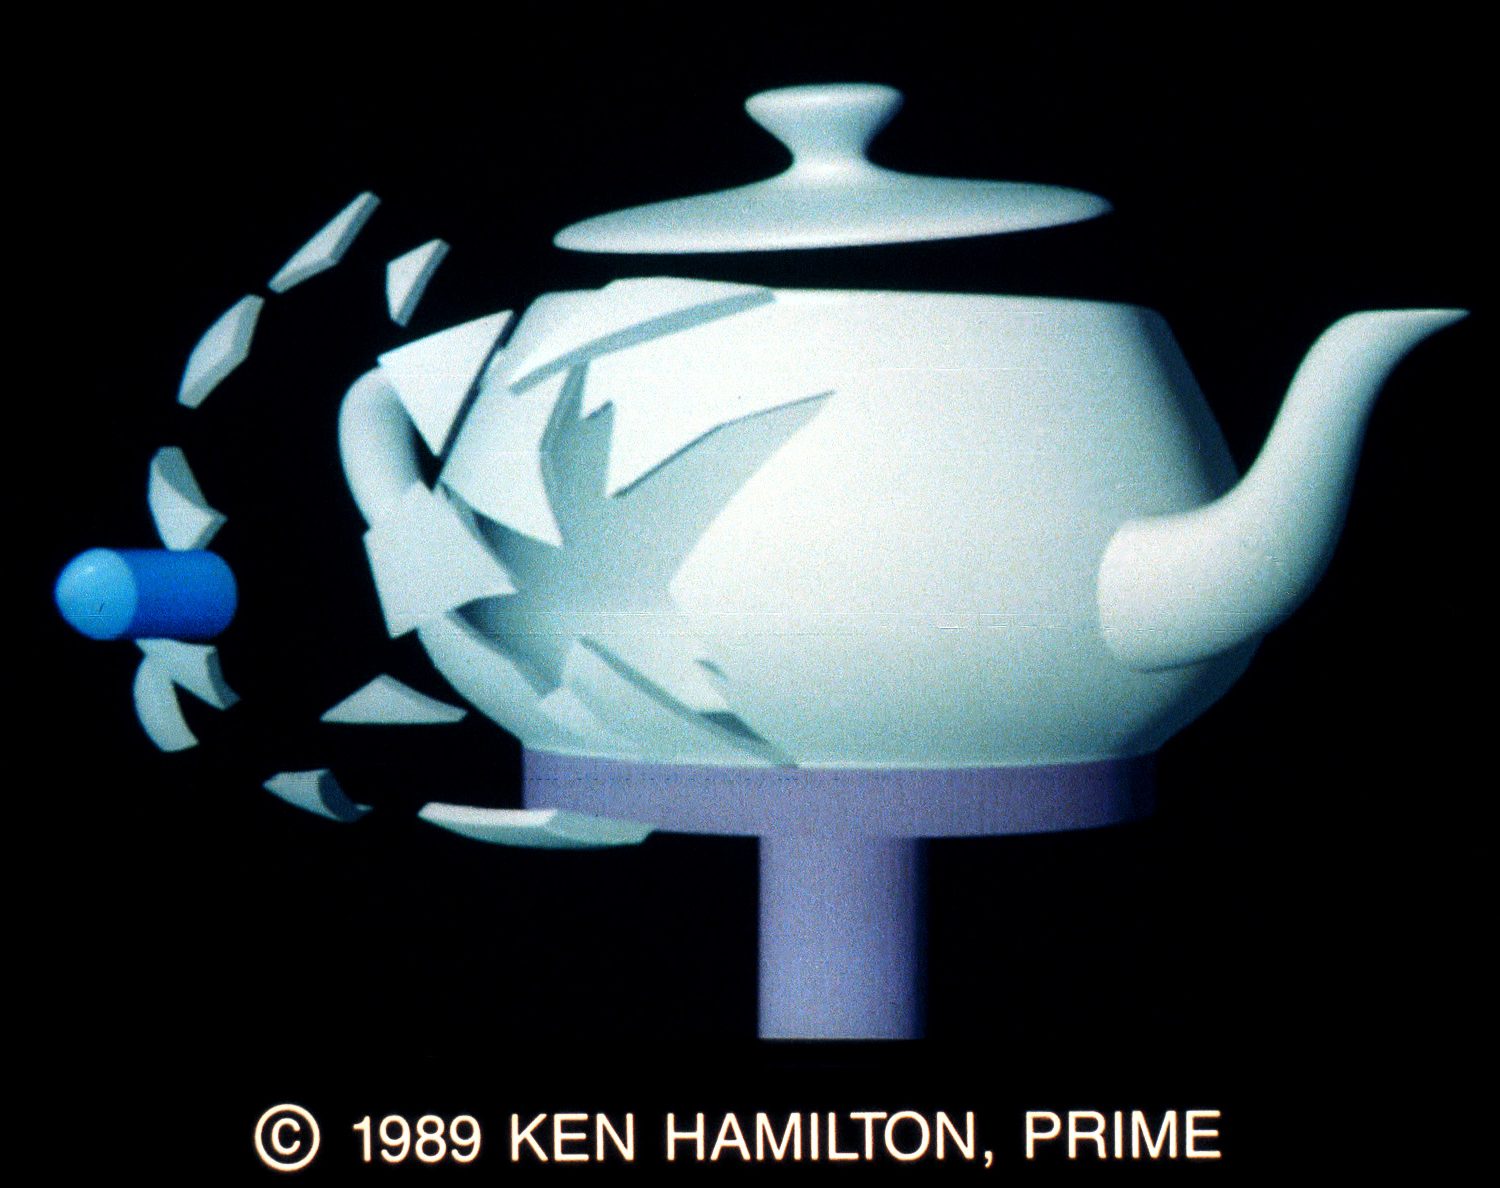
63&64. The Teapot Meets Dr. Edgerton by Ken Hamilton. This image is an outgrowth of a luncheon discussion at last year’s SIGGRAPH conference. Upon hearing that “the teapot” had been chosen as the symbol for SIGGRAPH ’89, my friends and I considered various ways to do away with the most notable computer graphics cliche since “the mandrill.” This particular idea crystallized some time later; it pays homage to MIT’s Dr. Harold Edgerton, but it does not in any way pretend to approach his wonderful accomplishments. This image is not intended to be mistaken as a physical simulation. The model was created by use of Computervision CADDS 4X from Prime, the visible entities being solids and composite trimmed surfaces. The rendering was performed by Wavefront software and displayed on a Silicon Graphics Iris. The author gratefully acknowledges the assistance of numerous colleagues at Prime Computer, especially Laura Davis. Contact: Ken Hamilton, 122 Decatur St., #10, Arlington, MA 02174.
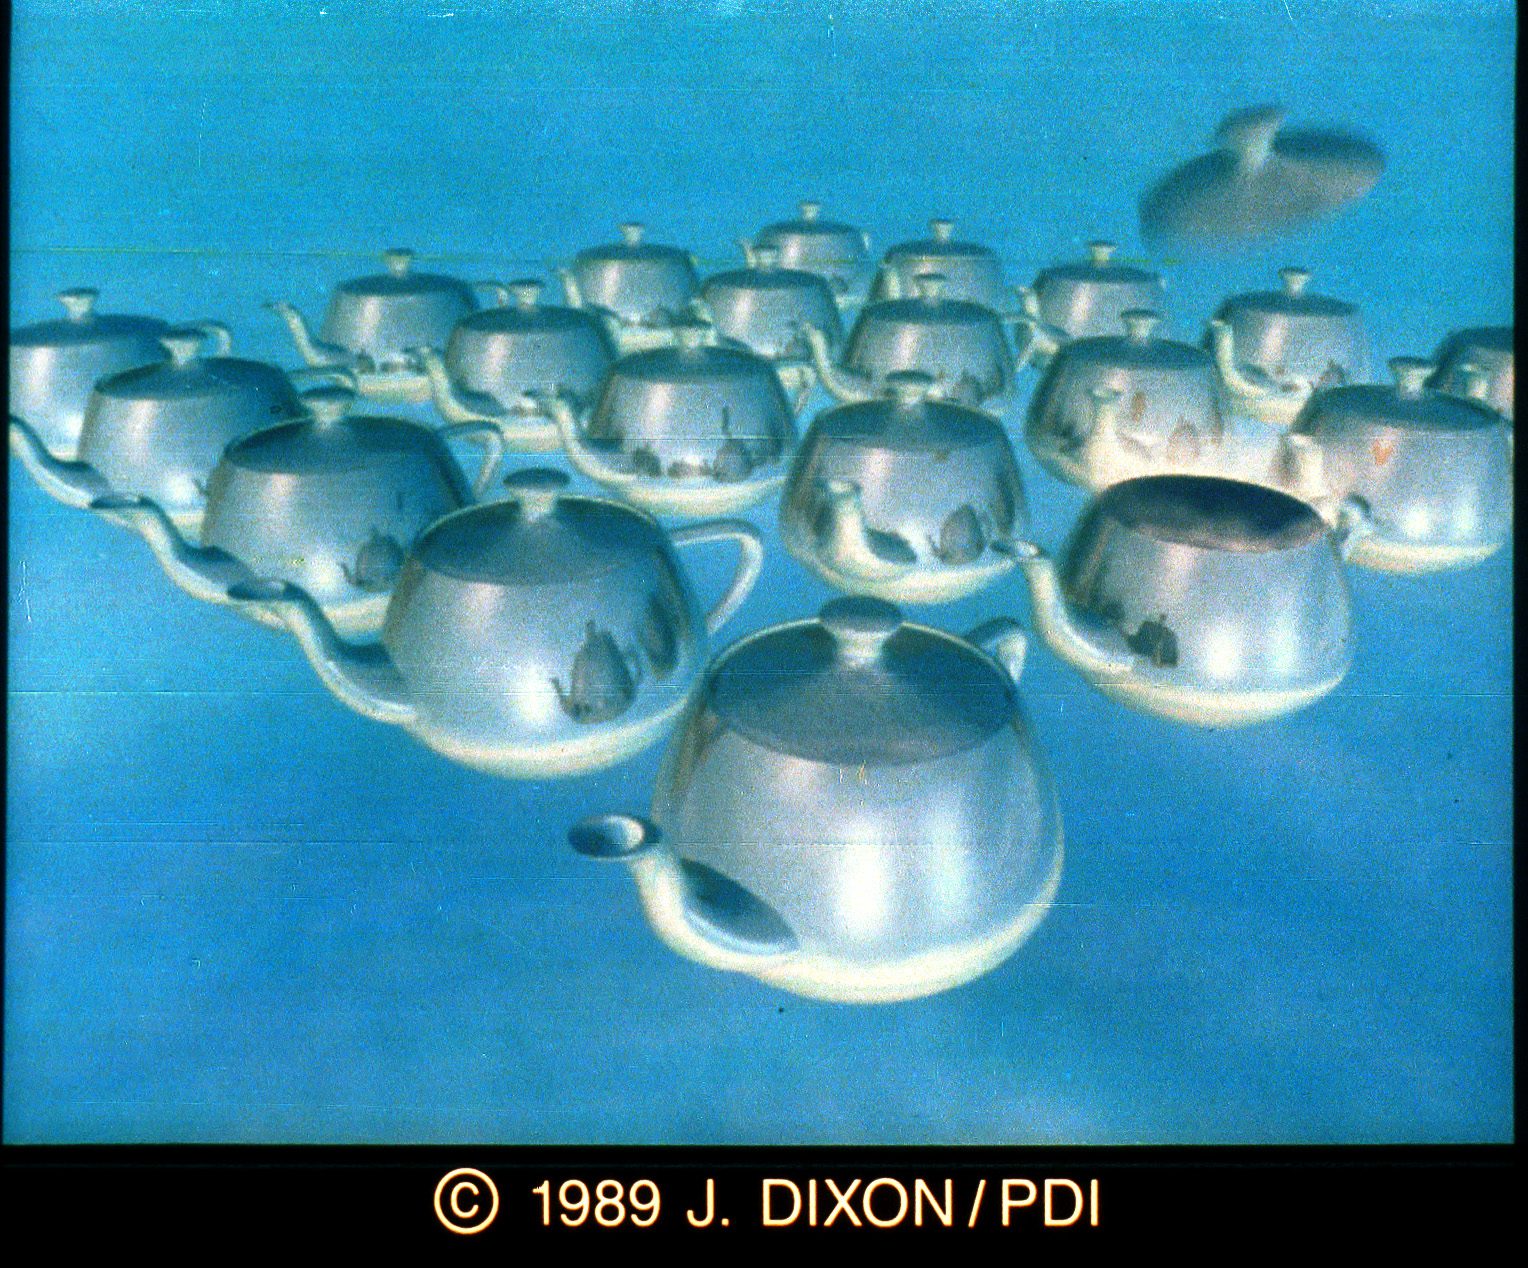
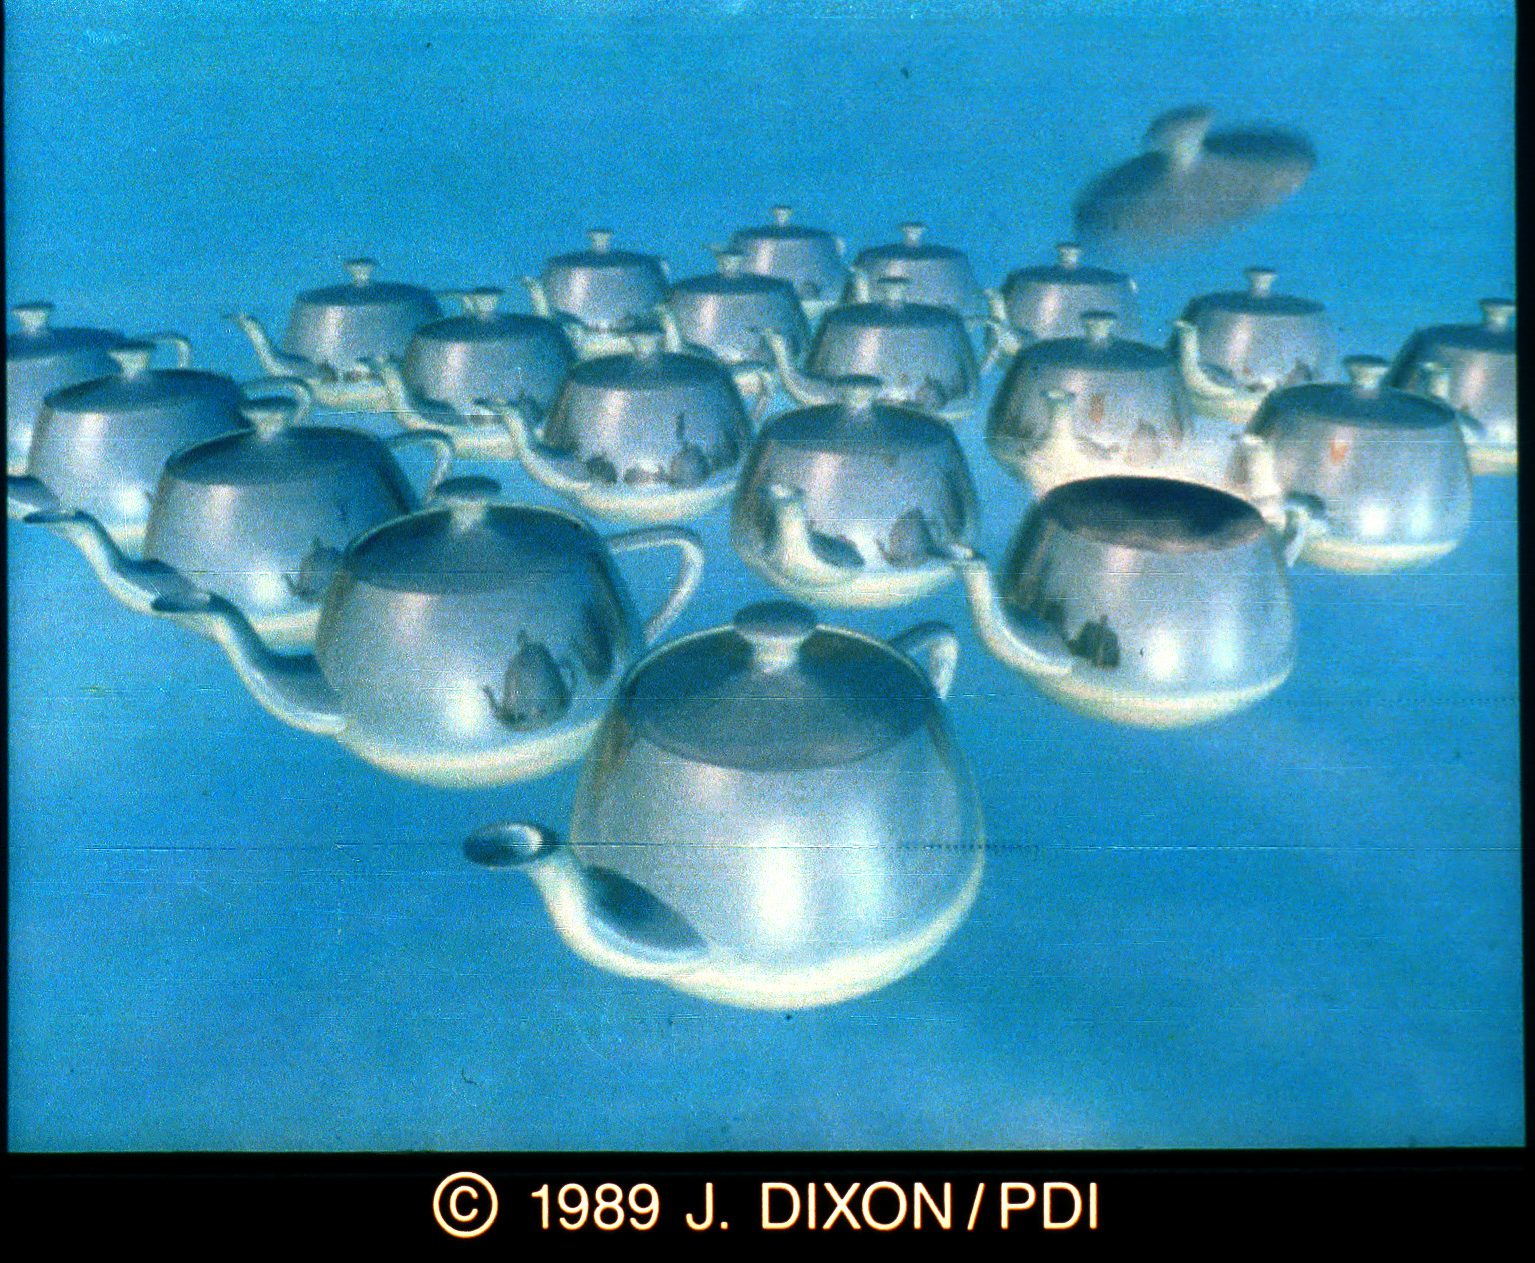
65&66. Blowing It by James Dixon. This stereo pair was created using POI’s proprietary animation and modeling system. There are around 40,000 polygons rendered using a “six-sided box” reflection map. The “top” is rendered with a newly developed motion-plus technique. Each 512 x 512 image took 20 minutes. The teapot data came from an article by Jim Blinn in ComputerGraphics and Animation. Contact: James Dixon, Pacific Data Images, 1111 Karlstad Dr., Sunnyvale, CA 94089, (408) 745-6755.
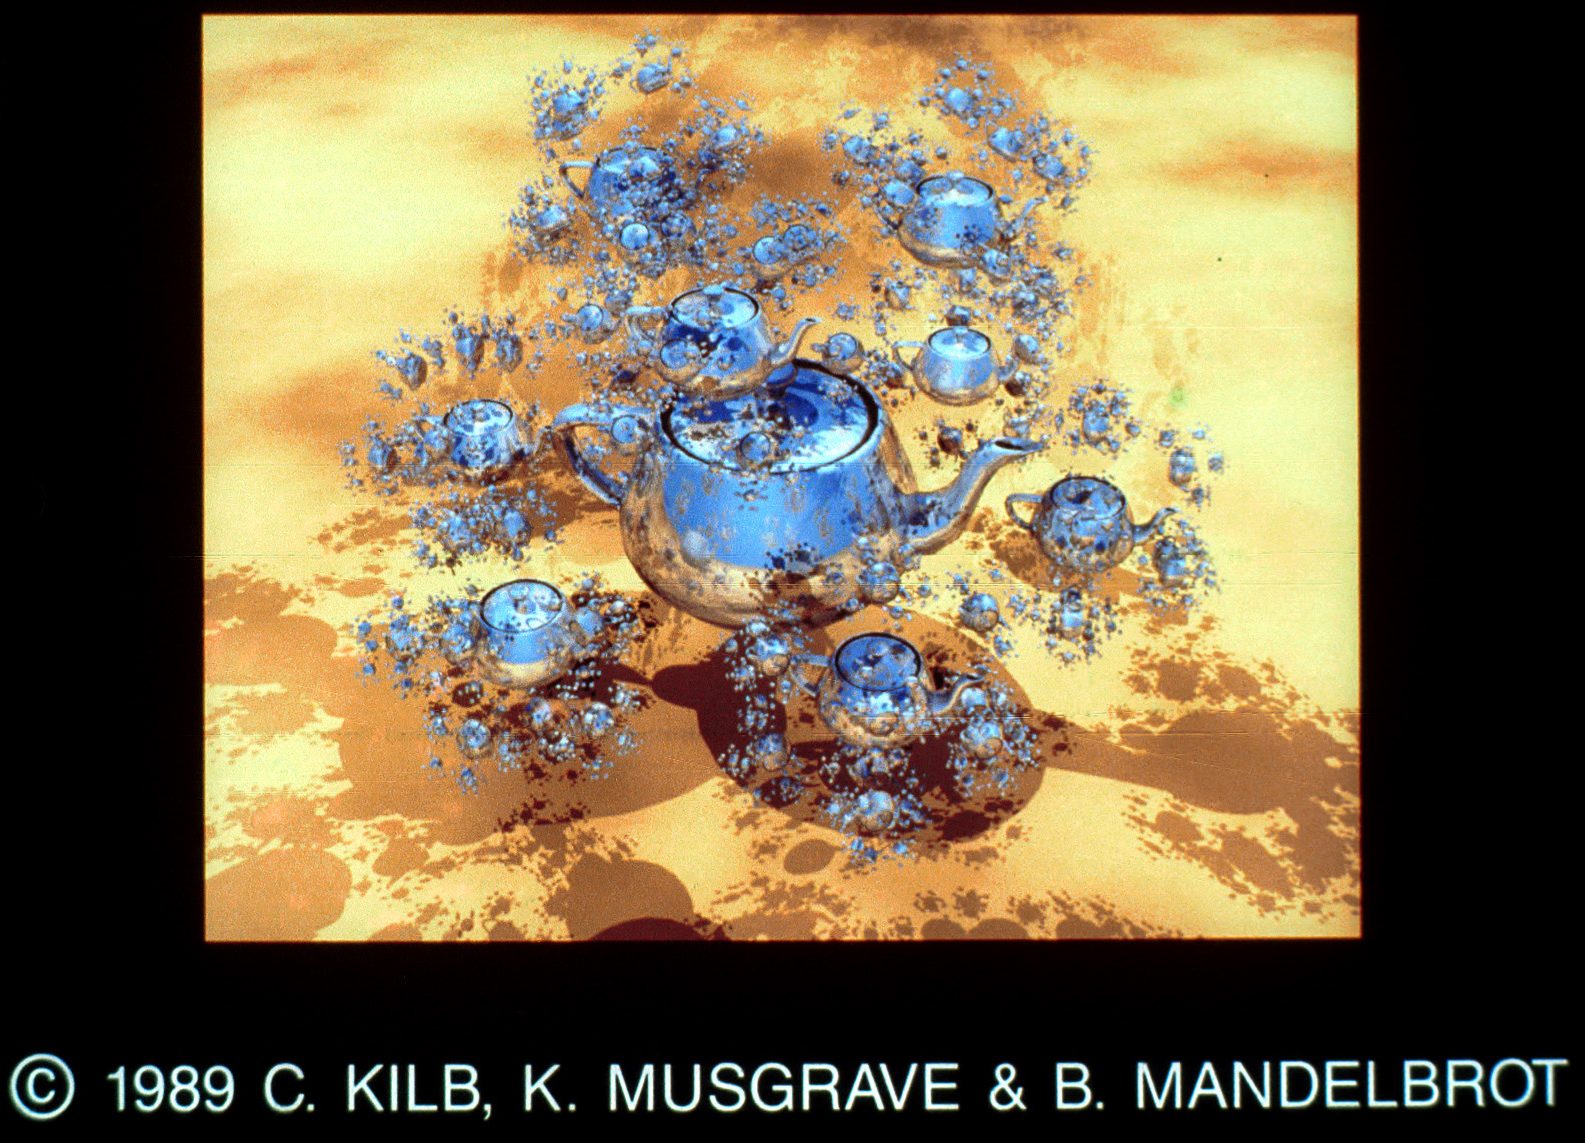
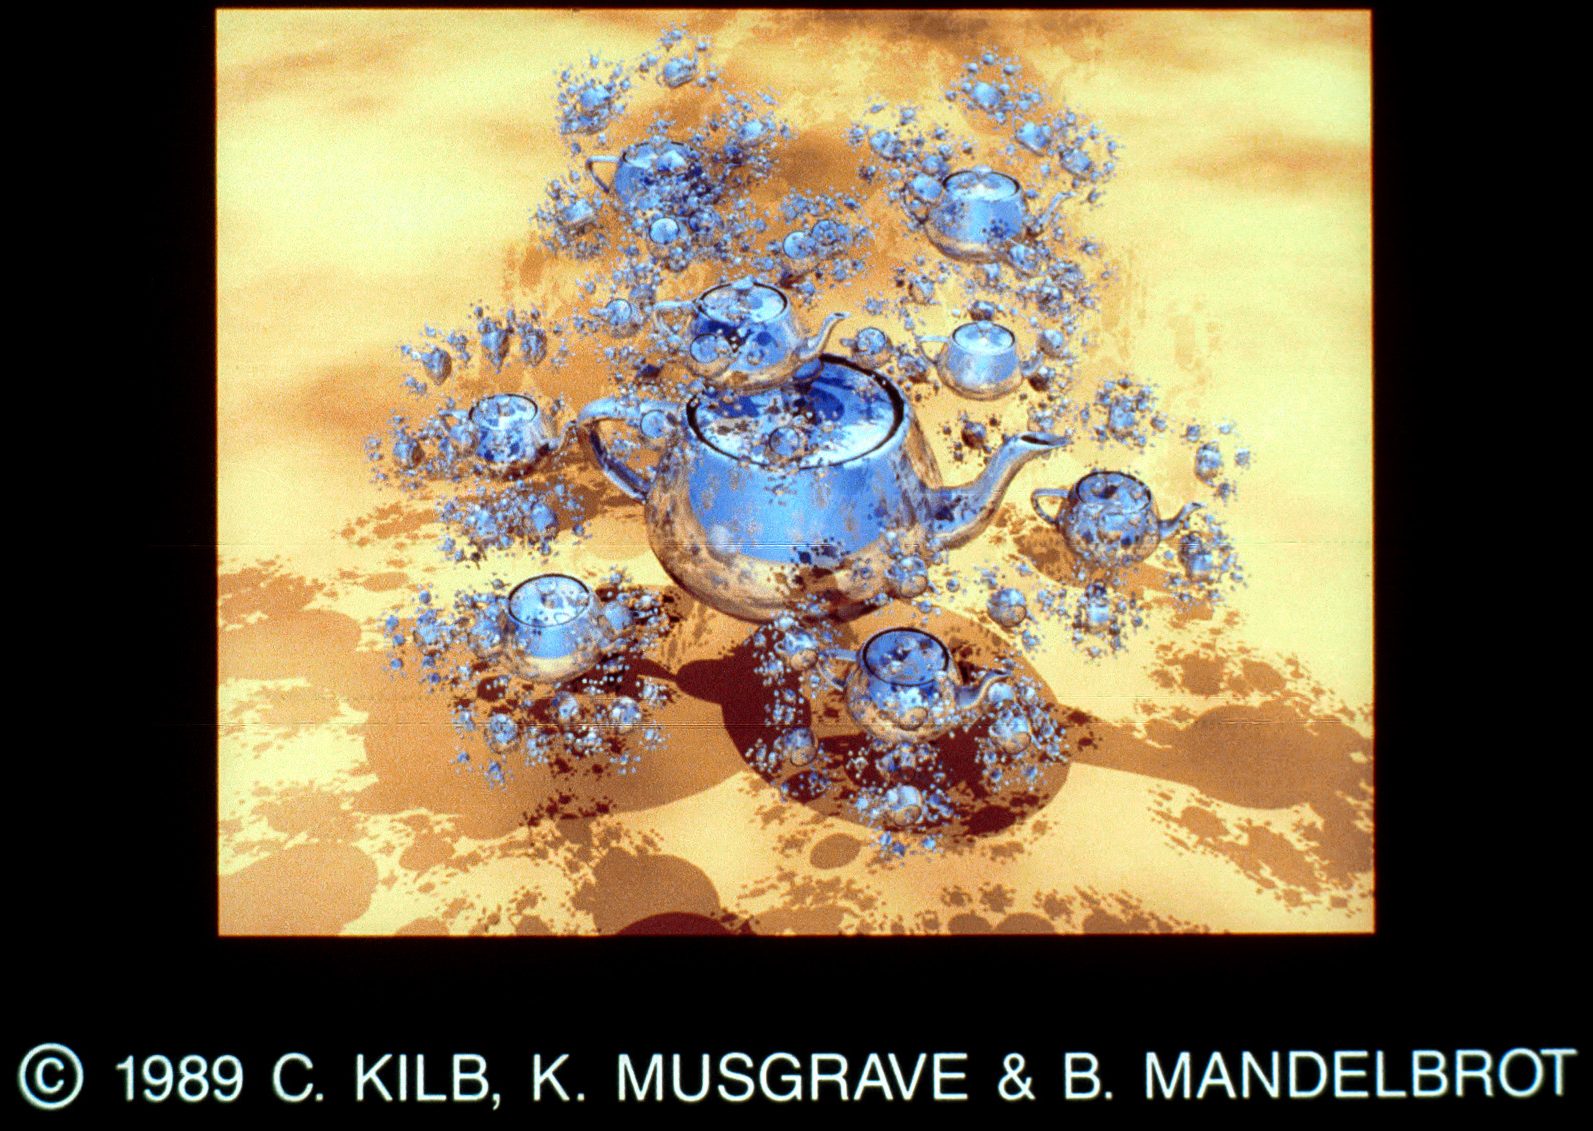
67&68. Tea for 2Σ9k, by C. E. Kolb, k=0 F. K. Musgrave and B. Mandelbrot. Ray traced image of 7381 teapots consisting of 2256 reflective Phongshaded triangles each. The image was rendered on a Silicon Graphics 4D/70G workstation using custom software. Fractal arrangement courtesy of Eric Haines. Contact: Craig Kolb, Yale University Department of Mathematics, P.O. Box 2155, Yale Station, New Haven, CT 06520.
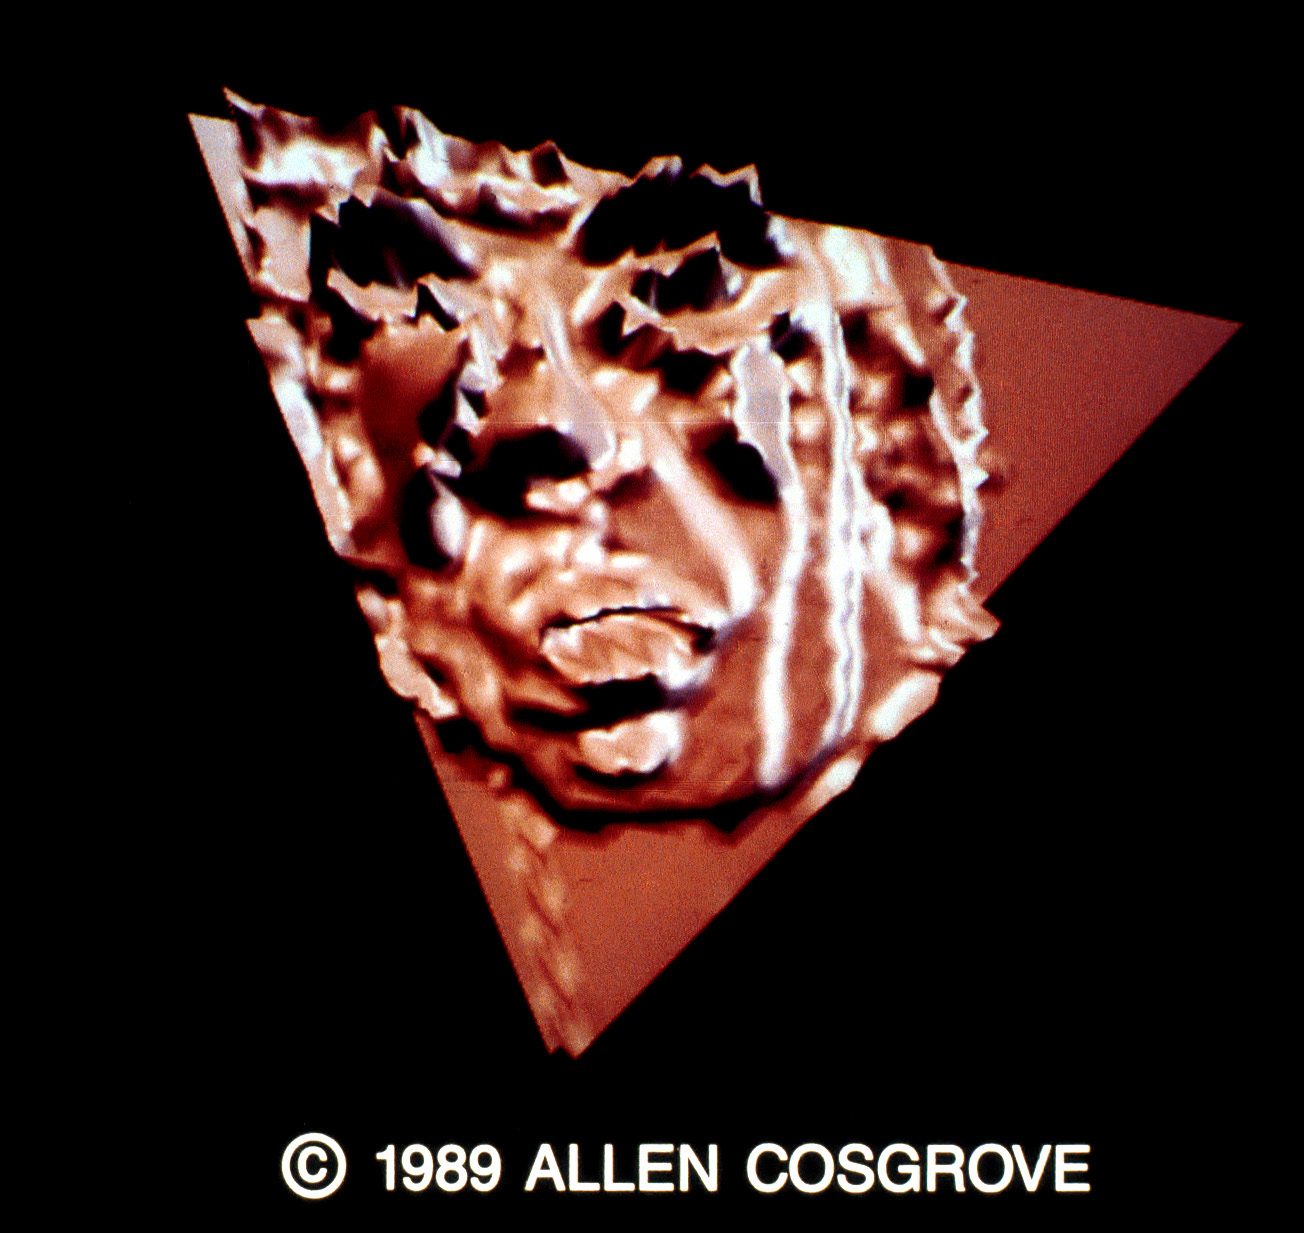
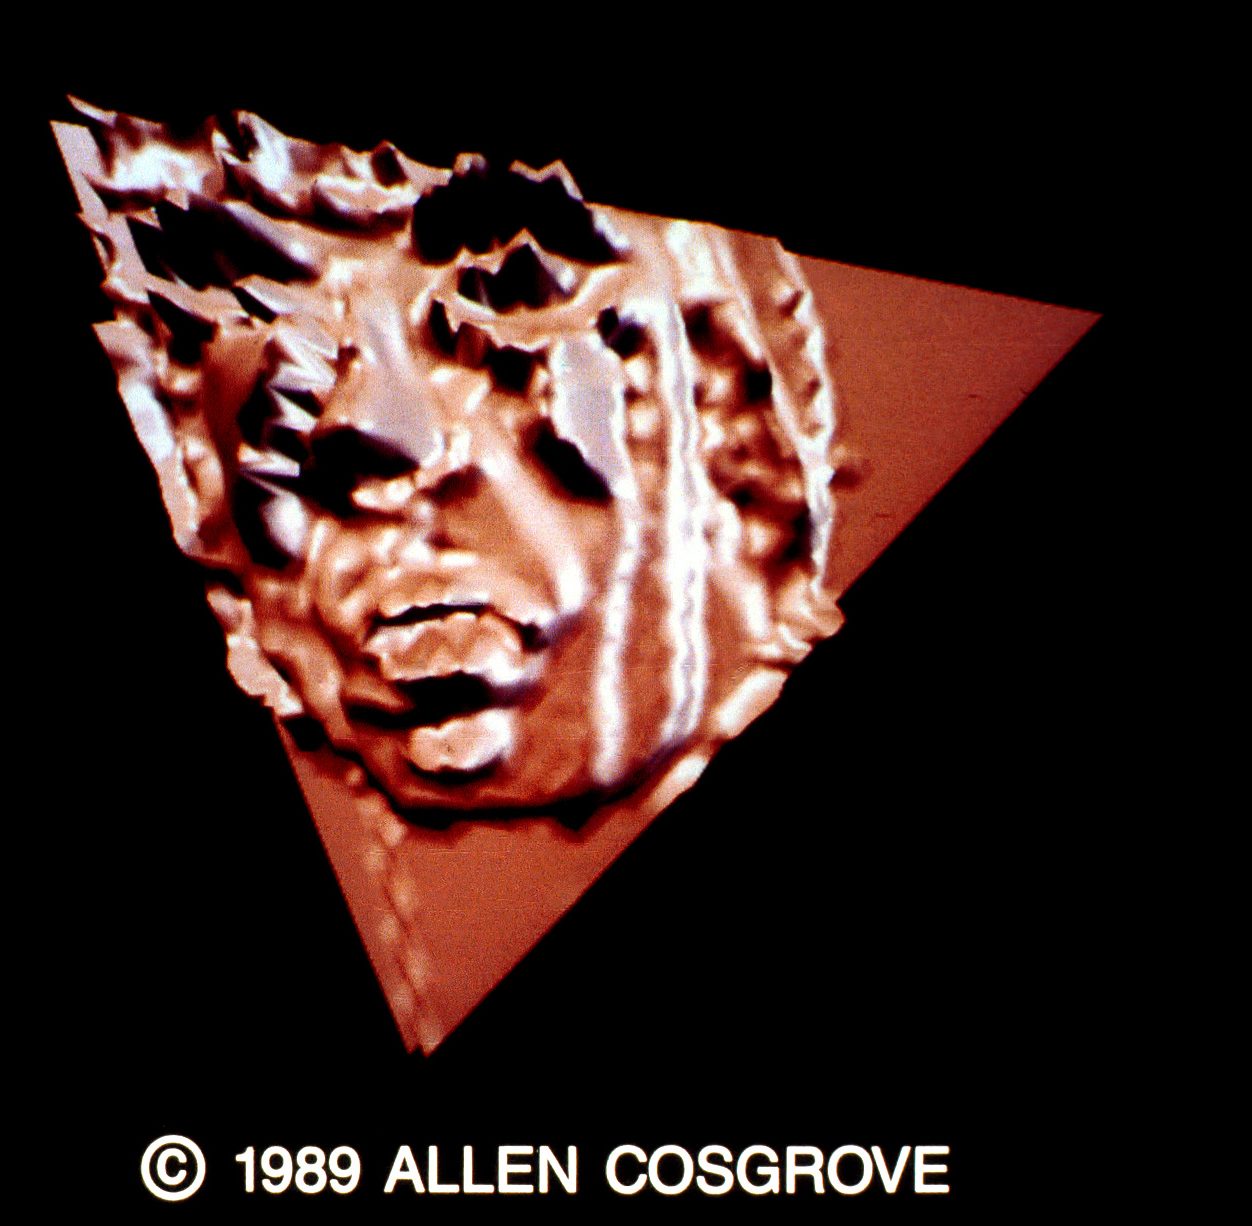
69&70. Self-3D.2 by Allen Cosgrove. The NEC-APC IV was used with the Targa 24 board running Digital Arts DGS 2.0 and TIPS software. The author frame grabbed a self portrait, retouched it with TIPS and then bump mapped (using DGS 2.0) onto approximately 6000 Phongshaded polygons to create the images. Contact: Allen Cosgrove, 15 Revere Road, Bellemead, NJ 08502, (20 I) 874-4935.
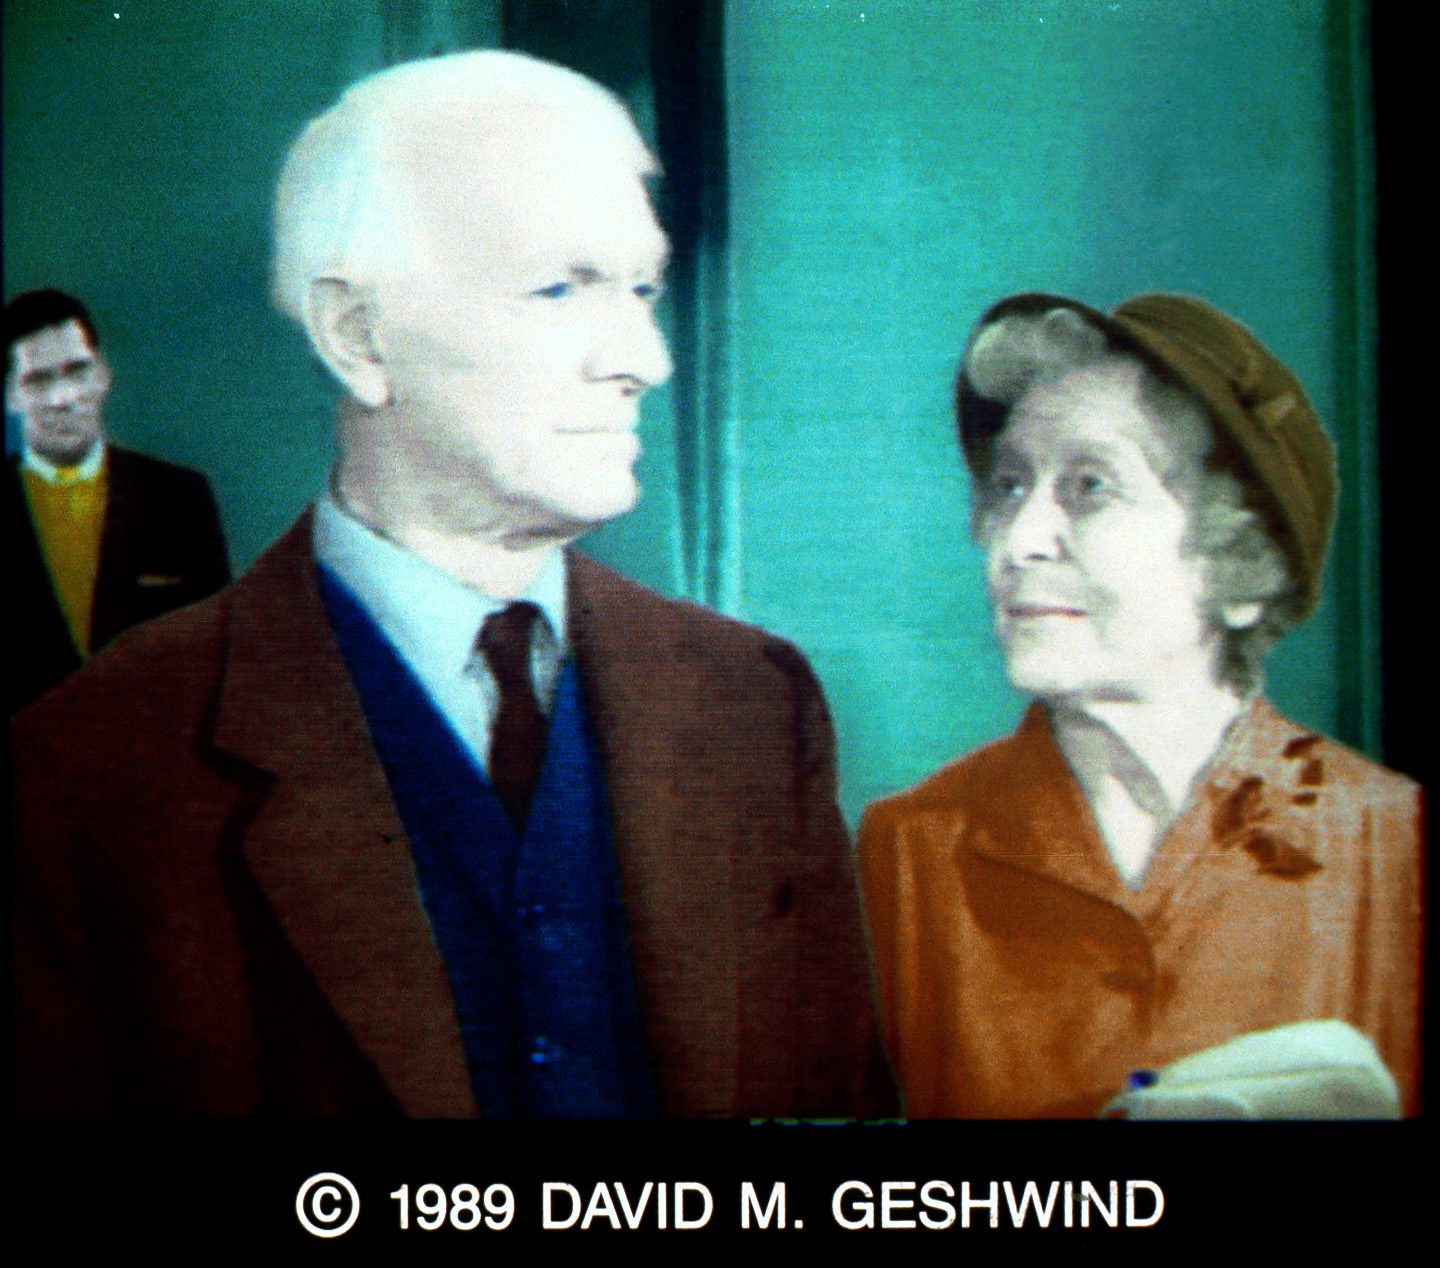
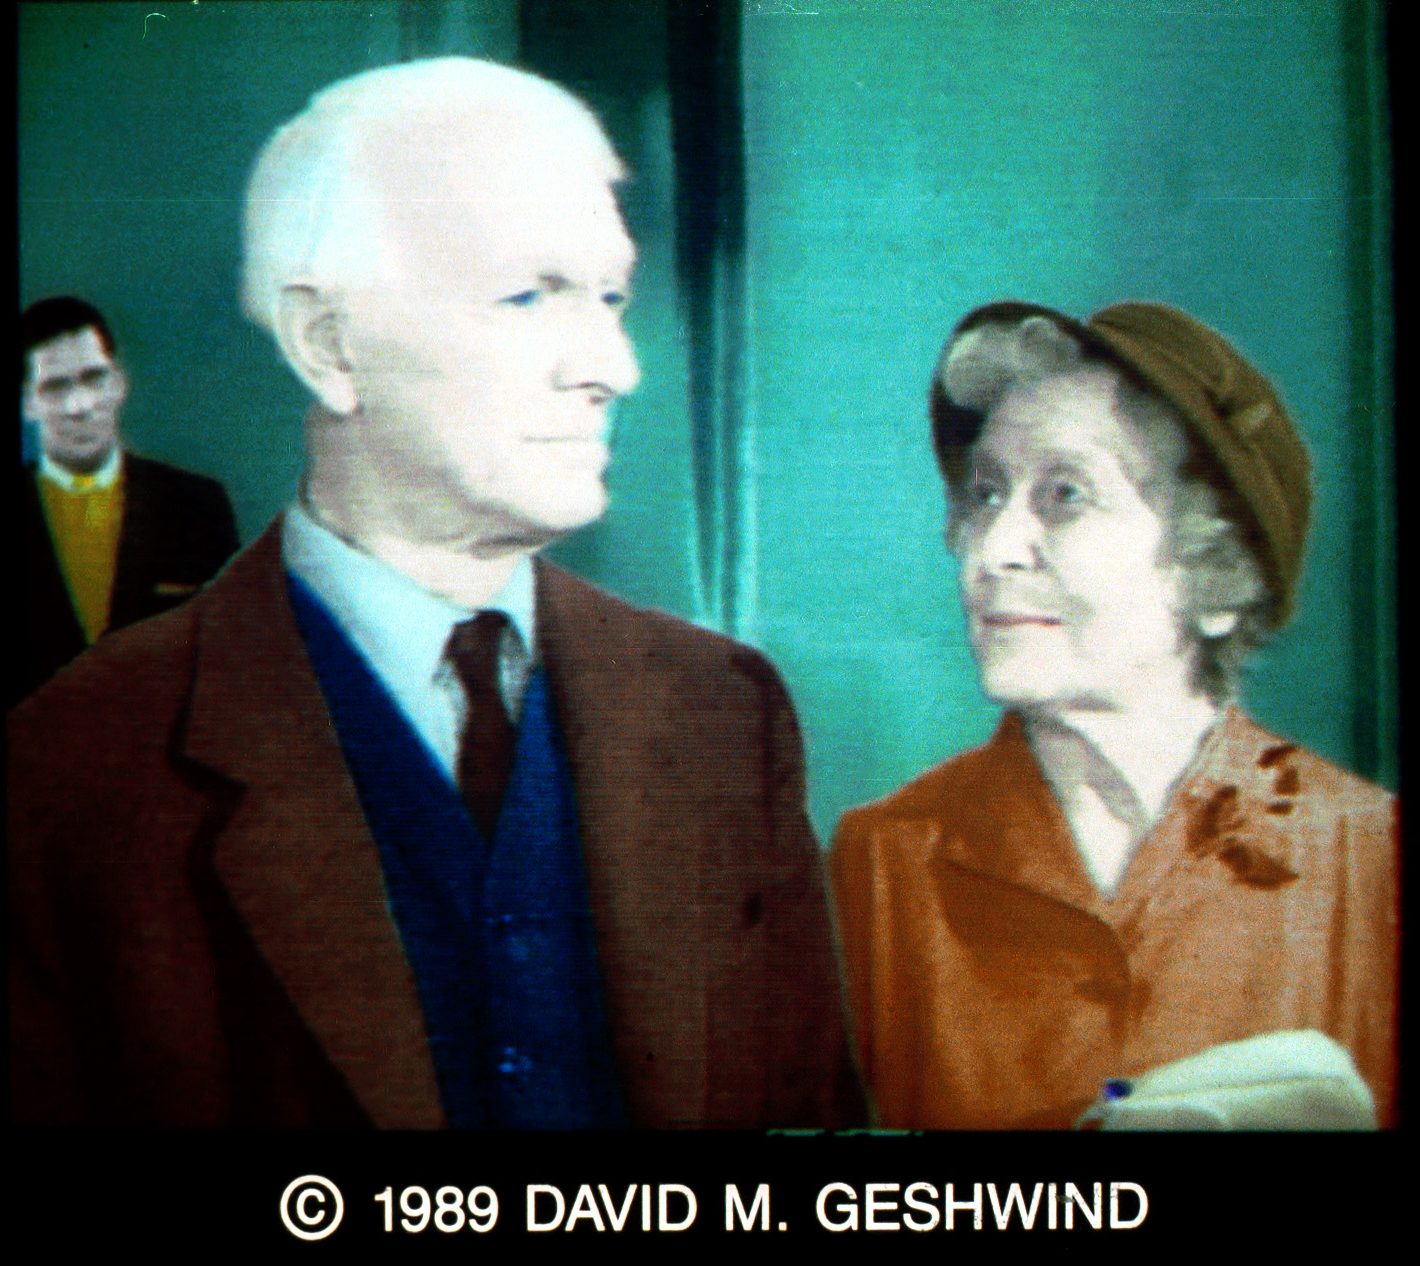
71&72. TZ-Another Dimension by David M. Geshwind. The image is derived from a B&W frame whose copyright is CBS. Although this work is more “commercial” than “fine” art, it is believed that it is of interest because it demonstrates new capabilities of the computer in the graphic arts. This image is the first demonstration of a new, patent pending computer system that adds both color and depth information to 2D black and white images (e.g., this off air frame from an old Twilight Zone) to create color and/or 3D images. This system provides additional possibilities for re-using existing film, video and other media properties for entertainment, educational and scientific purposes. Created on an IBM/PC-AT with Targa-32 and proprietary custom software by the artist. Filmed with Truevision Digital Film Printer. Contact: David M. Geshwind, Latent Image Development Corporation, Two Lincoln Square, New York, NY I0023, (212) 873-5487.
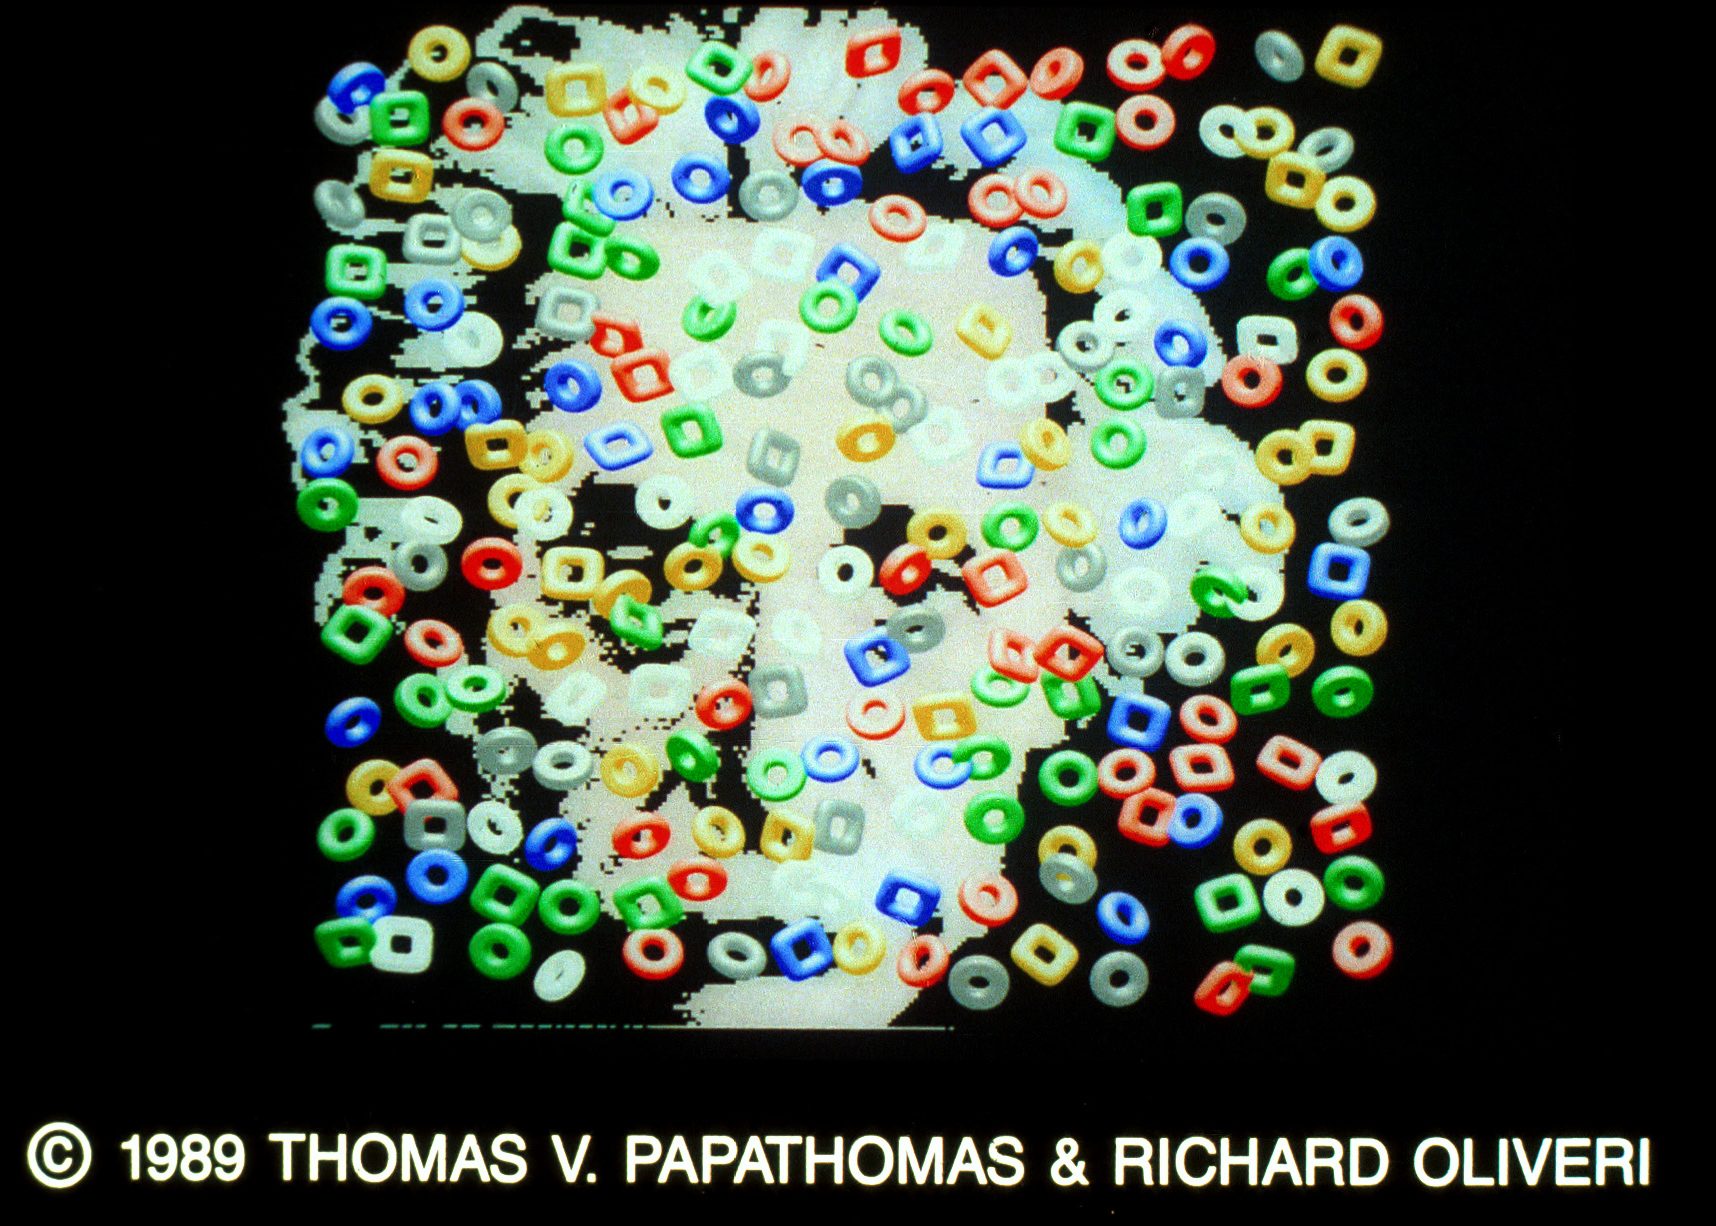
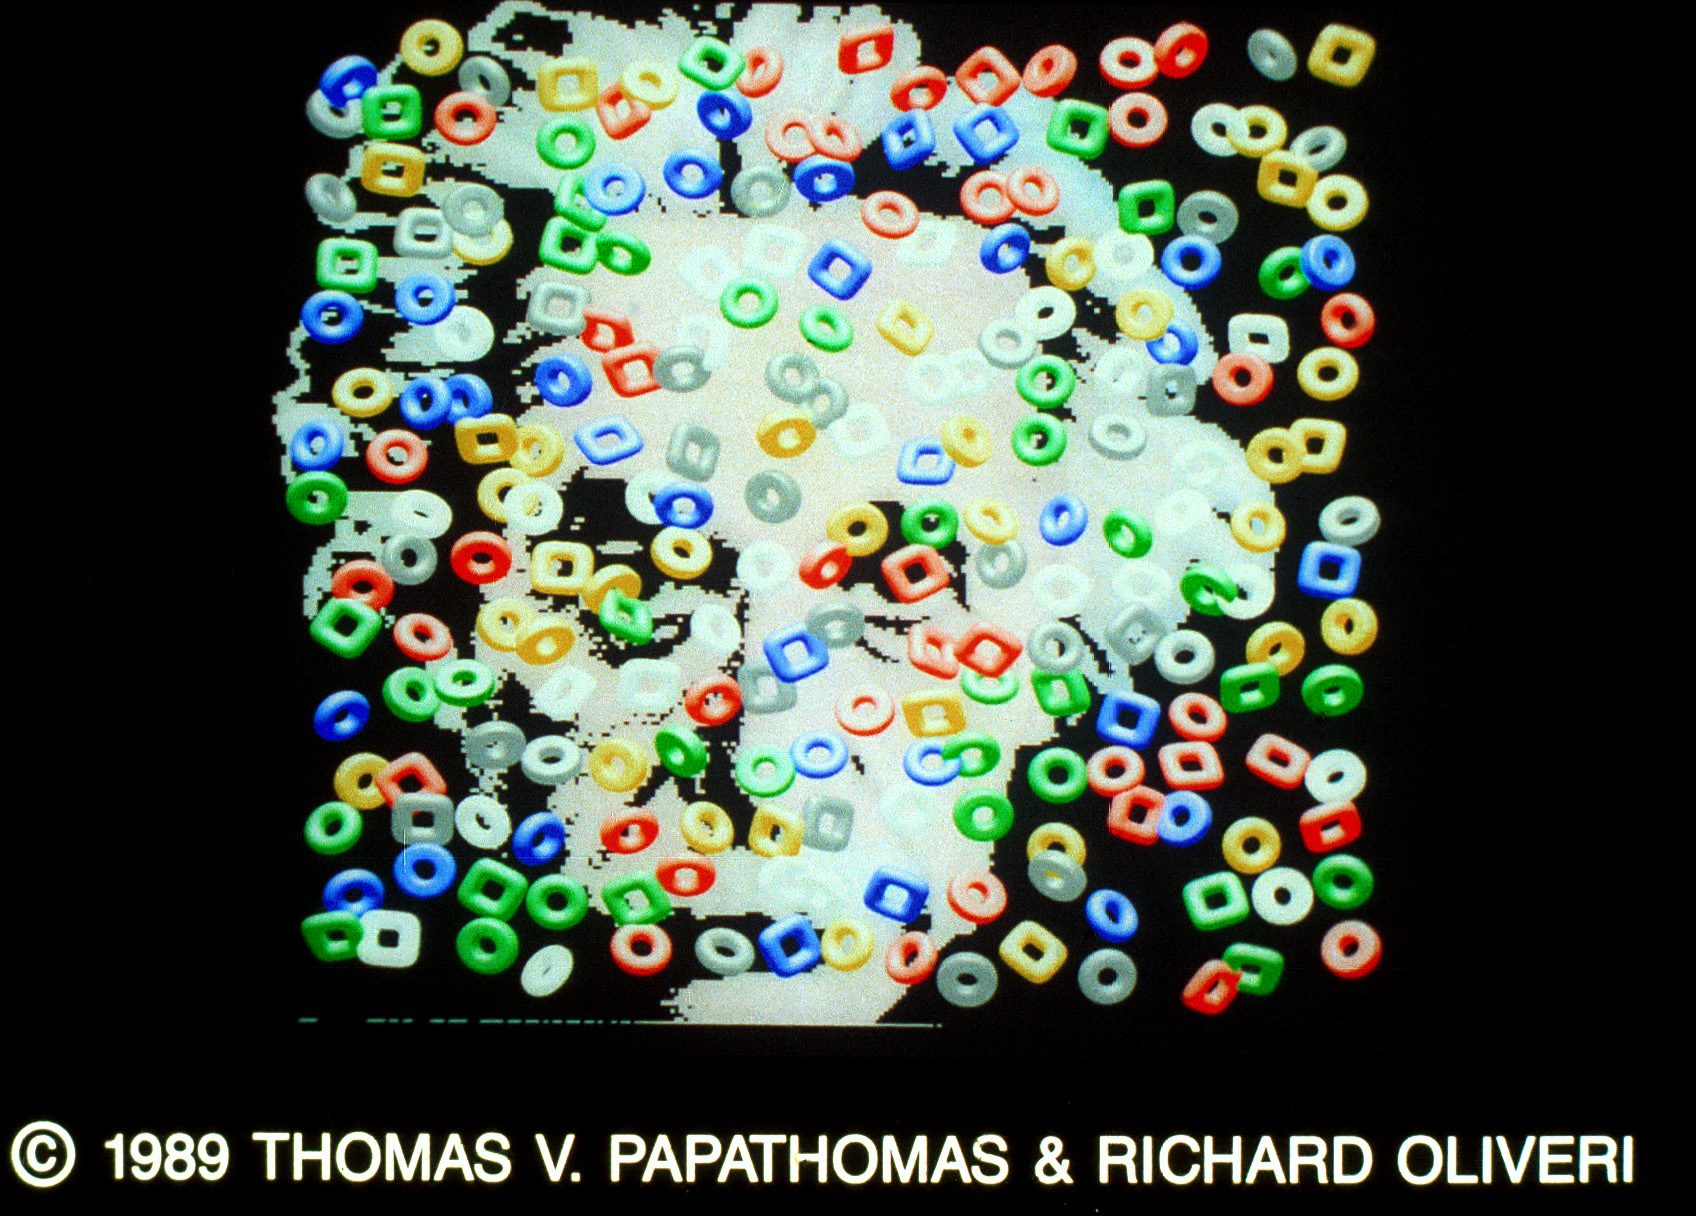
73&74. Einstein’s Face/Latent Square by Thomas V. Papathomas and Richard Oliveri. The images were created on the AT&T Pixel Machine, model PXM964d with PICLIB software. The left-eye and right-eye images, seen separately, appear identical; several donut-like objects of random color, position, orientation and shape are arranged on an (imaginary) flat, vertical cookie sheet. However, when the two images are fused stereoscopically, a square subset (6 x 6 donuts) in the center jumps out in front of the rest, creating a provocative visual illusion. The “donuts” were rendered with superquadric toroidal surfaces and they were Gouraud shaded using a single direct light source. The face was digitized at coarse resolution. Contact: Thomas V. Papathomas, AT&T Bell Laboratories, Visual Perception Research Dept., 600 Mountain Avenue, Room 2D551, Murray Hill, NJ 07974, (201) 582-4125, (201) 582-7308 FAX.
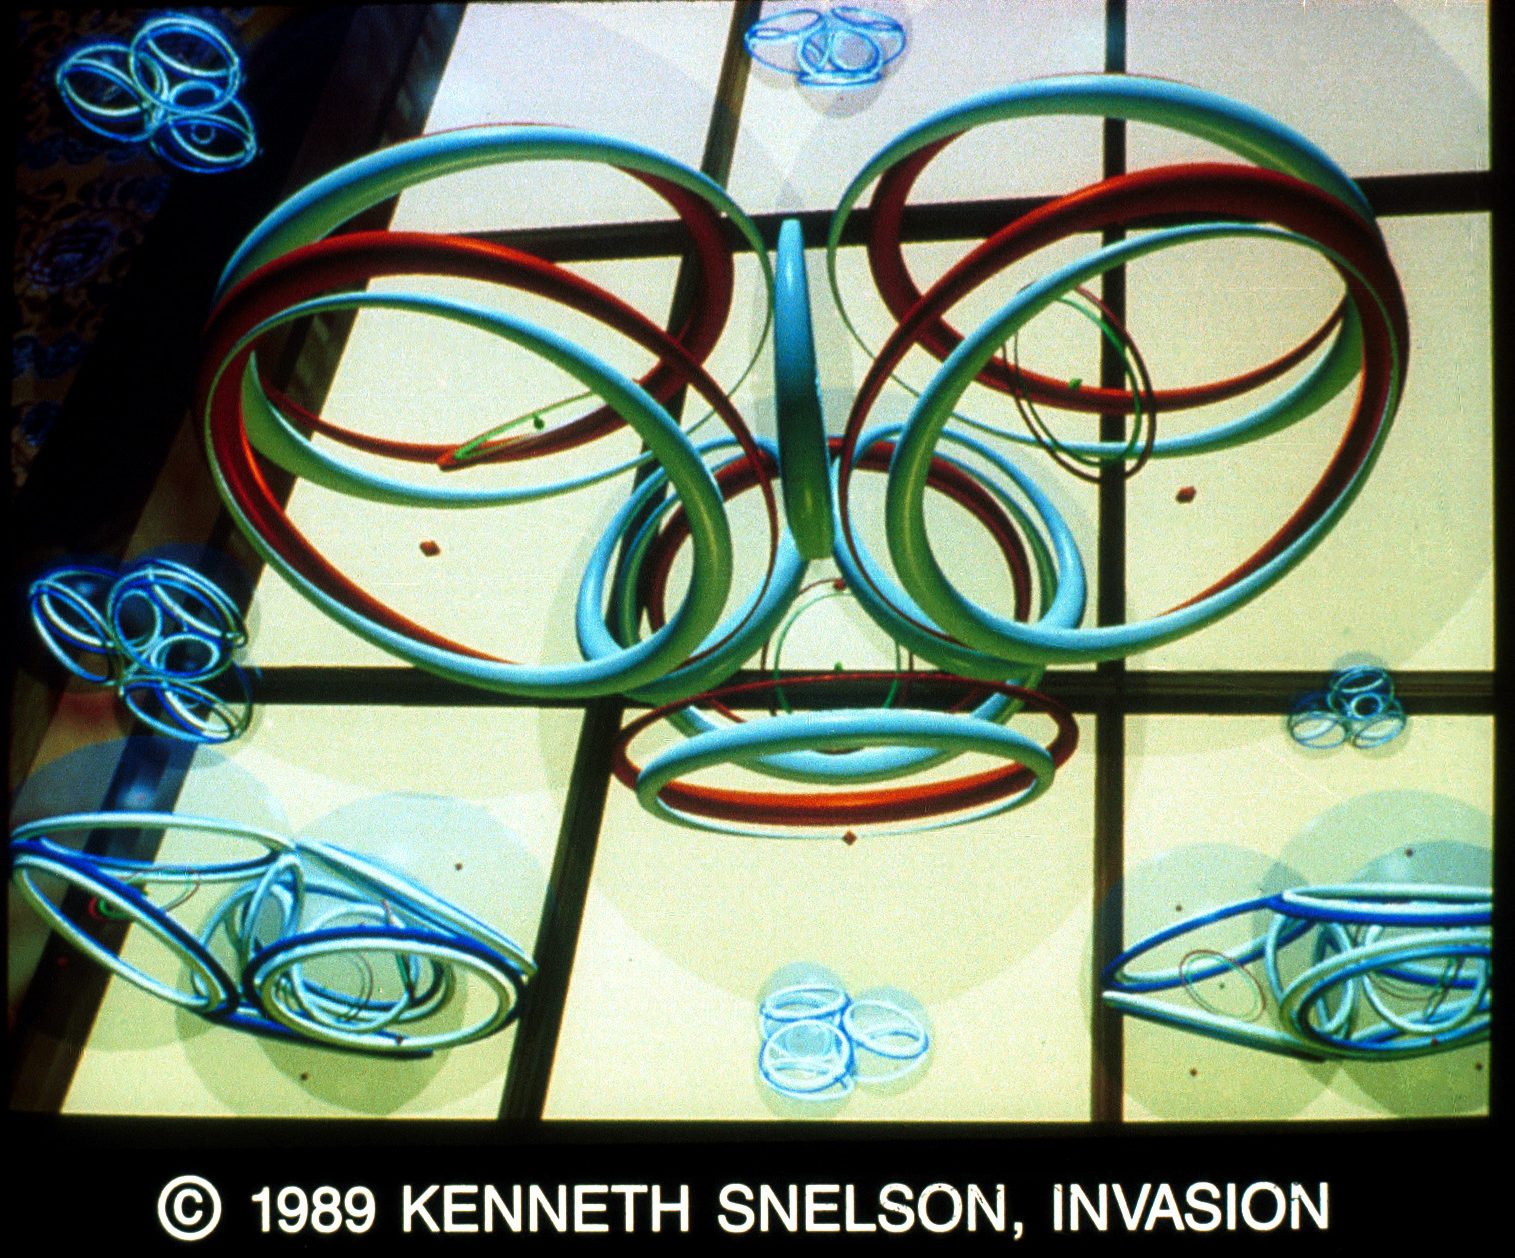
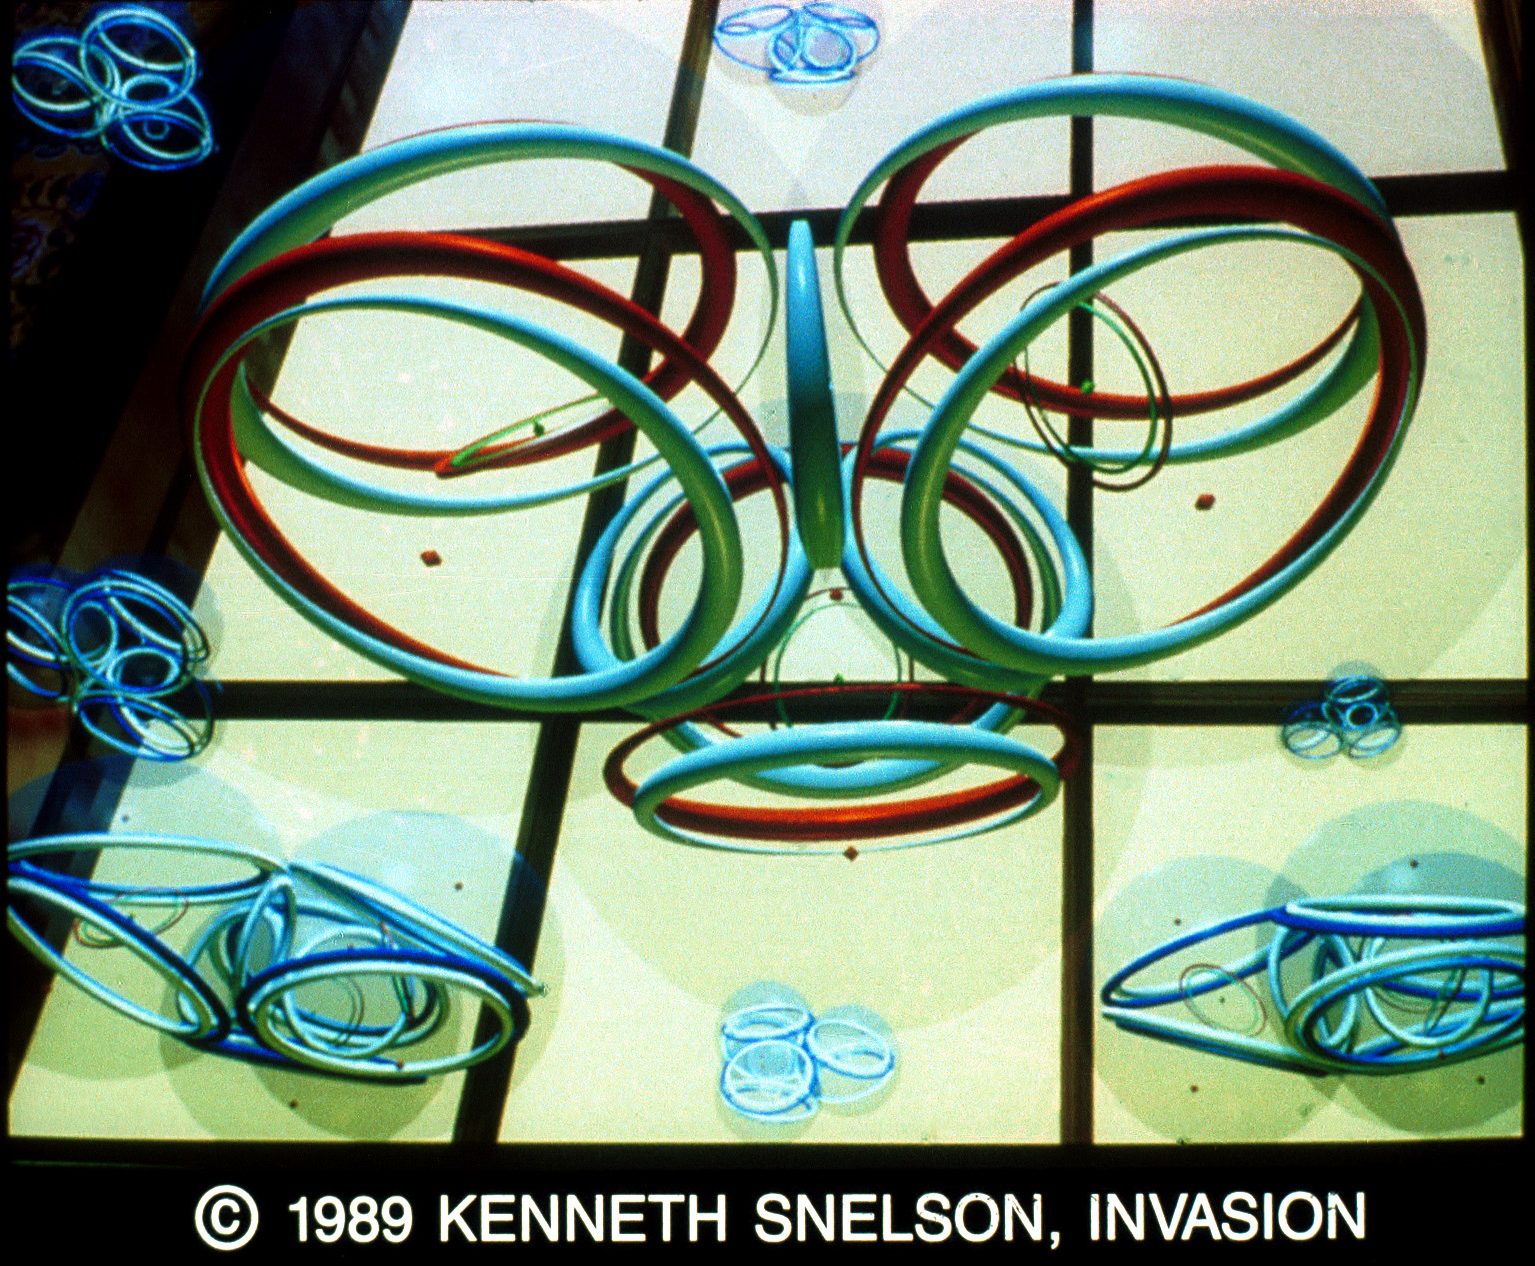
75&76. Invasion by Kenneth Snelson. Contact: Kenneth Snelson, 140 Sullivan Street, New York, NY 10012.
Publication Documents:
1989 Stereo Slide Set Images: