
“Debugging GPU stream programs through automatic dataflow recording and visualization”
Conference:
Type(s):
Title:
- Debugging GPU stream programs through automatic dataflow recording and visualization
Session/Category Title:
- GPU algorithms & systems
Presenter(s)/Author(s):
Moderator(s):
Abstract:
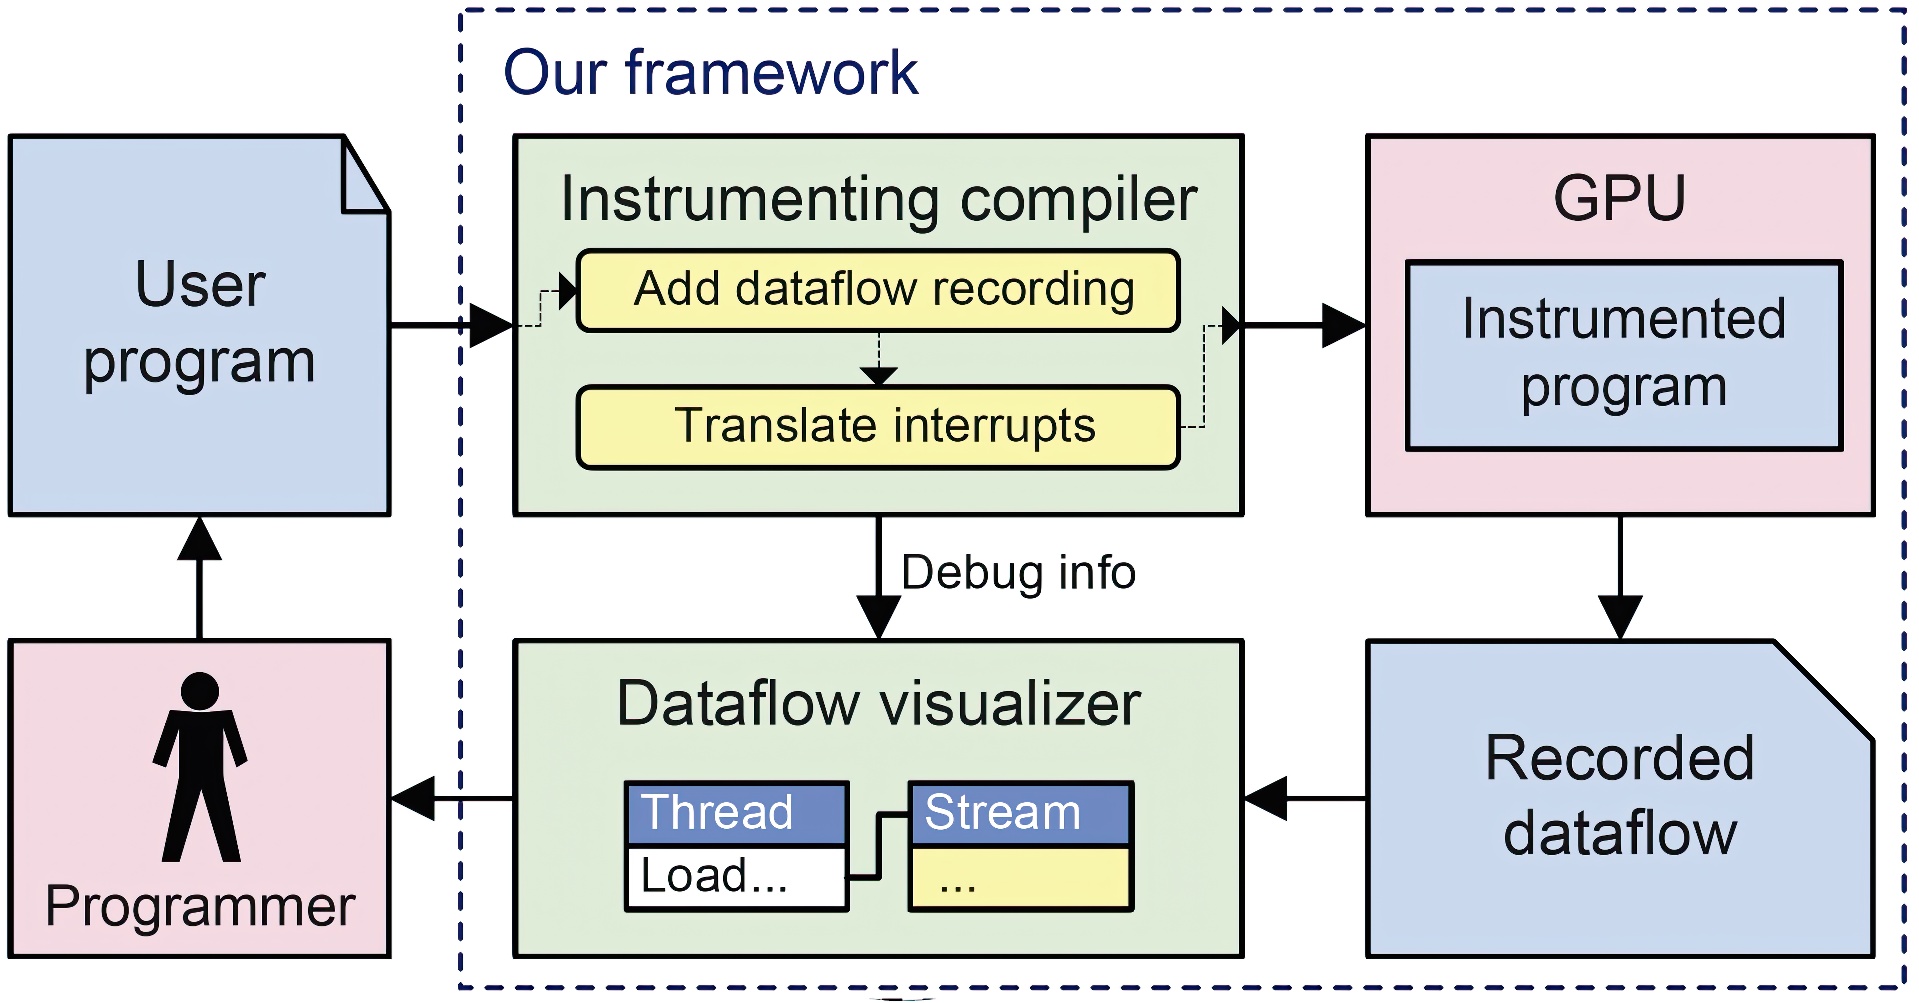
We present a novel framework for debugging GPU stream programs through automatic dataflow recording and visualization. Our debugging system can help programmers locate errors that are common in general purpose stream programs but very difficult to debug with existing tools. A stream program is first compiled into an instrumented program using a compiler. This instrumenting compiler automatically adds to the original program dataflow recording code that saves the information of all GPU memory operations into log files. The resulting stream program is then executed on the GPU. With dataflow recording, our debugger automatically detects common memory errors such as out-of-bound access, uninitialized data access, and race conditions — these errors are extremely difficult to debug with existing tools. When the instrumented program terminates, either normally or due to an error, a dataflow visualizer is launched and it allows the user to examine the memory operation history of all threads and values in all streams. Thus the user can analyze error sources by tracing through relevant threads and streams using the recorded dataflow.A key ingredient of our debugging framework is the GPU interrupt, a novel mechanism that we introduce to support CPU function calls from inside GPU code. We enable interrupts on the GPU by designing a specialized compilation algorithm that translates these interrupts into GPU kernels and CPU management code. Dataflow recording involving disk I/O operations can thus be implemented as interrupt handlers. The GPU interrupt mechanism also allows the programmer to discover errors in more active ways by developing customized debugging functions that can be directly used in GPU code. As examples we show two such functions: assert for data verification and watch for visualizing intermediate results.
References:
1. Boyer, M., Skadron, K., and Weimer, W. 2008. Automated dynamic analysis of CUDA programs. In Third Workshop on Software Tools for MultiCore Systems.Google Scholar
2. Buck, I., Foley, T., Horn, D., Sugerman, J., Fatahalian, K., Houston, M., and Hanrahan, P. 2004. Brook for GPUs: stream computing on graphics hardware. ACM Trans. Graph. 23, 3, 777–786. Google ScholarDigital Library
3. Chazan, D., and Miranker, W. L. 1969. Chaotic relaxation. Linear Algebra Appl. 2, 199–222.Google ScholarCross Ref
4. Cytron, R., Ferrante, J., Rosen, B. K., Wegman, M. N., and Zadeck, F. K. 1991. Efficiently computing static single assignment form and the control dependence graph. ACM Trans. Program. Lang. Syst. 13, 4, 451–490. Google ScholarDigital Library
5. Duca, N., Niski, K., Bilodeau, J., Bolitho, M., Chen, Y., and Cohen, J. 2005. A relational debugging engine for the graphics pipeline. ACM Trans. Gr. 24, 3, 453–463. Google ScholarDigital Library
6. Flanagan, C., and Freund, S. N. 2004. Atomizer: a dynamic atomicity checker for multithreaded programs. In Proceedings of POPL ’04, ACM, New York, NY, USA, 256–267. Google ScholarDigital Library
7. Hack, S., Grund, D., and Goos, G. 2006. Register Allocation for Programs in SSA-Form. In Compiler Construction 2006, Springer, A. Zeller and A. Mycroft, Eds., vol. 3923, 247–262. Google ScholarDigital Library
8. Hou, Q., Zhou, K., and Guo, B. 2008. BSGP: Bulk-Synchronous GPU Programming. ACM Trans. Gr. 27, 3, 9. Google ScholarDigital Library
9. Lefohn, A., Houston, M., Boyd, C., Fatahalian, K., Forsyth, T., Luebke, D., Munshi, A., Olick, J., Owens, J., Pellacini, F., Pharr, M., and Shopf, J. 2008. Beyond programmable shading. ACM SIGGRAPH 2008 Course Notes. Google ScholarDigital Library
10. Microsoft, 2007. PIX: the Direct3D profiling and debugging tool. DirectX 10 SDK.Google Scholar
11. NVIDIA, 2008. CUDA-GDB: The NVIDIA CUDA Debugger.Google Scholar
12. NVIDIA, 2008. NVIDIA CUDA Programming Guide 2.0.Google Scholar
13. NVIDIA, 2008. NVIDIA Shader Debugger.Google Scholar
14. Owens, J. D., Luebke, D., Govindaraju, N., Harris, M., Krger, J., Lefohn, A. E., and Purcell, T. J. 2007. A survey of general-purpose computation on graphics hardware. Computer Graphics Forum 26, 1, 80–113.Google ScholarCross Ref
15. Patney, A., and Owens, J. D. 2008. Real-time reyes-style adaptive surface subdivision. ACM Trans. Gr. 27, 5, 1–8. Google ScholarDigital Library
16. Purcell, T. 2005. GPGPU: general-purpose computation on graphics hardware: debugging tools. ACM SIGGRAPH 2005 Course Notes. Google ScholarDigital Library
17. Ronsse, M., and Bosschere, K. D. 1999. Recplay: a fully integrated practical record/replay system. ACM Trans. Comput. Syst. 17, 2, 133–152. Google ScholarDigital Library
18. Ronsse, M., Christiaens, M., and Bosschere, K. D. 2003. Debugging shared memory parallel programs using record/replay. Future Gener. Comput. Syst. 19, 5, 679–687. Google ScholarDigital Library
19. Savage, S., Burrows, M., Nelson, G., Sobalvarro, P., and Anderson, T. 1997. Eraser: a dynamic data race detector for multithreaded programs. ACM Trans. Comput. Syst. 15, 4, 391–411. Google ScholarDigital Library
20. Strengert, M., Klein, T., and Ertl, T. 2007. A hardware-aware debugger for the OpenGL shading language. In Graphics Hardware ’07, 81–88. Google ScholarDigital Library
21. Wikipedia, 2008. De Casteljau’s algorithm. http://en.wikipedia.org/wiki/De_Casteljau’s_algorithm.Google Scholar