“Biodigital: Transform Data to Experience, beyond Data Visualization” by Ito and Hidalgo
Conference:
Type(s):
Title:
- Biodigital: Transform Data to Experience, beyond Data Visualization
Presenter(s)/Author(s):
Entry Number:
- 25
Abstract:
INTRODUCTION
?Biodigital? is a Sci-Fi interactive story set in the year 2117 that combines VR film, immersive 3D environments, and VR data visualization. It turns data into a cinematic experience where a user is enmeshed as a character in the story. This VR storytelling tells the tale of humanity a hundred years from now. It also encourages us to think ?How should we live in the future??
We focus on how to tell stories and aim to provide more engaging or efficient ways to learn from data. The theme of this work was to explore how we could use the VR world to embody stories hidden behind collections of numbers called ?data.? The concept, ?Data to Experiences? is sublimating data into virtual reality (VR) experiences beyond data visualization.
CONCEPT: DATA TO EXPERIENCES
The concept of the Collective Learning group at the MIT Media Lab is transformation of data into knowledge, or ?Data to stories?. The group develops analytical, interactive and web-based visualizations to help users better-understand the world?s macro structures. Users can create their own original stories from results of data analysis using these tools.
We expanded ?Data to Stories? to ?Data to Experiences.? The concept, ?Data to Experiences? is transforming data into VR experiences, where a user will ?feel? the data in a 3D environment. The user learns the data in more natural and engaging ways beyond data visualization on 2D media. An immersive experience in the data-driven world provokes the user?s active learning [Christou 2010].
PROTOTYPE: VR DATA EXPERIENCE
3.1 Walk through the data-driven world
We created the first prototype of VR content called ?VR DATA EXPERIENCE? in 2016, using the demographic data from DataUSA – https://datausa.io/. Through short VR storytelling, VR DATA EXPERIENCE tells us stories of immigration and who lives now in America in the form of demographics. Users can not only walk through the 3D data-driven world, but also interact with it. This interactive world will be linked to the latest US demographic data. Users can change this VR world by interacting with the 3D objects in it, and feel and understand their meanings.
3.2 Embodiments of data
By analyzing DataUSA, the user can view the history of ?waves of immigration? from various routes settling into America over a long period of time.
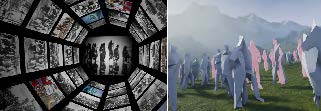
For example, different aspects of the US immigration history may be seen by a key word ?non-English Speakers?-or even by seemingly-innocuous data on population ratios. Population density expressed by 3D human figures around the user changes according to the group that the user selects to see. This density indicates the fraction of various non-English speakers in the US state selected by the user. The user can feel and understand the fraction of non-English speakers in the overall population, which may be similar to feeling the various comfort levels in the train depending on how crowded the train is. Exemplary images from our prototype VR world are shown in Figure 2. Combining storytelling and almost tactile interaction with data greatly enhance users? understanding on information.
VR STOYTELLING : BIODIGITAL
4.1 VR as a way to tell stories
Following the first prototype, VR DATA EXPERIENCE, we developed the VR content, Biodigital, which was released in 2018. The Biodigital is a VR storytelling platform based on data-driven stories. We shifted the expression from data visualization towards storytelling to further enhance the engaging power of content. Our script combines data-driven stories with a scientific fiction. One goal of this work is to achieve profound learning that 2D media cannot offer. Through the cycles of bodily sensation, interactivity and sophisticated Sci-Fi world storytelling, the user dives into learning.
4.2 Data-driven stories
?Pantheon? [Cristian Jara-Figueroa 2019] creates a simple dataset focused only on biographical information by using data from Freebase and 277 language editions of Wikipedia. This project particularly focuses on what we can learn from this data about the creation of knowledge across history, the relation between accomplishments and fame, and information including one we still know and one fading out of our historical memory.
The visualizations of the Pantheon reveals that communication technologies-from printing to social media-affected our historical records as the way ideas were spread and recorded changed over time. For example, the Pantheon tells us the following story. ?Printing revived the writings of ancient Greeks, which had been almost forgotten in Europe, and also fueled the rise of a scientific and artistic revolution. Printing gave scholars access to hundreds of books allowing them for the first time to combine ideas conceived in different eras and geographical areas. Society finally developed a long-term memory, discovering that the unknowns to be discovered were in the future, not the past.?
4.3 Stories to VR experiences
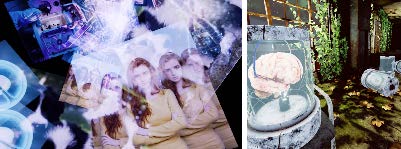
In the Biodigital project, we created a VR storytelling by combining the history of communication technologies, revealed by the dataset Pantheon produced, and the original Sci-Fi story of the next 100 years. The Biodigital tells the story of how humans transitioned into the biodigital space. It begins with the tale of societal changes triggered by the rise of ancient communication technologies, from printing to television. Then, the rise of neuroimplantable devices allowed humans to clone their minds into the biodigital space. The neuroimplantable technology was accompanied by new moral dilemmas, who questioned whether a person?s mental clone(s) could remain telepathically connected to their original self.
Stories driven by data expand across the 3D VR space. The user can visit any point of time and experience the birth of media. Every user experience is deployed within the big picture of a VR Sci-Fi story. This project analyzes the Wikipedia data and derive stories to enable attractive VR learning experience through the history and facts behind collections of numbers called ?data.?
CONCLUSION
We created the Biodigital to show the potential of VR for education. Also, we explored the ways to import data into a 3D environment and create VR contents more engaging than in the conventional 2D environment. This project offers a new approach to create a VR content by combining data analysis, data visualization and storytelling. Although results of data analysis are just clusters of numbers, transforming them in the VR environment will allow more engaging and deeper learning experience for users. VR may be the optimal educational tool to provoke people?s curiosity for learning the real world. A new possibility of 3D data-driven experience lies beyond the data visualization achieved by beautiful 2D media.
References:
- Chris Christou. 2010. Virtual Reality in Education. In Affective, Interactive and Cognitive Methods for E-Learning Design: Creating an Optimal Education Experience (1st. ed.), Aimilia Tzanavari and Nicolas Tsapatsoulis (Eds.). Information Science Publishing, Hershey, PA, 228–243. https://doi.org/10.4018/978-1-60566-940-3
- Cesar A Hidalgo Cristian Jara-Figueroa, Z Yu Amy. 2019. How the medium shapes the message: Printing and the rise of the arts and sciences. PloS one (Feb 2019). https://doi.org/10.1371/journal.pone.0205771
Keyword(s):
Acknowledgements:
To Cristian Jara Figueroa for providing the dataset from the Pantheon. To Daniel Magnani for the great composition in the Biodigital. To Andrea Margit and Mika Kanaya for their assistance to release the Biodigital on the Steam.


