
“Visually representing multi-valued scientific data using concepts from painting”
Conference:
Type(s):
Interest Area:
- Technical
Title:
- Visually representing multi-valued scientific data using concepts from painting
Session/Category Title: Colliding, Caving & Coloring
Presenter(s)/Author(s):
Abstract:
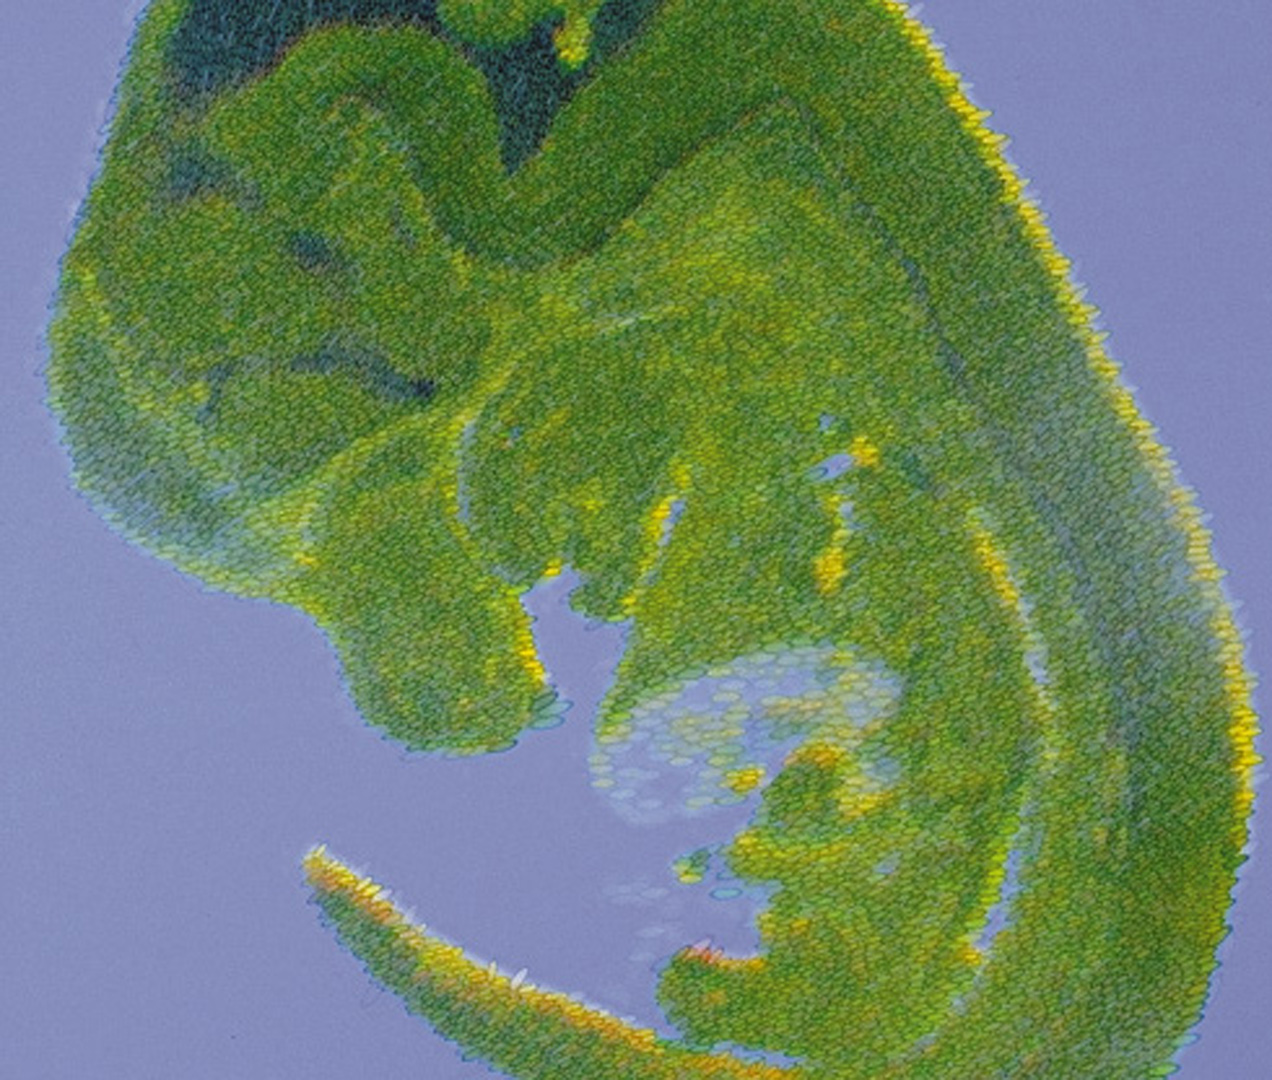
Layers of varying brush strokes are used to visually represent 2D images of multi-valued scientific data. Example visualizations display up to eight values simultaneously so that they can be understood in context.
References:
1. 1 E. T. Ahrens, D. H. Laidlaw, C. Readhead, C. F. Brosnan, S. E. Fraser, and R. E. Jacobs. MR microscopy of transgenic mice that spontaneously acquire experimental allergic encephalomyelitis. Magnetic Resonance in Medicine, (1998). (to appear).
2. 2 T. Delmarcelle and L. Hesselink. Visualizing second-order tensor fields with hyperstream lines. IEEE Computer Graphics and Applications, 13 (1993), 25-33.
3. 3 G. G. Gornowicz, Continuous-field image-correlation velocimetry and its application to unsteady flow over an airfoil. Eng. thesis, California Institute of Technology, 1997.
4. 4 P. E. Haeberli, Paint by numbers: Abstract image representations. In Computer Graphics (SIGGRAPH 90 Proceedings), F. Baskett, ed., vol. 24, Aug. 1990, 207-214.
5. 5 L. Hesselink, F. H. Post, and J. J. van Wijk. Research issues in vector and tensor field visualization. IEEE Computer Graphics and Applications, 14 (1994), 76-79.
6. 6 G. Kreutz, Problem solving for oil painters. Watson-Guptill Publications, 1986.
7. 7 B. J. Meier, Painterly rendering for animation. In SIGGRAPH 96 Conference Proceedings, H. Rushmeier, ed., Annual Conference Series, ACM SIGGRAPH, Addison Wesley, Aug. 1996, 477-484.
8. 8 E. R. Tufte, The visual display of quantitative information. Graphics Press, Cheshire, Connecticut, 1983.