
“3-D graphic display of discrete spatial data by prism maps” by Franklin and Lewis
Conference:
Type(s):
Title:
- 3-D graphic display of discrete spatial data by prism maps
Presenter(s)/Author(s):
Abstract:
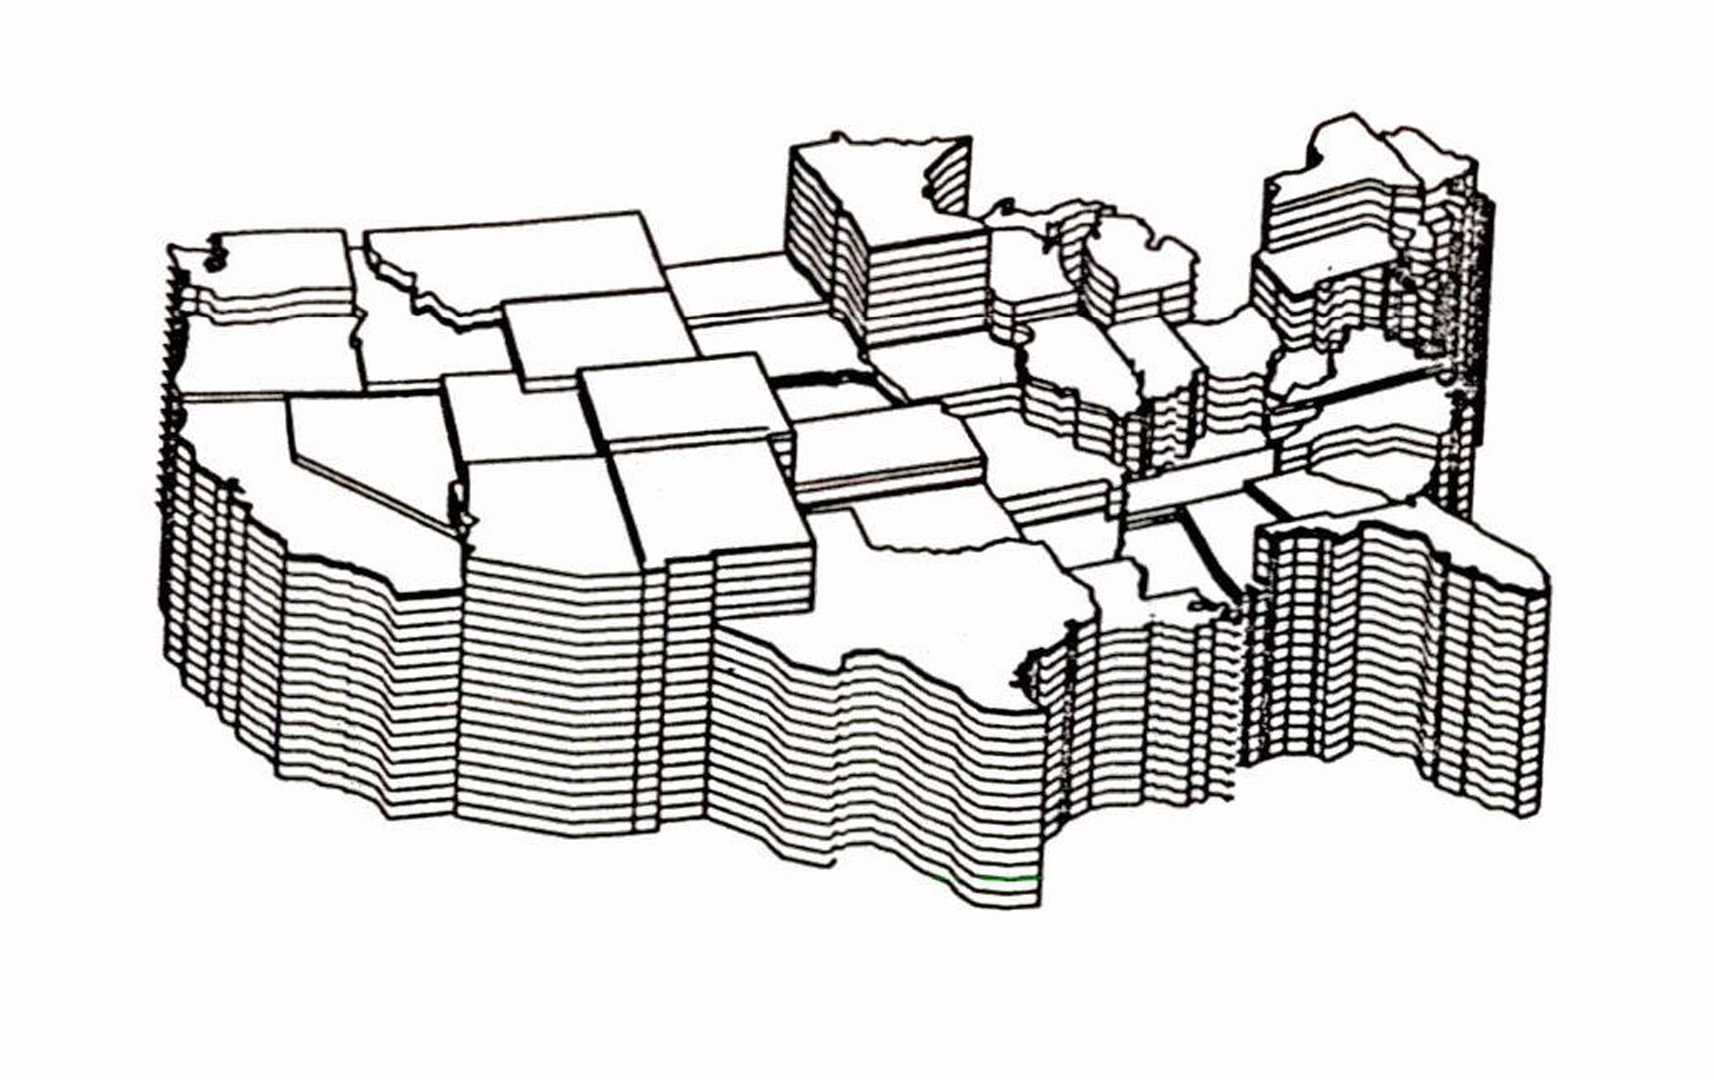
An efficient algorithm for displaying 3-D scenes showing a discrete spatially varying surface is described. Given a 2-D map or planar graph composed of polygons where each polygon has a positive real number attribute, a prism is erected on each polygon with height proportional to that attribute. The resulting 3-D scene is plotted with shading and hidden lines removed. Thus the spatial variation of the attribute may be quickly and intuitively grasped by the nontechnical observer. This has applications to areas such as geography if the map is a cartographic map, or to physics if the map diagrams the periodic table. The algorithm takes time O(N*log(N)) where N is the number of edges in the map. Most of the calculations can be done without knowing the prism heights so extra plots with different attributes for the prisms can be produced quickly. This algorithm has been implemented and tested on maps of up to 12000 edges.
References:
1. Anderson, Delmar E. & Angel, James L. & Gorney, Alexander J. World Data Bank II: content, structure & application. An Advanced Study Symposium on Topological Data Structures for Geographic Information Systems, Oct 16-21, 1977, Laboratory for Computer Graphics and Spatial Analysis, Graduate School of Design, Harvard University.
2. Chrisman, Nick. Concepts of space as a guide to cartographic data structures. An Advanced Study Symposium on Topological Data Structures for Geographic Information Systems, Oct 16-21, 1977, Laboratory for Computer Graphics and Spatial Analysis, Graduate School of Design, Harvard University.
3. Dougenik, James. LINGUIST: A table driven language model for Odyssey. An Advanced Study Symposium on Topological Data Structures for Geographic Information Systems, Oct 16-21, 1977, Laboratory for Computer Graphics and Spatial Analysis, Graduate School of Design, Harvard University.
4. Douglas, David & Peucker, Tom. Algorithms for the reduction of the number of points required to represent a digitized line or its caricature. Canadian Cartographer, Dec 1973.
5. Franklin, Wm. Randolph. Combinatorics of hidden surface algorithms. Harvard University, Center for Research in Computing Technology, Technical Report, 1978.
6. Knuth, D. E. The Art of computer programming, vol. 3. Sorting and Searching, Addison-Wesley, 1973.
7. The Lab for Computer Graphics and Spatial Analysis, Harvard University. ASPEX users’ reference manual, (Jan. 1978).
8. The Lab for Computer Graphics and Spatial Analysis, Harvard University. SYMVU manual, (1977).
9. Mandlebrot, Benoit. Fractals: form, change and dimension. WH Freeman and Co., San Francisco, 1977.
10. Newell, M. E. The progression of realism in computer generated images, ACM 1977 National Conference.
11. Newman, W. M. & Sproull, R. F. Principles of interactive computer graphics. McGraw-Hill, 1973.
12. Tobler, Waldo. A Computer Program to Draw Perspective Views of Geographic Data. Cartographic Lab Report, #1, Dept. of Geography, U. of Michigan.